
Abstract
The aim of this study was to quantify the plasma efavirenz concentrations over 6 months in black HIV-1-infected South African children (3–14 years), from resource-limited households, attending an outpatient clinic. The children were antiretroviral treatment (ART) naive and received efavirenz in combination with two nucleoside reverse transcriptase inhibitors according to South African national guidelines. Two blood samples were taken between 12 and 20 h after the last efavirenz dose at 1 (n = 58), 3 (n = 54), and 6 (n = 54) months post-ART initiation. A total of 328 efavirenz mid-dose plasma samples from 58 patients was determined with a validated liquid chromatography tandem mass spectrometry method. Viral suppression (<25 copies/ml) was achieved in 95% of the children after 6 months on ART. The median (range) plasma concentration at time points 1 and 2 were 2.06 (0.10–11.14) and 1.80 (0.14–10.70) μg/ml with respective mean (±SD) blood sampling times of 15.24 (2.03) and 16.91 (2.03) h post-evening dose. Efavirenz plasma samples within the therapeutic range of 1–4 μg/ml accounted for 58%; 17% were <1 μg/ml and 25% were >4 μg/ml over the 6 months. Efavirenz levels persistently >4 μg/ml were recorded for 13 (23%) children and 3 (5%) children had persistent efavirenz levels <1 μg/ml. Possible reasons for efavirenz plasma levels outside the accepted therapeutic range include genetic variation in drug metabolism, incorrect dosing, drug–drug interactions, and nonadherence. However, these need to be further explored and the importance of sequential plasma levels has been highlighted in this study.
Introduction
T
The need to monitor efavirenz levels, especially in adults, has been investigated and published fairly extensively. 4,8,13,14 Some of these studies have investigated the plasma efavirenz levels and applied mid-dosing sampling times. Marzolini and co-workers recommended 1–4 μg/ml as a suitable target when sampling between 8 and 20 h postdose. 8 Updated guidelines published in 2006 support the C min to be above 1 μg/ml. 15 Several studies have reported on the altered efavirenz metabolism in HIV-infected patients associated with CYP2B6 polymorphisms. It has been shown that elevated efavirenz concentrations are more frequently observed in Africans due to variation of the CYP2B6 gene and more specifically due to a polymorphic homogeneous genotype, 516G > T, encoding for the CYP2B6 isoenzyme. 7,16 –18
Limited information on efavirenz plasma concentrations in sub-Saharan HIV-1-infected patients (children and adults) is available. 17,19 In this study we present data on efavirenz plasma levels taken in South African HIV-infected children at 1, 3, and 6 months after the commencement of ART. To our knowledge, this is the only study in South African HIV-infected children that has measured serial efavirenz levels over a period of time, and only the second study to investigate efavirenz plasma levels in black South African children.
Materials and Methods
Population and study design
This was a prospective study of children attending the outpatient clinic at Harriet Shezi Children's Clinic, Chris Hani Baragwanath Hospital, Soweto, South Africa. The cohort included children (3–14 years) of both genders with no prior exposure to ART, eligible for ART, and all from resource-limited households.
Exclusion criteria included concomitant or recent (within 4 weeks of the study visit) use of any known P450 cytochrome inducers or inhibitors, tuberculosis infection, renal and/or hepatic dysfunction, and chronic diarrhea. Ethics approval was obtained from the North-West University, Potchefstroom (NWU-0015-07-A5) and the University of the Witwatersrand, Johannesburg (reference no. 070413). ART eligibility was in accordance with national guidelines for the management of HIV-infected children in South Africa. The first line ART regimen for those over 3 years of age and over 10 kg of weight was comprised of stavudine, lamivudine, and efavirenz. Efavirenz dosing was based on weight banding per the national guidelines; for children weighing 10–14.9 kg, 15–19.9 kg, 20–24.9 kg, 25–32.9 kg, 33–40 kg, and >40 kg, the dose was 200, 250, 300, 350, 400, and 600 mg daily, respectively. 2 All of the children were receiving co-trimoxazole as primary prophylaxis prior to ART and during ART.
At each scheduled study visit children were assessed clinically and weight, height, dosages, and adherence were recorded. Laboratory investigations (hematology, chemistry, viral load, and CD4 cell count) were performed at baseline and every 6 months unless otherwise indicated. These tests were conducted at the National Health Laboratory Services (NHLS) at the Chris Hani Baragwanath Hospital. The viral load was detected with nucleic acid sequenced-based amplification (NASBA) performed with Nuclisens EasyQ (Biomerieux). A successful antiviral response was defined as a viral load lower than the detectable 25 copies/ml at 6 months. A virological “blip” was defined as a viral load measurement between 25 and 1000 copies/ml preceded and followed by repeated measurement below 25 copies/ml.
Assessment of adherence
Adherence was assessed verbally and checked on a preissued diary card at each study visit. Additional assessments of adherence were required whenever a renewal or repeat prescription was dispensed on a nonstudy visit day.
Measured adherence (%) was calculated as [(Volume prescribed – Volume returned)/Volume prescribed] × 100. Any discrepancies were addressed and additional adherence and counseling support were provided. Adherence was defined as good when the measured adherence was calculated between 93% and 107%. Nonadherence was defined when the measured adherence was calculated as <93% or >107%; this allowed for two doses to be missed or taken incorrectly during a 28-day prescription cycle.
Efavirenz blood sampling and analyses
Two consecutive mid-dose interval blood samples (between 12 and 20 h postdose) were taken at 1, 3, and 6 months using a canula. The exact times of the blood samples and the time of efavirenz administration for the three previous evenings prior to the study visit were recorded. Efavirenz plasma analyses were determined by an optimized and validated LC/MS/MS method adapted from previously published methods. 20,21 The calibration curve (n = 8) was linear over the range of 0.094–12 μg/ml. The mean (±SD) accuracy obtained for the calibration standards was 100.37% (6.32%) for 171 plasma standards and the coefficient of variation (CV%) was less than 8%. The within (intra-) and between (inter-)day CV% were less than 6% and 10%, respectively, for three quality control samples (low, middle, and high concentrations). The lower limit of quantification was set at 0.094 μg/ml. Retention times were 7.1 and 6.8 min for efavirenz and midazolam (internal standard), respectively. The following possible coadministered drugs—stavudine, lamivudine, sulfamethoxazole, trimethoprim, paracetamol, and amoxicillin—did not interfere with the chromatographic conditions to determine efavirenz accurately.
Statistical analyses
Descriptive statistics were used to describe demographic results as mean ± standard deviation (±SD), or median (minimum and maximum range) for the efavirenz plasma concentrations. Intra- and interpatient variability were expressed as coefficient of variation (CV%) and analyzed by repeated measures ANOVA. The paired t-test was used to investigate statistically significant differences (p < 0.05) between baseline and 6 month variables (refer to Table 1). The Friedman test (nonparametric) was applied to investigate differences between the median plasma concentrations at 1, 3, and 6 months, respectively. Correlations were assessed by the nonparametric Spearman test. The Mann–Whitney U test (nonparametric) was used to determine differences in the median efavirenz plasma concentrations of the patients defined as adherent or nonadherent. Data and statistical analyses were performed using GraphPad Prism version 5.00 for Windows, (GraphPad Software, San Diego, CA,
p Value <0.05 denotes statistical significant difference.
Only calculated for children younger than 10 years as available on WHO Anthro software.
Z-scores calculated using WHO Anthro and WHO AnthroPlus software.
BSA, body surface area.
Results
Patient demographics and characteristics
Sixty HIV-1-infected children were enrolled at baseline. Patient characteristics at baseline and 6 month post-ART are summarized in Table 1. All of the children were black Africans and 52% were males. The mean (±SD) age and weight were 6.8 (2.9) years and 20.19 (6.70) kg, respectively, at baseline. Most children had relatively low weight, height, and BMI values for their age and gender at baseline, but their linear growth improved significantly (p < 0.05, Table 1) over 6 months.
The median (range) viral load decreased significantly (p < 0.002) after 6 months post-ART from 52,500 (640–3,000,000) to 25 (25–170,000) copies/ml, respectively. Viral load values lower than detectable (<25 copies/ml) were measured for 95% (53/56) of the patients after 6 months. The remaining 5% (3/56) had viral load values of 780, 2800, and 170,000 copies/ml, respectively, at 6 months post-ART.
Efavirenz dose and plasma concentrations
The nighttime efavirenz doses were fairly evenly distributed between 200, 250, 300, and 350 mg (24%, 29%, 24.5%, and 17.5%) with only 5% of the doses being either 400 or 600 mg during the 6-month period. The mean (95% confidence interval) efavirenz daily doses were 13.92 (13.38–14.45), 13.65 (13.26–14.04), and 13.41 (13.08–13.74) mg/kg/d at 1, 3, and 6 months, respectively.
A total of 328 efavirenz mid-dose plasma samples from 58 patients (n = 58, 54, and 54 at 1, 3, and 6 months, respectively) were utilized in the concentration analyses over the 6-month period (Table 2). Efavirenz plasma levels outside the calibration range (0.094–12 μg/ml) accounted for nine samples from three patients (Table 2); these results were excluded from all of the calculations, but are reported where relevant as persistently <1 μg/ml or >4 μg/ml.
PK1, efavirenz concentration at time point 1. PK2, efavirenz concentration at time point 2.
TB treatment (n = 1); concentration >12 μg/ml (n = 1); missing data (n = 2).
TB treatment (n = 1); concentration >12 μg/ml (n = 1).
TB treatment (n = 4); concentration >12 μg/ml (n = 1); concentration <0.094 μg/ml (n = 1).
TB treatment (n = 4); concentration >12 μg/ml (n = 1); concentration below <0.094 μg/ml (n = 1).
TB treatment (n = 4); concentration >12 μg/ml (n = 1); concentration <0.094 μg/ml (n = 1).
TB treatment (n = 4); concentration >12 μg/ml (n = 1); concentrations <0.094 μg/ml (n = 2); missing data (n = 1).
A total of 164 efavirenz plasma samples were taken for the first time point at 1, 3, and 6 months, respectively. The median (range) efavirenz plasma concentration over the 6 months was 2.06 (0.10–11.14) μg/ml at a mean (±SD) sampling time of 15.24 (±2.03) h post-last dose. A total of 164 efavirenz plasma samples was also taken for the second time point at 1, 3, and 6 months, respectively. The median (range) efavirenz plasma concentration was 1.80 (0.14–10.70) μg/ml at a mean (±SD) sampling time of 16.91 (2.03) h post-last dose. The median efavirenz plasma concentrations at time points 1 and 2, respectively, were similar over the 6 months and did not indicate significant differences when compared between 1, 3, and 6 months (Friedman test).
There was a high level of variability in the efavirenz plasma concentrations between the study individuals (inter), namely 137% and 143% at time points 1 and 2, respectively. Variability within the same individual (intra) was much lower at 25% and 18% at time points 1 and 2, respectively, over the 6-month period.
The measured efavirenz concentrations showed significant positive correlation (p < 0.05) with age, dose, and weight at 1, 3, and 6 months, respectively (Spearman correlation coefficient r > 0.27–0.47).
Efavirenz plasma samples at time points 1 and 2 within the target range (1–4 μg/ml) represented 58% (189/328) of all the samples taken over the 6-month period. Subtherapeutic levels (<1 μg/ml) were reported for 17% (56/328) of samples and 25% (83/328) of samples were above 4 μg/ml taken during mid-dose interval.
The number of plasma concentrations <1 μg/ml accounted for 16% (18/114) at 1 month, 20% (22/108) at 3 months, and 15% (16/106) of the samples tested at 6 months. Persistent efavirenz concentrations <1 μg/ml were observed in 5% (3/56) of the children at 1, 3, and 6 months, with viral load values of 2800 and 170,000 copies/ml, respectively, in two of these children after 6 months. The viral load of the third child was <25 copies/ml, although the efavirenz levels were persistently below 1 μg/ml at 1, 3, and 6 months post-ART.
It was further observed that 23% (13/56) of the children had persistent efavirenz concentrations >4 μg/ml at 1, 3, and 6 months. Although 25% (83/328) of the measured efavirenz plasma concentrations were above 4 μg/ml, none of the patients stopped taking the efavirenz-based ART during the first 6 months due to side effects or for any other reasons. Very few side effects were reported in the study population in general. Mild side effects such as dreaming (nightmares), rash, and abdominal cramps that were reported subsided spontaneously within the first few weeks of treatment. Nightmares were reported in 7% (4/59) of the children during the first 4 weeks on treatment and insomnia was reported in 2% (1/59). Among these children, four had efavirenz plasma levels between 1 and 4 μg/ml and only one child who reported nightmares had elevated levels >4 μg/ml. This child was also one of the 13 patients who had persistently elevated efavirenz levels. Low grade transaminitis occurred in 11% (6/56) of the children of whom 7% (4/56) had efavirenz levels persistently above 4 μg/ml after 6 months on treatment. Figure 1 represents the combined efavirenz plasma concentration data vs. time at time point 1 (PK1) and time point 2 (PK2) over the 6-month period, indicating the plasma levels within the therapeutic range and outside the therapeutic range.
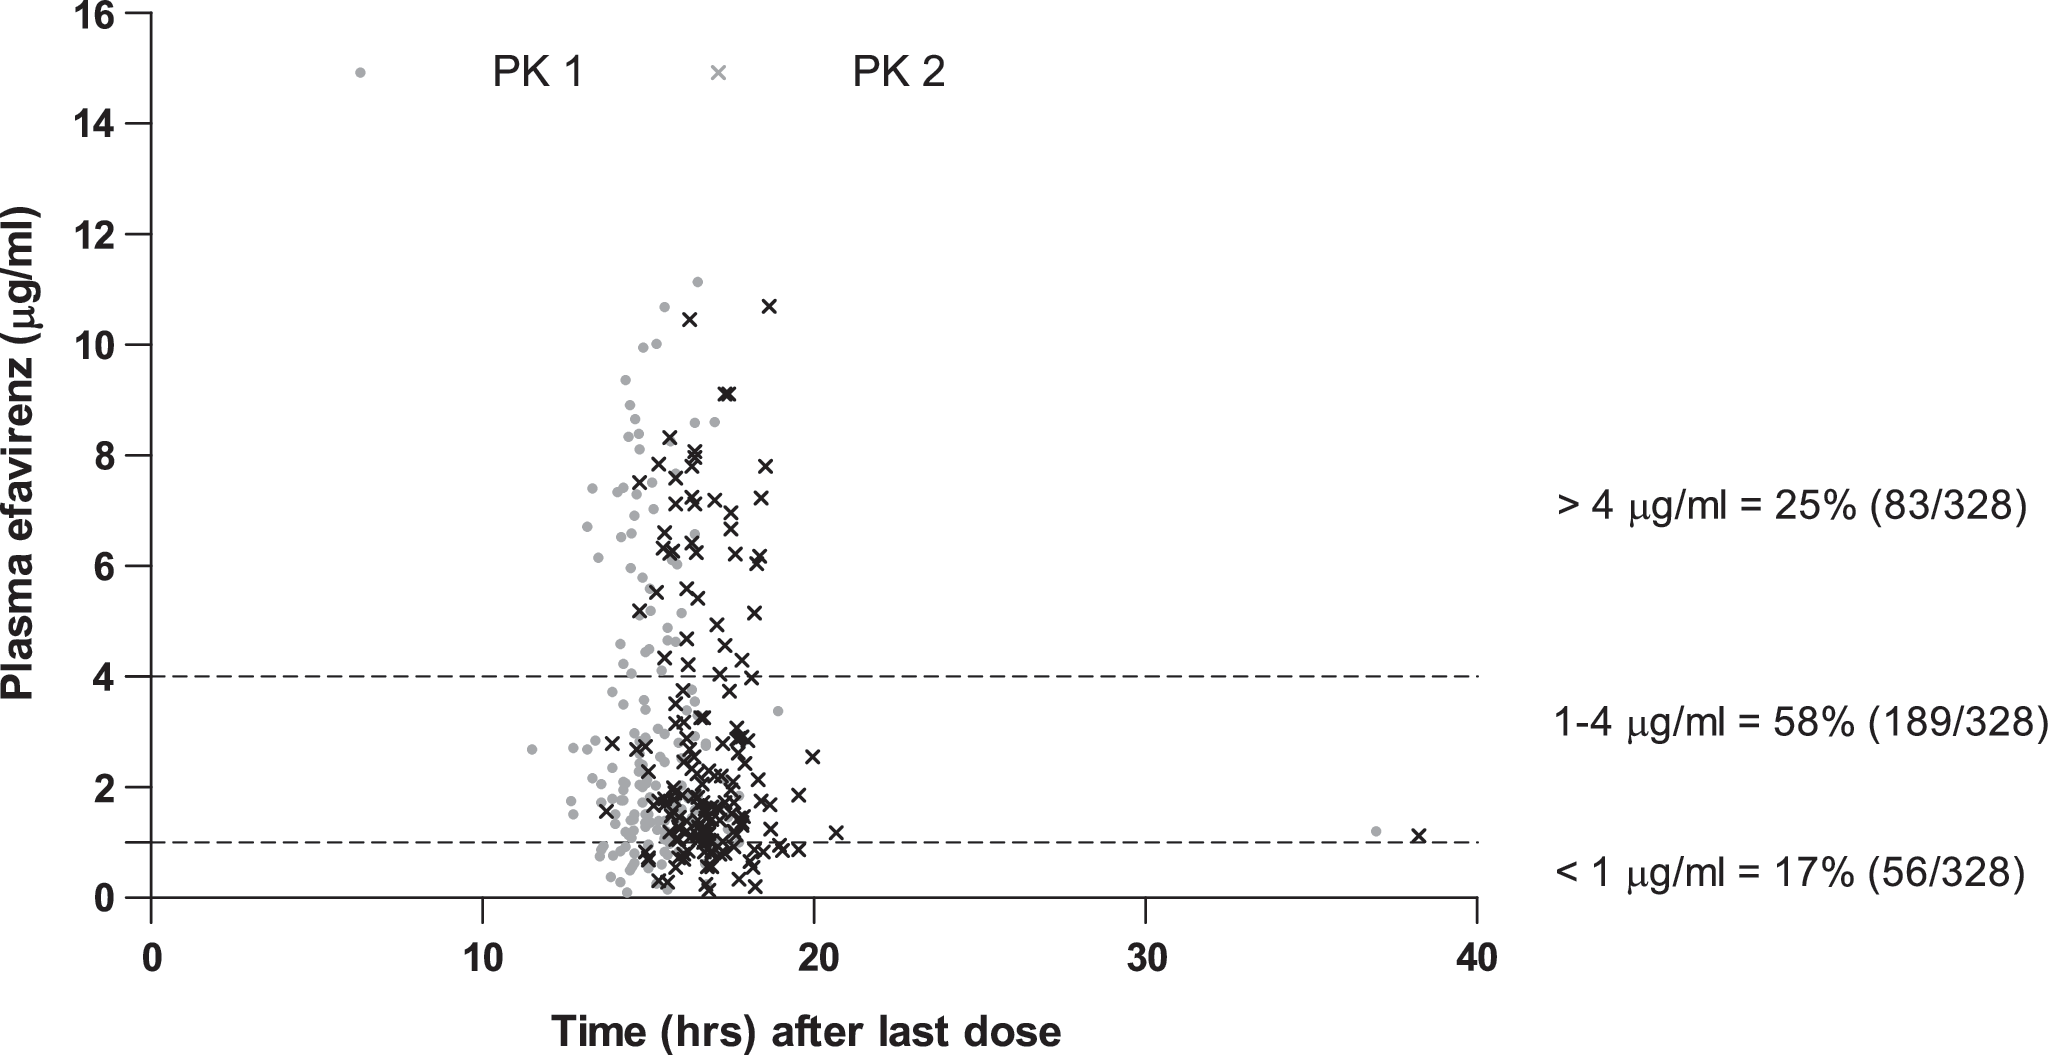
Plasma efavirenz concentrations at 1, 3, and 6 months post-ART. n = 164 plasma samples from 56 children at PK1 (time point 1). n = 164 plasma samples from 58 children at PK2 (time point 2).
Adherence and efavirenz plasma concentrations
Good adherence was recorded for 59% (35/59), 54% (30/56), and 18% (10/56) of the children at 1, 3, and 6 months, respectively. The number of adherence assessments (pill counts) was recorded for only 71% (42/59), 73% (41/56), and 59% (33/56) of the children resulting in a large number of patients (29%, 27%, and 41%) not returning their medicines and/or not reporting for adherence assessments at 1, 3, and 6 months, respectively. The median efavirenz plasma concentration (post-1 month) in the adherent (2.43 μg/ml) vs. the nonadherent (1.2 μg/ml) group was significantly (p = 0.02) different, but no statistical significant difference was observed in the median efavirenz plasma concentration when grouped (adherent vs. nonadherent) at 3 and 6 months post-ART (Mann–Whitney U test).
Viral load values >25 copies/ml were recorded for 5% (3/56) of the patients. Persistent plasma efavirenz levels <1 μg/ml were recorded for two of these patients at mid-dose intervals and the third had a borderline concentration of 1.01 μg/ml at 16.67 h post-last dose. The adherence of all three of these patients was very poor: two were nonadherent and the other never returned previous medicines for the specific adherence assessments.
Discussion
To our knowledge, this is the first study to report on sequential measured efavirenz levels at mid-dosing interval in a relatively large (n = 58) cohort of black South African HIV-infected children. It is well known that subtherapeutic efavirenz concentrations (<1 μg/ml) could result in viral mutations conferring drug resistance and leading to virological failure. 8,22,23 Conversely, central nervous system toxicity can occur at levels >4 μg/ml. 8 In our study, 95% of the children were virally suppressed with viral loads below detectable levels (<25 copies/ml) after 6 months on ART. The remaining 5% of the children had efavirenz plasma concentrations <1 μg/ml or at borderline and were not virally suppressed. These results support the findings of Marzollini and co-workers that efavirenz levels <1 μg/ml during mid-dose sampling will increase the possibility of virological failure. 8
Our findings of the median efavirenz plasma concentrations, 2.06 μg/ml and 1.80 μg/ml, taken at 15.24 and 16.91 h post-last dose are in agreement with other similar studies in which plasma levels (median 2.19, 1.58, and 2.8 μg/ml and mean 3.14 μg/ml) were also sampled at mid-dose. 8,19,24,25 Our mean efavirenz daily doses compared favorably to the average dose of PACTG 382 of 14.2 mg/kg/d and the median (range) dose of 13.3 (9.7–22.5) mg/kg/d of Wintergerst and co-workers. 24,26
Data from our study over a period of 6 months indicated that 58% of all the plasma samples were between 1 and 4 μg/ml, 17% were below 1 μg/ml, and 25% were above 4 μg/ml. It is important to emphasize that these efavirenz plasma levels were not taken at trough and are thus not actual C min plasma levels. All of these samples (except for 1%) were taken between 12 and 20 h after the last dose intake and fall within the mid-dosing interval as implemented by various other studies. 4,8,13,24,26 In a study conducted in Thailand, 71% of the samples were within 1–4 μg/ml, 13% were <1 μg/ml, and 10% were >4 μg/ml. The Thai children were, however, older (median of 12.3 years) and that could account for possible better compliance and similar dosages and thus the higher percentage of plasma levels within the 1–4 μg/ml target range. 25
Results from two independent studies in children suggested that efavirenz could be underdosed. Both these studies were, however, in small groups of children with slightly different dosing. 19,27 The study by Ren and co-workers in South African children reported that 40% had estimated trough levels (C min) below 1 μg/ml and the median efavirenz plasma level was reported as 1.58 μg/ml, sampled at mid-dose interval. 19 von Hentig and co-workers reported 64% of their children exhibited efavirenz plasma concentrations below 1 μg/ml. 27 However, in three other more recent studies, efavirenz plasma concentrations <1 μg/ml were reported for 8.8%, 13%, and 11% of the samples taken from 33 children, respectively, in each of the studies. 24–25,28
The study performed in the Netherlands was also sequential (plasma samples taken after 1 day and after 2 and 6 weeks post-ART) and the age and weight of these children were similar to our study children. 28 It could be argued that the actual number of trough levels (C min) <1 μg/ml from our study may be higher than the reported 17% as this was not taken at trough. Nevertheless, trough levels <1 μg/ml from our study are unlikely to be as high as in 40% or 64% due to the long half-life (40–55 h) of efavirenz. Possible explanations for the higher number of efavirenz trough concentrations (<1 μg/ml) in the studies by Ren and von Hentig could be that the efavirenz levels were measured on only one occasion (cross-sectional studies) compared to three occasions over 6 months in our study, and the number of children in our study was significantly larger compared to the 11 and 15 children, respectively, in the studies cited. 19,27
In a significantly larger percentage (25%) of our study efavirenz plasma levels were above 4 μg/ml when compared to the German (14.7%) 24 and Thai (10%) 25 studies but similar to the Netherlands study (23%) with sequential plasma sampling post ART. 28 The correlation between higher levels and adverse effects was nonsignificant in the German cohort and in the Thai children, except for psychiatric issues that were prominent in five children. The same nonsignificant trend was observed in our study; although 25% of the measured efavirenz plasma concentrations were >4 μg/ml, none of the patients stopped taking the efavirenz-based ART during the first 6 months due to side effects or any other reasons. A large number of children (23%) had persistent efavirenz concentrations >4 μg/ml at 1, 3, and 6 months with only one child reporting nightmares within the first few weeks of treatment. The prevalence of low-grade transaminitis was observed in 11% of the children, of whom four out of six had efavirenz levels persistently above 4 μg/ml. All of the children in this study were also taking co-trimoxazole and stavudine, thus the low grade transaminitis could not be solely attributable to elevated efavirenz plasma levels.
Although there was a decrease (59%, 54%, and 18%) in adherence (as defined by our criteria), the number of plasma concentrations <1 μg/ml did not change significantly (16%, 20%, and 15%) over the 6-month period. The numbers of patients not returning their old medication and not reporting for adherence assessments were higher at 6 months (41%) compared to 29% and 27% at 1 and 3 months, respectively, and this could account for the decrease in adherence at 6 months post-ART.
In summary, several reasons could contribute to efavirenz plasma levels being outside the accepted therapeutic range of 1–4 μg/ml. These include genetic variation in drug metabolism, incorrect dosing, drug–drug interactions, and nonadherence. Genotypic investigations into possible genetic polymorphisms on the CYP2B6 gene in this study population would be useful and could further explain the high interindividual variations in the efavirenz plasma concentrations. A limitation of this study is that although all possible efforts were made to monitor adherence in this outpatient clinic scenario, we cannot conclude that adherence did not affect the efavirenz plasma levels in this study population. However, the reasons for children having efavirenz plasma concentrations outside the therapeutic range (1–4 μg/ml) need to be further explored. Therapeutic drug monitoring may be beneficial and could play a major role in elucidating these reasons as well as serving as a tool to evaluate adherence. The importance of sequential plasma measurements was highlighted in this study.
Footnotes
Acknowledgments
M. Viljoen received a Thuthuka research grant from the North-West University and the National Research Foundation (NRF). The authors gratefully acknowledge the contributions of the staff of the Harriet Shezi Children's Clinic, especially the kind and very professional services of Matshediso Moilwa. We also gratefully acknowledge the Department of Nutrition (North-West University, Potchefstroom Campus) for the use of the Agilent 1200 LC/MS/MS.
Author Disclosure Statement
No competing financial interests exist.