
Abstract
Serological assays for estimating HIV-1 incidence are prone to misclassification, limiting the accuracy of the incidence estimate. Adjustment factors have been developed and recommended for estimating assay-based HIV-1 incidence in cross-sectional settings. We evaluated the performance of the recommended adjustment factors for estimating incidence in national HIV surveys in three countries in sub-Saharan Africa. The BED-capture enzyme immunoassay was applied to stored blood specimens from (1) pregnant women aged 15–49 years attending antenatal clinics in Côte d'Ivoire (1998–2004), (2) adults aged 15–49 years participating in a demographic health survey in Kenya (2003), and (3) adults aged 15–49 years participating in a national household serosurvey in South Africa (2005). Assay-derived incidence estimates were corrected for misclassification using recommended adjustment factors and, where possible, were compared to mathematically modeled incidence in the same populations. Trends in HIV prevalence were compared to trends in assay-derived incidence to assess plausibility in the assay-derived trends. Unadjusted incidence was 3.8% [95% confidence interval (CI) 3.3–4.5] in Côte d'Ivoire, 3.5% (2.7–4.3) in Kenya, and 4.4% (CI 2.3–6.5]) in South Africa. Adjusted incidence was 2.9% (CI 2.1–3.7) in Côte d'Ivoire, 2.6% (CI 2.0–3.2) in Kenya, and 2.4% (CI 1.7–3.1) in South Africa. After adjustment, peak incidence shifted from older to younger age groups in Côte d'Ivoire and South Africa. Modeled HIV incidence was 1.0% (CI 1.02–1.08) in Kenya and 2.0% (CI 1.7–2.4) in South Africa. After applying the recommended adjustments factors, adjusted assay-derived estimates remained implausibly high in two of three populations evaluated. For more accurate measures of assay-derived population incidence, adjustment factors must be locally derived and validated. Until improved assays are available, caution should be applied in the use and interpretation of data from incidence assays.
Introduction
I
The gold standard for estimating HIV incidence is through prospective cohort studies of HIV-negative persons followed over time. Because of the high complexity and costs to implement such studies, HIV incidence is alternatively estimated using mathematical models that infer adult incidence based on HIV prevalence data from cross-sectional serologic surveys and mortality assumptions. 4 –11
HIV-1 incidence can also be estimated using serologic assays that directly measure recent HIV-1 infection in cross-sectional specimens. 12 –21 The key advantages of the laboratory-based method for measuring incidence are that laboratory assays do not require longitudinal follow-up of persons over time, the collection of serial blood specimens to estimate HIV-1 incidence, or assumptions about prevalence and mortality needed for mathematical models.
At the time this article was written, the BED-capture enzyme immunoassay (henceforth, for brevity, the BED assay) was the only commercially available HIV-1 incidence assay. The assay uses a multisubtype synthetic peptide to measure the increasing proportions of HIV-1-specific IgG to total IgG. This assay was calibrated and validated in various prospective cohorts comprised of differing HIV-1 subtypes, including the United Staes (subtype B), Thailand (subtypes B and E), The Netherlands (subtype B), Kenya (subtype A and C), Ethiopia (subtype C), Zimbabwe (subtype C), and India (subtype C) (B. Parekh, personal communication). The BED assay is currently used to estimate national HIV-1 incidence and monitor incidence trends in the population by applying the assay to cross-sectional specimens from national HIV surveillance surveys. 22 –27 Since 2005, the BED assay has been integrated into the U.S. HIV case-based surveillance system for HIV-1 incidence surveillance. 22
The BED assay has been found to overestimate HIV-1 incidence by misclassifying a proportion of long-term infections as recent infection on the assay. 28 –31 To correct for this misclassification, two post hoc adjustment factors derived from separate validations of the BED assay in longitudinal cohorts with follow-up of HIV-negative and HIV-positive persons were developed. These data originated from a cohort of postpartum women in Harare, Zimbabwe (N = 2749) and from the AIDSVAX B/B vaccine trial, which utilized data for men who have sex with men largely from the United States and the Netherlands (N = 120). 28,30 The adjustment factors in the two studies, which ranged from 0.052 in Zimbabwe to 0.056 in the United States and The Netherlands, differed by less than 5% from each other (p > 0.05 for the difference), and the adjusted BED estimates in both studies corresponded closely with the prospective follow-up estimates of HIV-1 incidence. These two studies represented the first application of BED adjustment factors to produce robust measures of assay-derived HIV-1 incidence in cross-sectional settings and due to these findings, the use of these “default” adjustment factors was subsequently recommended by the U.S. Office of the Global AIDS Coordinator for widespread application in settings where local BED adjustment factors were not available. 32
In this study, we evaluated the performance of the two recommended adjustment factors for estimating assay-derived HIV-1 incidence in three countries in sub-Saharan Africa without locally established BED adjustment factors. Unadjusted and adjusted BED estimates were compared to HIV-1 incidence estimates from mathematical models in the same population. In addition, trends in HIV-1 prevalence and adjusted HIV-1 incidence were compared across 10-year age bands and years to determine the plausibility of the adjusted HIV-1 incidence estimates.
Materials and Methods
Data sources
South Africa National Household Survey
South Africa conducted a national household survey of HIV-1 prevalence, behavior, and communication in 2005. 33 In brief, this survey was a probability-based sample of all persons aged ≥2 years in South Africa and residing in households. All participants provided verbal consent for data collection, including HIV testing using dried blood spots and a detailed questionnaire on demographics, behavior, and knowledge and attitudes. Caretakers of children aged <12 years provided proxy consent for the child. HIV test results were anonymous and linked to a behavioral questionnaire using a unique study number. A detailed description of the methods and results of this survey are described elsewhere. 26,33
The 2003 Kenya Demographic Health Survey
The 2003 Kenya Demographic Health Survey (KDHS), described in detail elsewhere, 34 was a probability-based population and health household survey of women aged 15–49 years and men aged 15–54 years in Kenya that has provided nationally representative estimates of demographic, behavioral, and social factors and HIV prevalence in the country. The HIV testing protocol for the 2003 KDHS was anonymous and conducted on dried blood spots identified by a unique study number that was linked to the survey questionnaire.
Côte d'Ivoire antenatal clinic surveillance
Temporal trends in HIV prevalence among pregnant women aged 15–49 years in Côte d'Ivoire have been monitored using data from antenatal (ANC) surveillance in selected clinic sites since 1997. 35 Unlinked and anonymous HIV testing is conducted on residual sera routinely collected for prenatal syphilis testing from pregnant women attending their first ANC visit. Blood specimens are linked by a unique study identification number to demographic and behavioral data collected during the prenatal visit and tested for HIV-1 antibodies using the national HIV testing algorithm.
Laboratory methods and HIV-1 incidence estimation
Using methods described elsewhere,
17
the BED assay was applied to stored frozen HIV-1-positive dried blood spot samples from the 2003 KDHS, stored HIV-1-positive serum samples from 10 urban ANC sites in Côte d'Ivoire in 1998, 2000, 2002, and 2004, and fresh HIV-1-positive dried blood spots collected for the 2005 South African National Household Survey. In the ANC sample, annual BED HIV-1 incidence and 95% confidence intervals (CI) were calculated using the U.S. Centers for Disease Control and Prevention's consensus formula for calculating HIV-1 incidence and standard errors using cross-sectional samples.
15,36
HIV-1 incidence was expressed as the cumulative incidence or risk of incidence infections in a 12-month period, which was a close approximation to the instantaneous incidence rate.
Calculation of unadjusted BED HIV-1 incidence for complex survey data with probability sampling (i.e., the 2003 KDHS and the South Africa 2005 National Household Survey) required individual sampling weights to be included in the calculation of BED HIV-1 incidence. The weighted formula for BED HIV-1 incidence and 95% CI was
where I 0 = the unadjusted HIV-1 incidence estimate, Î0 = weighted unadjusted HIV-1 incidence estimate, Ninc = number of persons testing recent on the assay, Ninc = weighted number of persons testing recent on the assay, Nneg = number of HIV-1-negative persons, Nneg = weighted number of HIV-1-negative persons, w=365 days/window period, and Deft = design effect.
The BED assay consensus mean window period of 155 days for all HIV-1 subtypes was used for Côte d'Ivoire and Kenya. A window period of 180 days for HIV-1 subtype C infection was used in South Africa. Default values for survey design effects, used for calculating sample sizes for ANC surveillance and national household surveys, were assumed for Côte d'Ivoire (Deft = 1.0), Kenya (Deft = 2.0), and South Africa (Deft = 2.0). To maximize comparability between countries, the analysis was restricted to persons aged 15–49 years in each survey.
Posttest adjustments
Adjusted HIV-1 incidence estimates (referred to below as II and III ) with 95% CI were calculated using methods described elsewhere. 28,30 In brief, II adjusts for the assay's short-term sensitivity [1 – α, where α is the proportion of false long-term cases among true recent infections occurring during the initial window period (w)], short-term specificity (1 – β, where β is the proportion of false recent cases among true long-term infections greater than w but less than 2w), and long-term specificity (1 – ɛ, where ɛ is the proportion of false-recent cases among true long-term infections ≥2w) on the BED. 30 The published values of α, β, and ɛ used for this analysis were 0.7682, 0.7231, and 0.0557, respectively. In contrast, III corrects for long-term specificity only and assumes α and β do not differ significantly and can therefore be assumed identical. 28 Because the II and III estimates never differed significantly in this analysis, for brevity, all adjusted estimates are presented for II only.
Mathematical and plausibility models for HIV-1 incidence
The Estimation and Projection Package (EPP) and Spectrum software package, developed by UNAIDS, 10,11,37 is a standardized modeling package that has been widely used to create national estimates of HIV-1 incidence and prevalence. The EPP and Spectrum model infer HIV-1 incidence in the adult population using HIV-1 prevalence data from ANC surveillance and an expected 11-year survival rate from HIV-1 infection to death. These data are calibrated using national estimates of HIV-1 prevalence from national population-based household surveys. Plausibility bounds (as opposed to 95% CI) for the EPP and Spectrum modeled HIV-1 incidence in the overall population under observation (e.g., males and females aged 15–49 years) are calculated using the methods developed by UNAIDS for the 2005 HIV/AIDS estimates. 36 The outputted number of new infections by age in the model can be used in combination with the estimated population size to estimate HIV-1 incidence by age groups. To date, plausibility bounds for HIV-1 incidence by age groups (e.g., 15–24 years) are not available in the EPP and Spectrum model.
In this evaluation mathematically modeled HIV-1 incidence was estimated using the 2009 version of the EPP and Spectrum model. A second mathematical model of HIV-1 incidence, developed by the Actuarial Society of South Africa (ASSA), was also applied to the South Africa data. 5,7,33 The assumptions, inputs, and outputs of the ASSA model are comparable to those of the EPP and Spectrum model though plausibility bounds were not available for the ASSA modeled estimates. The level of unadjusted and adjusted BED estimates for the population-based surveys in Kenya and South Africa were compared to mathematical models of HIV-1 incidence among adults aged 15–49 years. Additionally, “plausibility” models comparing BED HIV-1 incidence to corresponding trends in HIV-1 prevalence across time and 10-year age bands in the same population were assessed for plausibility with respect to expected epidemic trends, namely (1) changes in HIV-1 prevalence are expected to occur after changes in HIV-1 incidence, and (2) HIV-1 incidence is expected to be higher in younger age groups (that is, in adolescents and adults aged 15–24 years) and decline with increasing age. 38 –40
The influence of pregnancy on HIV incidence is not clearly established. Recent evidence suggests that acquisition of HIV infection may be significantly higher during pregnancy compared to the postpartum period; however, a prospective study of hormonal contraception and HIV-1 incidence found no difference in HIV acquisition by pregnancy and lactation status. 41,42 Due to uncertainty at this time about the effect of pregnancy on the risk of HIV-1 acquisition in the general population, we did not compare the level of assay-derived incidence in pregnant women with modeled incidence in the general adult population for Côte d'Ivoire, but rather focused the analysis on a comparison of trends in prevalence and incidence.
Results
South Africa 2005 National Household Survey
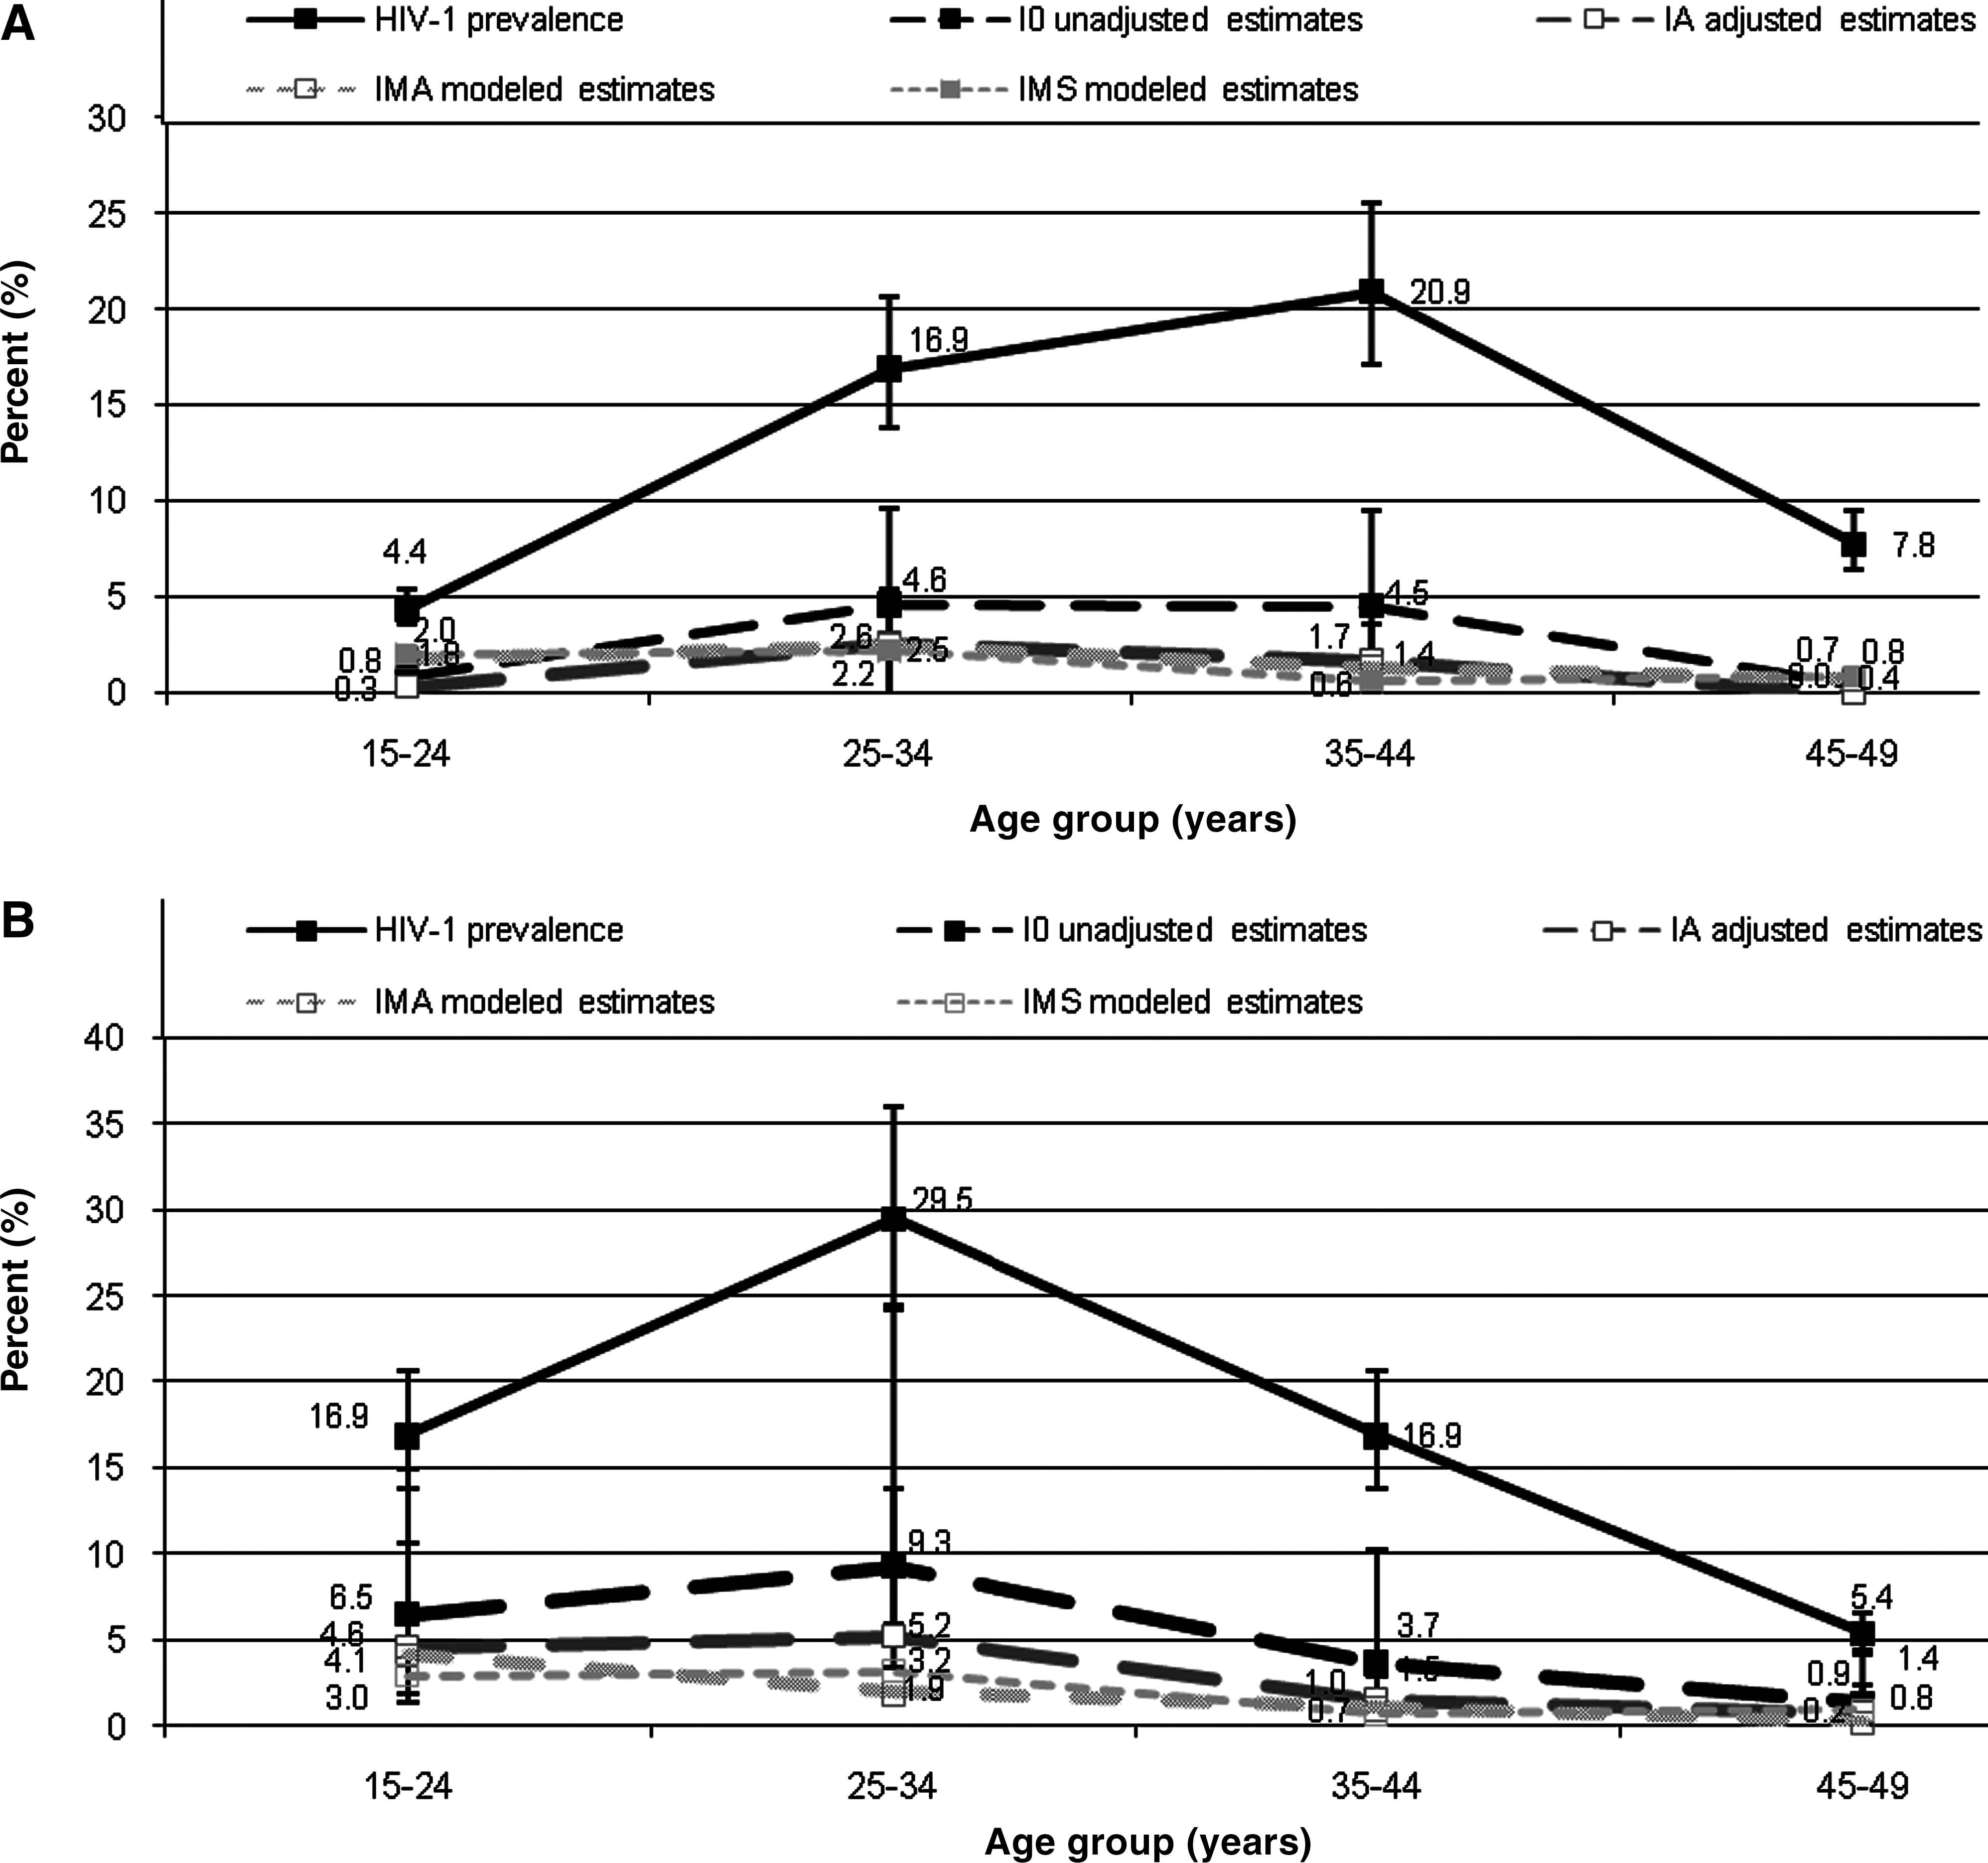
In previously reported data for the South Africa 2005 National Household Survey, 43 unadjusted BED HIV-1 incidence (I 0) in adults aged 15–49 years was 4.4% (95% CI 2.3–6.5). The adjusted estimate (II ) for adults aged 15–49 years was 2.4% (95% CI 1.7–3.1), 26 1.0% (95% CI 0.4–1.6) in males, and 3.8% (95% CI 2.6–5.0) in females. HIV-1 prevalence peaked in males aged 35–44 years at 20.9% and females aged 25–34 years at 29.5% (Fig. 1). In comparison, the II estimate was highest in males aged 25–34 years [2.6% (95% CI 0–5.4)] and females aged 15–24 years [4.6% (95% CI 3.2–6.0)] and 25–34 years [5.2% (95% CI 1.8–8.6)].
HIV prevalence, I
0
unadjusted estimates, II
adjusted estimates, and modeled estimates (IMA
and IMS
) among males (
The EPP and Spectrum modeled incidence estimates (IMS ) for South African males and females aged 15–49 years was 2.0% [plausibility bounds (PB) 1.7–2.4] overall, 1.7% (PB 1.4–2.0) in males, and 2.4% (PB 2.0–3.0) in females. In comparison, ASSA modeled incidence estimates (IMA ) were 2.2% overall, 1.9% in males, and 2.5% in females. The modeled estimates (IMS and IMA ) were approximately two times lower than the unadjusted BED estimates (I 0), but when compared to the adjusted BED estimates (II ), the modeled estimates fell within the range of the 95% CI of the adjusted BED estimate. For youth aged 15–24 years, both modeled estimates of HIV-1 incidence (IMS and IMA ) fell within the range of the 95% confidence intervals for the II estimate.
Kenya Demographic Health Survey
In the KDHS, 386 (91.5%) of 422 HIV-1-positive specimens from respondents aged 15–49 years were available for BED testing; 71 (18.4%) were classified as recent infections on the BED assay. Unadjusted BED HIV-1 incidence (I 0) for survey participants aged 15–49 years was 3.5% (95% CI 2.7–4.3) and was higher in females [4.3% (95% CI 3.0–5.5)] than in males [2.6% (95% CI 1.6–3.6)]. The adjusted estimates (II ) were 2.6% (95% CI 2.0–3.2) overall, 3.1% (95% CI 2.2–4.0) in females, and 2.1% (95% CI 1.3–2.8) in males.
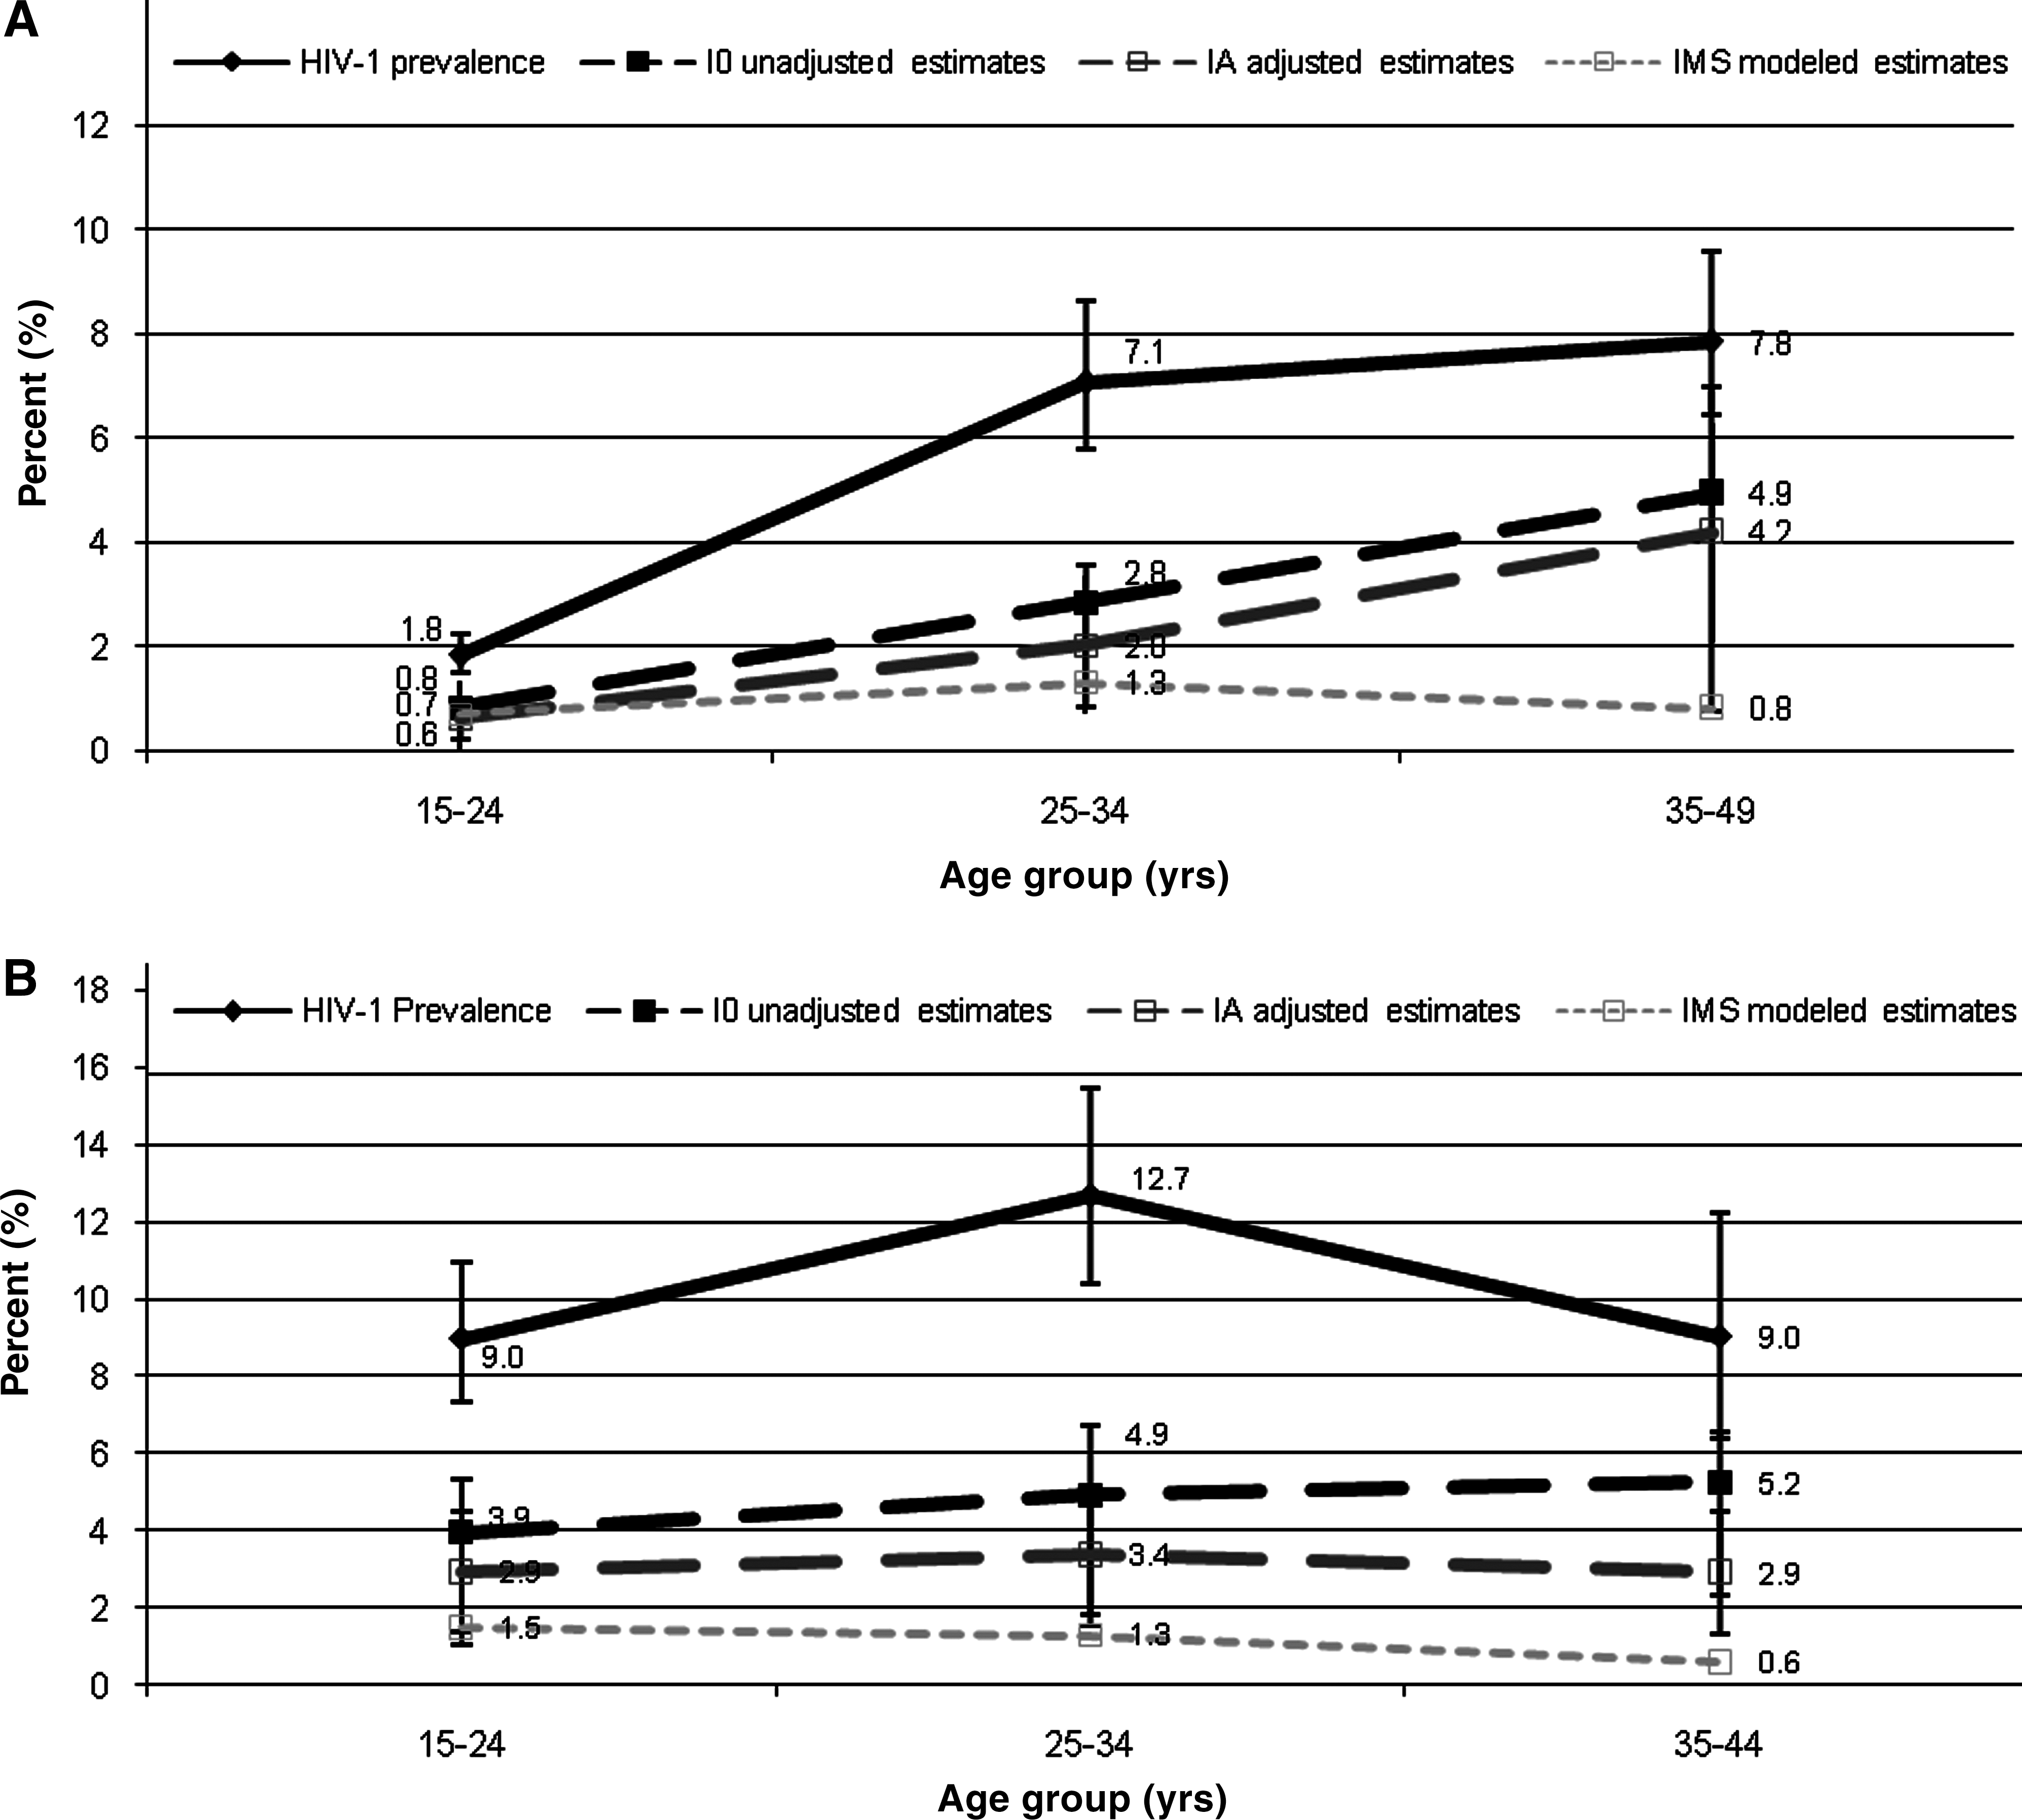
HIV-1 prevalence was highest in women aged 25–34 years (12.7%) and in males aged 35–49 years (7.8%) (Fig. 2). The II estimate was highest among women aged 25–34 years [3.4% (95% CI 1.8–5.0)] and men aged 35–49 years [4.2% (95% CI 2.1–6.3). EPP and Spectrum modeled incidence for Kenya in 2003 (IMS ) was 1.0% (PB 1.02–1.08) for all adults aged 15–49 years, 0.9% (PB 0.86–0.92) for males aged 15–49 years, and 1.2% (PB 1.17–1.24) for females aged 15–49 years. The IMS estimate was 3.5 times lower than the I 0 estimate and approximately 2.5 times lower than the II estimate. For female youth aged 15–24 years, the IMS estimate (1.5%) was nearly two times lower than the II estimate [2.9% (95% CI 1.3–4.5)], but the estimates for IMS and II for male youth were similar.
HIV prevalence, I
0 unadjusted estimates, II
adjusted estimates, and modeled estimates (IMS
) among males (
Côte d'Ivoire ANC Surveillance
From 1998 to 2004, 277 (9.2%) of 3016 pregnant women aged 15–49 years attending 10 urban ANC sites in Côte d'Ivoire tested positive for HIV-1 infection in 1998, followed by 257 (8.3%) of 3097 pregnant women in 2000, 176 (8.9%) of 1985 pregnant women in 2002, and 270 (7.7%) of 3498 pregnant women in 2004. Recent HIV-1 infections were detected by the BED assay in 55, 36, 35, and 53 HIV-positive specimens, respectively.
The unadjusted BED incidence estimate (I 0) was 4.6% (95% CI 3.4–5.8) in 1998, 2.9% (95% CI 2.0–3.9) in 2000, 4.5% (95% CI 3.0–5.9) in 2002, and 3.8% (95% CI 3.3–4.5) in 2004 (Fig. 3). Over the same years the II estimate was 3.6% (95% CI 2.6–4.5), 1.9% (95% CI 1.3–2.5), 3.5% (95% CI 2.3–4.6), and 2.9% (95% CI 2.1–3.7), respectively.

HIV prevalence, I
0
, unadjusted estimates, and II
adjusted estimates among pregnant women attending urban antenatal clinics in Côte d'Ivoire from 1998 to 2004 (
From 1998 to 2004, HIV-1 prevalence was highest among women aged 25–34 years at 11.2%. The I 0 estimate was highest in women aged 15-24 years at 4.2% (95% CI 3.3 – 5.0) and 25–34 years at 4.4% (95% CI 3.3–5.4). The II estimate was highest in youth women 15–24 years at 3.4% (95% CI 2.7–.0) and lowest in the oldest age group (aged 34–49 years) at 1.5% (95% CI 0.6–2.4).
Discussion
BED and modeled estimates of HIV incidence
In South Africa, assay-based estimates of HIV-1 incidence, adjusted for test sensitivity and short- and long-term specificity, fell within a reasonable range of HIV-1 incidence estimated by two mathematical models. However, in Kenya the overall adjusted BED estimate was over two times higher than the mathematical modeled estimates of incidence (Table 1). Moreover, in Côte d'Ivoire, the adjusted incidence estimates over the survey period (2.9–3.6%) were not plausible for the level of prevalence observed during the same time period (7.7–9.2%).
For illustration, II is shown.
95% confidence intervals calculated for II.
Plausibility bounds calculated for EPP and Spectrum estimates.
Plausibility bounds for EPP and Spectrum estimates were not available for 10-year age bands.
For South Africa and Côte d'Ivoire, the adjusted estimates appeared to produce more reasonable age patterns in HIV-1 incidence compared to unadjusted estimates, with peak incidence shifted toward younger age groups (that is, adolescents and adults aged 15–24 years); however, these observations were based on only qualitative assessments. 38 –40 Notably, in Kenya, plausible levels of incidence were not observed even after adjustment. Rather, the adjusted incidence increased with increasing age, with highest incidence (adjusted) observed in the oldest age group (aged 35–49 years).
The difference between the adjusted estimates and the mathematically modeled estimates for Kenya may be explained, in some part, by the limitations of mathematical models in estimating HIV-1 incidence. In particular, though modeled estimates were used as the gold standard estimate for HIV-1 incidence in this analysis, at the time of writing the two models used for this analysis had not yet been validated against other measures of HIV-1 incidence in the same study population. Moreover, estimates in mathematical models of HIV-1 incidence are only as good as the quality of HIV prevalence and demographic data that are inputted into the model. In this regard the adjusted BED estimates and the modeled estimates were similar for South Africa, a country with fairly complete reporting of HIV-1 prevalence and demographic data. In contrast, at least some of the difference observed between the BED and modeled estimates in Kenya may be due to less complete input data for the model. Nonetheless, data have suggested that in relatively stable and mature epidemics, such as in the three countries under analysis, HIV-1 incidence in the general population should not be much higher than 10% of HIV prevalence, 44 indicating that the adjusted BED estimates for Kenya and Côte d'Ivoire likely overestimated the true incidence in these settings.
Other sources of error in the BED estimates
There were several other potential sources of error that may have contributed to the overestimation of the adjusted incidence estimates in Kenya. First, timely and proper storage of specimens prior to BED testing is critical to the performance and accuracy of the BED assay. Antibody optical density values for enzyme immunoassays have been found to progressively decline under harsh conditions. 45 Under this assumption, false recent classifications may be possible on antibody-based incidence assays, such as the BED assay (B. Parekh, personal communication). Indicators of improper storage conditions, such as mold on dried blood spot specimens (observed in a sample of the 2003 Kenya DHS specimens), can negatively impact the stability of the antibody and the accuracy of the test. Second, inappropriate values may have been used to adjust for long-term specificity of the assay, defined as the proportion (ɛ) of treatment-naive patients who continue to classify as recent by the BED assay even after infection for more than a year. 28,30,46
Recent unpublished estimates of ɛ, which relate to East Africa, do suggest that ɛ may in fact be substantially higher in East Africa than the default ɛ used in this analysis. Two separate studies in Uganda, combined for reasonable sample sizes, have estimated that ɛ is approximately 15.0% in treatment-naive patients with known long-term HIV-1 infections. 37,47 Application of the “local” ɛ to the Kenya data would have lowered the overall BED HIV-1 estimate by 4-fold, placing the adjusted estimate within the plausibility bounds of the modeled estimate for Kenya. Karita and colleagues also reported substantially higher levels of ɛ in East Africa 29 ; however, because these measurements were based on very small sample sizes (N = 14 and 23) this local ɛ could not be used reliably to adjust the BED incidence in this analysis. Additionally, recent data from KwaZulu Natal, South Africa reported a lower ɛ of 1.7%, providing evidence that ɛ may vary by region within a country. 48 Application of an ɛ of 1.7% to the South Africa data would have increased the adjusted assay-based incidence estimate among adults aged 15–49 years from 2.4% to 3.7%, a level nearly two times higher than the modeled estimates of incidence.
The need to measure ɛ under a variety of conditions
The results of this analysis strongly suggest that ɛ may vary by site and therefore is applicable only in settings from which the local ɛ was quantified. Given this, local validations of ɛ, optimally using large samples (N ≥ 1000) of known long-term HIV-1 infections, infected for at least 12 months, are required to estimate ɛ in populations under a variety of conditions before an incidence assay can be widely applied in surveillance settings in that population. The validation population should be representative of the populations to which the incidence assay will be applied. If ɛ will be used to calibrate national level HIV-1 incidence, for example, the local ɛ should be derived from a nationally representative sample. At a minimum data on gender, age, geography, approximate duration since first HIV-1 positive test result based on previous HIV testing history, opportunistic and coinfections, CD4+ T cell count, and antiretroviral therapy (ART) regimen must be collected to establish the variation in ɛ with these variables. 49
Effects of low CD4+ T cell counts and treatment regimen on estimates of ɛ
Evidence suggests that ART use and low CD4+ T cell counts may be particularly important contributors to errors in BED estimates. A high proportion of patients (>20%) on ART for greater than 12 months will misclassify as recent infection on the BED assay due to a drop in viral levels and a corresponding decrease in antibody response. This error does not appear to be constant but varies between populations and increases by time on ART. 37,47,50 Similarly, persons with very low CD4 cell counts may experience a drop in antibody response as the host immune response becomes more compromised by disease and will subsequently falsely classify a proportion of these as recent infection on the BED assay. 51
These results have two important consequences. First, because the error from ART and low CD4 cell counts may be considerable, the sample in which the BED is planned to be applied for incidence estimation should measure current ART use and CD4 cell counts to correctly identify and exclude patients on ART and with low CD4 cell counts from the incidence analysis. Second, due to the inconsistency of error from ART and low CD4 cell count <50 cells/mm3 and to ensure comparability with the population in which the incidence assay will be applied, when estimating ɛ it is recommended that persons on ART and with CD4+ T cell counts <50 cells/mm3 are excluded from the validation sample. Failure to comply with these requirements will undoubtedly result in overestimation of HIV-1 incidence.
Increased complexity: suggested solutions
It is recognized that these requirements introduce a substantial level of complexity to the wide successful use of the BED assay in the field, particularly when integrated into national HIV surveillance systems. Currently unlinked anonymous testing (UAT) in ANC surveillance sites can utilize only routinely collected clinic data for the purposes of HIV surveillance, most of which do not include ART status or CD4 T cell count measurements on HIV-1-positive patients. Similarly, among all national population-based surveys with HIV testing that have been completed to date, only very few have collected data on ART use or measured CD4 T cell counts. Additionally, HIV testing in national population-based surveys is typically conducted on dried blood spots, thereby precluding any possibility for CD4 T cell count testing. As international efforts move toward the use of program data for estimating ANC HIV-1 prevalence, the World Health Organization (WHO) now recommends that all ANC sites with prevention of mother-to-child transmission (PMTCT) programs begin to record routinely collected PMTCT variables on the ANC surveillance form (such as current ART use) to monitor the PMTCT program and evaluate its future utility in estimating HIV prevalence in the ANC population. 52 Furthermore, population-based surveys that collect venous blood specimens have the ability to obtain information on ART status, self-reported HIV status, in combination with previous HIV testing history to identify known long-term HIV infection, and test for CD4+ T cell counts among HIV positives, provided there are appropriate financial, logistical, and laboratory support for doing so. 53
If ART data cannot be obtained in the survey setting ART use can alternatively be measured by directly testing HIV-1-positive samples for the presence of ART. This option is a feasible option if well-trained regional laboratories can be used and resources are available. Additionally, costs are assumed to be minimal (approximately $20 U.S. dollars per sample tested) if testing is conducted only on those specimens testing as a recent infection on the incidence assay.
Limitations of the study
This evaluation was subject to the following limitations. Due to the rarity of recent infection, large sample sizes were needed to detect statistically significant differences between unadjusted, adjusted, and modeled estimates of HIV-1 incidence. Whereas the South Africa 2005 National Household Survey was powered for incidence analysis, the surveys in Côte d'Ivoire and Kenya were post hoc evaluations using stored specimens from completed surveillance studies powered for national-level prevalence analysis. Additionally, appropriate statistical methods for detecting differences between independent HIV-1 incidence measures are currently under development; therefore differences between BED and modeled-based incidence could only be qualitatively assessed. Prior to considering incidence assay testing, countries should work with statisticians to consider sample sizes requirements needed for incidence analysis. If the minimum required sample sizes cannot be reached in the survey setting, incidence testing activities should be reconsidered. Standard errors were not available for the ASSA model and age-specific incidence in the EPP and Spectrum model. Therefore, a reasonable degree of uncertainty exists for these estimates. We were unable to exclude persons on ART from the three surveys in this analysis as ART use was not directly measured. It is possible, therefore, that persons on ART or with very low CD4+ T cell counts were included in the analysis, thereby contributing to overestimation of BED HIV-1 incidence, even after adjustment. The size of this error is assumed to be low given that these surveys were implemented during the early stages of ART expansion in these countries. According to reports from country Ministry of Health programs and the WHO, approximately 0.4% of HIV-infected persons in Côte d'Ivoire and 1% of HIV-infected persons in Kenya and South Africa may have been on ART during the survey periods. 54 –56 If we assume the same distribution of ART uptake in our three samples and further assume that an estimated 20% of HIV-infected persons on ART will misclassify as recent on the assay, 37 this could have resulted in one misclassified case in Kenya and Cote d'Ivoire's data and up to three misclassified cases in South Africa's data due to ART use. Though the effect of ART is presumed to be low in these samples, given the very absence of availability of treatment, however, the proportion of persons with very low CD4 counts may have been correspondingly higher.
The way forward
Although it is anticipated that all antibody-based serologic assays that distinguish recent from long-term HIV-1 infection will continue to have some degree of misclassification, improved incidence assays that may overcome some of these limitations are currently under development. 20,57 –63 This includes examination of a serial testing algorithm, using a highly sensitive assay as the screening assay and a more specific assay based on a different biological principle as a confirmatory assay. 14,47 As new assays are developed and existing assays improved, appropriate caution should be applied in countries that currently use or plan to use the BED assay for HIV-1 incidence estimation. First, for countries to appropriately use these assays for national HIV-1 incidence estimates, ART use and CD4 cell counts in HIV-1-positive persons should be measured in national surveillance settings. Second, prior to estimating national-level HIV-1 incidence in a population, countries should plan to implement local incidence assay validation activities in country to measure ɛ in the populations in which the assay will be applied for estimating HIV-1 incidence. Third, HIV incidence surveillance settings should meet all requirements for proper specimen storage and appropriate sample sizes for incidence analysis. If the requirements listed above are not met, it is advised that the incidence assay not be applied. Finally, assay-based HIV-1 incidence should be compared to other measures of HIV-1 incidence in the same population to evaluate the assay's ability to accurately measure HIV-1 incidence. Similarly, mathematical models of HIV-1 incidence should be validated against independent measures of HIV-1 incidence, including directly observed HIV-1 incidence in longitudinal cohorts. To date, one such model has been validated in this manner and has been used to produce national estimates of HIV incidence in countries with at least one nationally representative HIV survey. 64,65 A validated incidence model such as this can be interpreted in combination with assay-based incidence data to help assess the plausibility of the assay-derived estimates.
Footnotes
Acknowledgments
We are grateful to John Stover and Robert Dorrington for their inputs on the mathematical models used for this analysis and to Meade Morgan for critical comments on data analysis for this manuscript. This research was sponsored in part by the U.S. President's Emergency Plan for AIDS Relief, Office of the Global AIDS Coordinator, the Nelson Mandela Foundation, the Swiss Agency for Development and Cooperation, and the Human Sciences Research Council. The findings and conclusions in this report are those of the authors and do not necessarily represent the views of the U.S. Centers for Disease Control and Prevention.
Author Disclosure Statement
No competing financial interests exist.