
Abstract
The amount of HIV-1 DNA within peripheral blood mononuclear cells is an important marker of viral activity. We studied intracellular HIV-1 DNA content in purified CD4+ T cells from 28 chronically HIV-1–infected adults with sustained CD4+ T cell counts (>500 cells/μl) and undetectable plasma viral load (<50 copies/ml), who underwent CD4-guided treatment interruption (TI). Patients were followed up for 18 months during TI, and for 6 months after treatment resumption (TR). Six naïve HIV+ patients starting therapy were also enrolled and followed up for 6 months. All patients were studied every 2 months; HIV-1 DNA copy number was quantified with real-time PCR. Considering all patients remaining off-treatment, in the first 18 months of TI, intracellular HIV-1 DNA levels (expressed as Log10 copies/million cells) remained stable (mean, 3.82 and 3.77 at time 0 and after 18 months, respectively). Similarly, HIV-1 DNA values, either in patients who restarted treatment after TI (time 0, 4.90) or in naïve patients who started treatment for the first time (time 0, 4.37), did not change significantly in the first 6 months of therapy (4.42 and 3.67, respectively). Evaluating HIV-1 DNA variations during the first 2 months of TI, we found that patients with a stable level had a lower risk to reach a CD4+ T cell count <350 cells/μl, and thus to restart therapy, whereas this risk was significantly higher in those with a marked increase of HIV-1 DNA. In conclusion, intracellular HIV-1 DNA is a predictive marker for the length of CD4-guided TI.
Introduction
HIV+
It is well known that the virus can persist in a latent form in the so-called cellular reservoirs, which include memory CD4+ T cells. 6 –11 These viral forms cannot be detected by analyzing plasma HIV levels, but can be identified by studying intracellular HIV-1 DNA content. In recent years, several reports focused on the quantification of HIV-1 DNA as a marker of viral activity. Even though HIV-1 RNA plasma viral load remains the main clinical parameter to monitor viral replication, a growing number of observations are showing that the measurement of intracellular HIV-1 DNA can provide crucial information on the reservoir and dynamics of HIV infection. 12,13 This is even more important in patients with undetectable plasma viral load resulting from successful HAART, in whom intracellular HIV-1 DNA could represent the only biomarker of viral activity that can be easily detected in a simple manner.
Accordingly, we have studied the dynamics of HIV-1 DNA content in peripheral blood CD4+ T cells from patients undergoing CD4-guided STI, and followed up these patients after the restart of treatment. Moreover, we studied some naïve HIV+ patients (i.e., those HIV+ individuals who never took antiretroviral therapy) to compare the dynamics of the eventual changes in CD4+ T lymphocyte intracellular HIV-1 DNA with that of STI patients who restart therapy after a period of interruption.
Methods
Subjects
We quantified the amount of intracellular HIV-1 DNA in 28 HIV+ patients who voluntarily interrupted HAART. Patients were followed up by the Infectious and Tropical Diseases Clinics of University of Modena and Reggio Emilia, and were alerted of a possible higher risk of HIV transmission to sexual partners during the period of treatment discontinuation. Informed consent was obtained from the patients before blood collection, according to the Italian laws.
Patients were enrolled in this study if they satisfied the following inclusion criteria: they had to be 18 years or older, to have received HAART for ≥12 months, to have had a CD4+ T cell count nadir >250 cells/μl, and a CD4+ T cell count before interruption of >500 cells/μl. HIV plasma viral load at the time of discontinuation had to be <50 copies/ml. The viroimmunologic data of patients were strictly monitored every 2 months. Patients who stopped therapy discontinued nonnucleoside reverse transcriptase inhibitors 3 days before discontinuing nucleoside transcriptase inhibitors. The criteria for restarting treatment were as follows: a CD4+ T cell count <350 cells/μl on two consecutive occasions, a clinical manifestation of HIV infection, or the desire of the patient to resume HAART.
Moreover, we studied six patients naïve for HAART who had started therapy, and were followed up every 2 months as well. In these cases, the criteria for starting treatment were as follows: a CD4+ T cell count <250 cells/μl or a clinical manifestation of HIV infection. In Table 1 the characteristics of patients and their main viroimmunologic parameters are shown.
SD, standard deviation.
Peripheral blood lymphocyte isolation and DNA extraction
Peripheral blood mononuclear cells (PBMCs) were isolated from freshly collected blood, according to standard procedures, and CD4+ T cells were isolated from PBMCs by magnetic sorting (Miltenyi, Bergisch Gladbach, Germany). Purity of the cell population was assessed with flow cytometry and was always >95% (not shown). DNA was extracted from CD4+ T cells by using QIAmp DNA Blood Minikit from QIAgen (Alameda, CA), by following instructions supplied by the manufacturer.
HIV-1 DNA quantification
HIV-1 DNA load in CD4+ T cells was measured by using a method based on real-time PCR, as previously described. 14 This test, kindly provided by GeneMoRe Italy srl (Modena, Italy), uses two parallel reactions that quantify HIV-1 DNA and nuclear DNA for each sample, to normalize the number of viral DNA copies to the number of starting cells. The values are then expressed as HIV-1 DNA copy number per million cells.
Statistical analysis
The different characteristics of the two studied populations, STI and naïve patients, were compared by the χ2 test by using Prism 4.0 software. The analyses of viroimmunologic parameters and HIV-1 DNA variations during the follow-up were performed first with analysis of variance (ANOVA) for repeated measures, and then the comparison between different time-points was analyzed with Tukey-Kramer pair-wise comparison. To evaluate the possible relation between HIV-1 DNA and length of TI, we performed a Kaplan–Meier survival analysis. All the analyses were performed by using STATA 10. Correlations between HIV-1 DNA amount and viroimmunologic parameters were performed with Spearman's correlation test by using Prism 4.0 software.
Results
Viroimmunologic parameters
We evaluated the CD4+ T cell count and plasma HIV-1 RNA of STI patients from the moment of interruption (month 0), in which the effects of therapy on viral replication were present, to the first 18 months of TI. In this period, 14 patients of 28 had resumed therapy.
As expected, the CD4+ T cell count and HIV-1 plasma viral load significantly changed during the follow-up. During TI, the CD4+ T cell count decreased rapidly in the first 2 months, and then kept on falling at a slower rate from the second to the sixth month of TI, and finally remained stable until the 18th month (Fig. 1, upper panel). Conversely, HIV-1 plasma viral load increased in the first 2 months of TI, and then remained stable (Fig. 1, middle panel). We also evaluated the viroimmunologic parameters during the first 6 months of treatment resumption and, considering the last value before TR, we found, as expected, that CD4+ T cells increase significantly in the first 2 months of therapy (Fig. 2, upper panel), whereas HIV-1 RNA decreases (Fig. 2, middle panel).
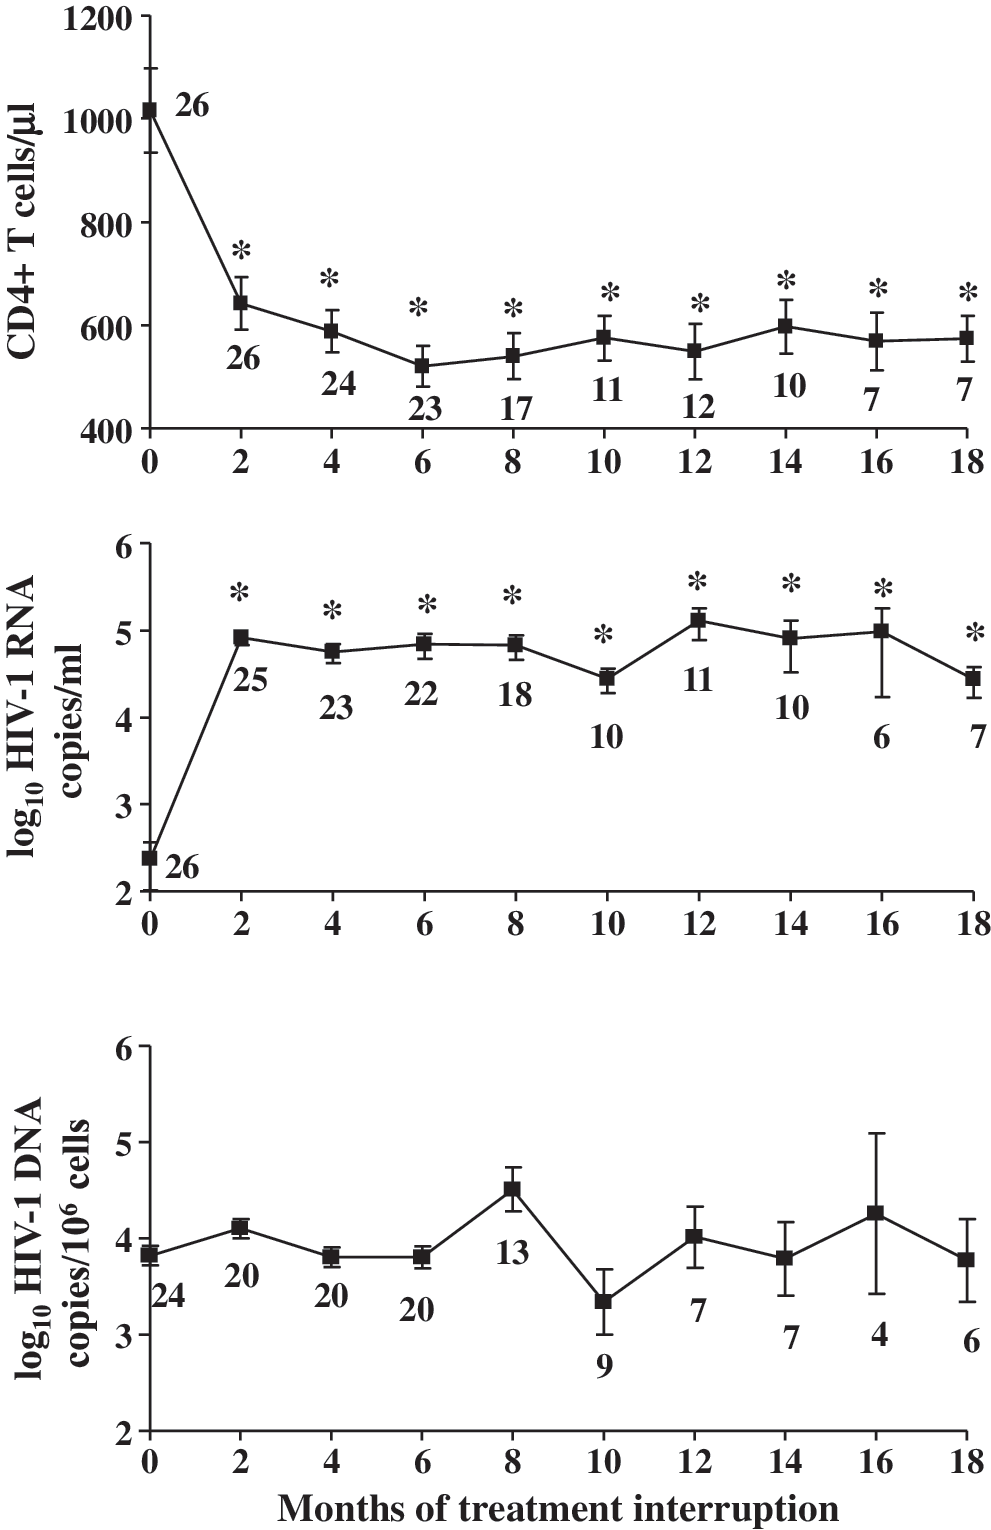
Changes in CD4+ T cell count, plasma viral load, and intracellular HIV-1 DNA content in STI patients during the first 18 months of treatment interruption. This shows CD4+ T cell count (upper panel), plasma HIV-1 RNA copies/ml (middle panel), and HIV-1 DNA expressed as copies per million CD4+ T cells (lower panel) in STI patients during the first 18 months of treatment interruption. Data are shown as mean and 95% confidence intervals. Time 0 indicates the moment in which patients stopped to assume antiretrovirals, whereas the other time points indicate the months after therapy interruption. The number of patients is indicated below each time-point. *p < 0.05 in comparison with month 0.

Viroimmunologic parameters of STI patients during the first 6 months of treatment resumption. This shows the CD4+ T cell count (upper panel), plasma HIV-1 RNA copies/ml (middle panel), and HIV-1 DNA expressed as copies per million CD4+ T cells (lower panel) in STI patients during the first 6 months of treatment resumption. Data are shown as mean and 95% confidence intervals. The month 0 represents the last time point in which patients did not take antiretrovirals, whereas the other time points indicate the months after therapy restart. The number of patients is indicated below each time point; *p < 0.05 in comparison with month 0.
Six patients naïve for therapy were followed for 6 months (i.e., starting from the first day they assumed therapy). As in the STI patients who resumed therapy, the treatment caused an increase of CD4+ T cells in the first 4 months (Fig. 3, upper panel), whereas the HIV-1 RNA decreased to undetectable levels since the first 2 months (Fig. 3, middle panel).

CD4+ T cell count, plasma viral load, and intracellular HIV-1 DNA content in naïve patients during the first 6 months of therapy. This shows the CD4+ T cell count (upper panel), plasma HIV-1 RNA copies/ml (middle panel), and HIV-1 DNA expressed as copies per million CD4+ T cells (lower panel) in antiretroviral naïve patients during the first 6 months of therapy. Data are shown as mean and 95% confidence intervals. The number of patients is indicated below each time point. *p < 0.05 in comparison with month 0.
Quantification of intracellular HIV-1 DNA
We quantified intracellular HIV-1 DNA in purified CD4+ T lymphocytes from STI patients during therapy interruption (18 months of follow-up; Fig. 1, lower panel), during therapy restart (6 months of follow-up; Fig. 2, lower panel), and in naïve patients (6 months of follow-up; Fig. 3, lower panel). We found that, considering all of the individuals, in each group of patients, the HIV-1 DNA levels did not vary significantly during the 18-month follow-up. In STI patients, HIV-1 DNA values (expressed as log10 copies HIV-1 DNA per million CD4+ T cells) were 3.82 (95% confidence interval, 3.32–4.31) at time 0, and 3.77 (2.71–4.82) after 18 months of treatment interruption; in STI patients who restarted treatment, values were 4.90 (4.32–5.48) at time 0, and 4.42 (3.56–5.29) after 6 months of therapy; in naïve patients, values were 4.37 (3.47–5.26) at time 0, and 3.67 (2.42–4.92) after 6 months of therapy.
We then considered intracellular HIV-1 DNA levels at the moment of therapy restart (i.e., at month 0 of TR in STI patients). This moment considers patients whose length of TI was quite heterogeneous (see Table 1). At this time point, the HIV-1 DNA level was significantly higher than at the moment of treatment interruption (p = 0.0001). The trend of HIV-1 DNA in STIs who restart therapy was similar to that observed in naïve patients starting therapy for the first time, except for a slight difference at the second month, when the HIV-1 DNA is higher in STI patients who restart therapy if compared with naïve patients (p = 0.024).
We then evaluated the probability of restarting therapy according to HIV-1 DNA variations from TI start to the second month of interruption, and could analyze samples from 17 patients. We stratified patients in three groups on the basis of HIV-1 DNA variations: (a) stable or decreased levels (HIV-1 DNA copies/106 cells ≤0); (b) moderate increment (between 1 and 22,682.72 copies/106 cells); and (c) marked increment (≥22,682.72 copies/106 cells). The value of 22,682.72 was chosen because it represents the median value of the increase in HIV-1 DNA in those patients with increased HIV-1 DNA levels, and does not consider patients of the stable group. As shown in the Kaplan–Meier curve of STI patients who underwent TI (Fig. 4), a log-rank test for equality of survivor functions revealed a significant difference in the survival curve of the three groups (p = 0.0002). In particular, patients with a stable HIV-1 DNA in the first 2 months of TI had a lower probability of resuming therapy compared with those who had a marked increment (p = 0.002), with a mean time of TI length of 28.93 months. This difference was also present when patients with a moderate or marked increment were compared (p = 0.021); the first group had a mean time of TI of 19.78 months, whereas the second was of 7.23 months.
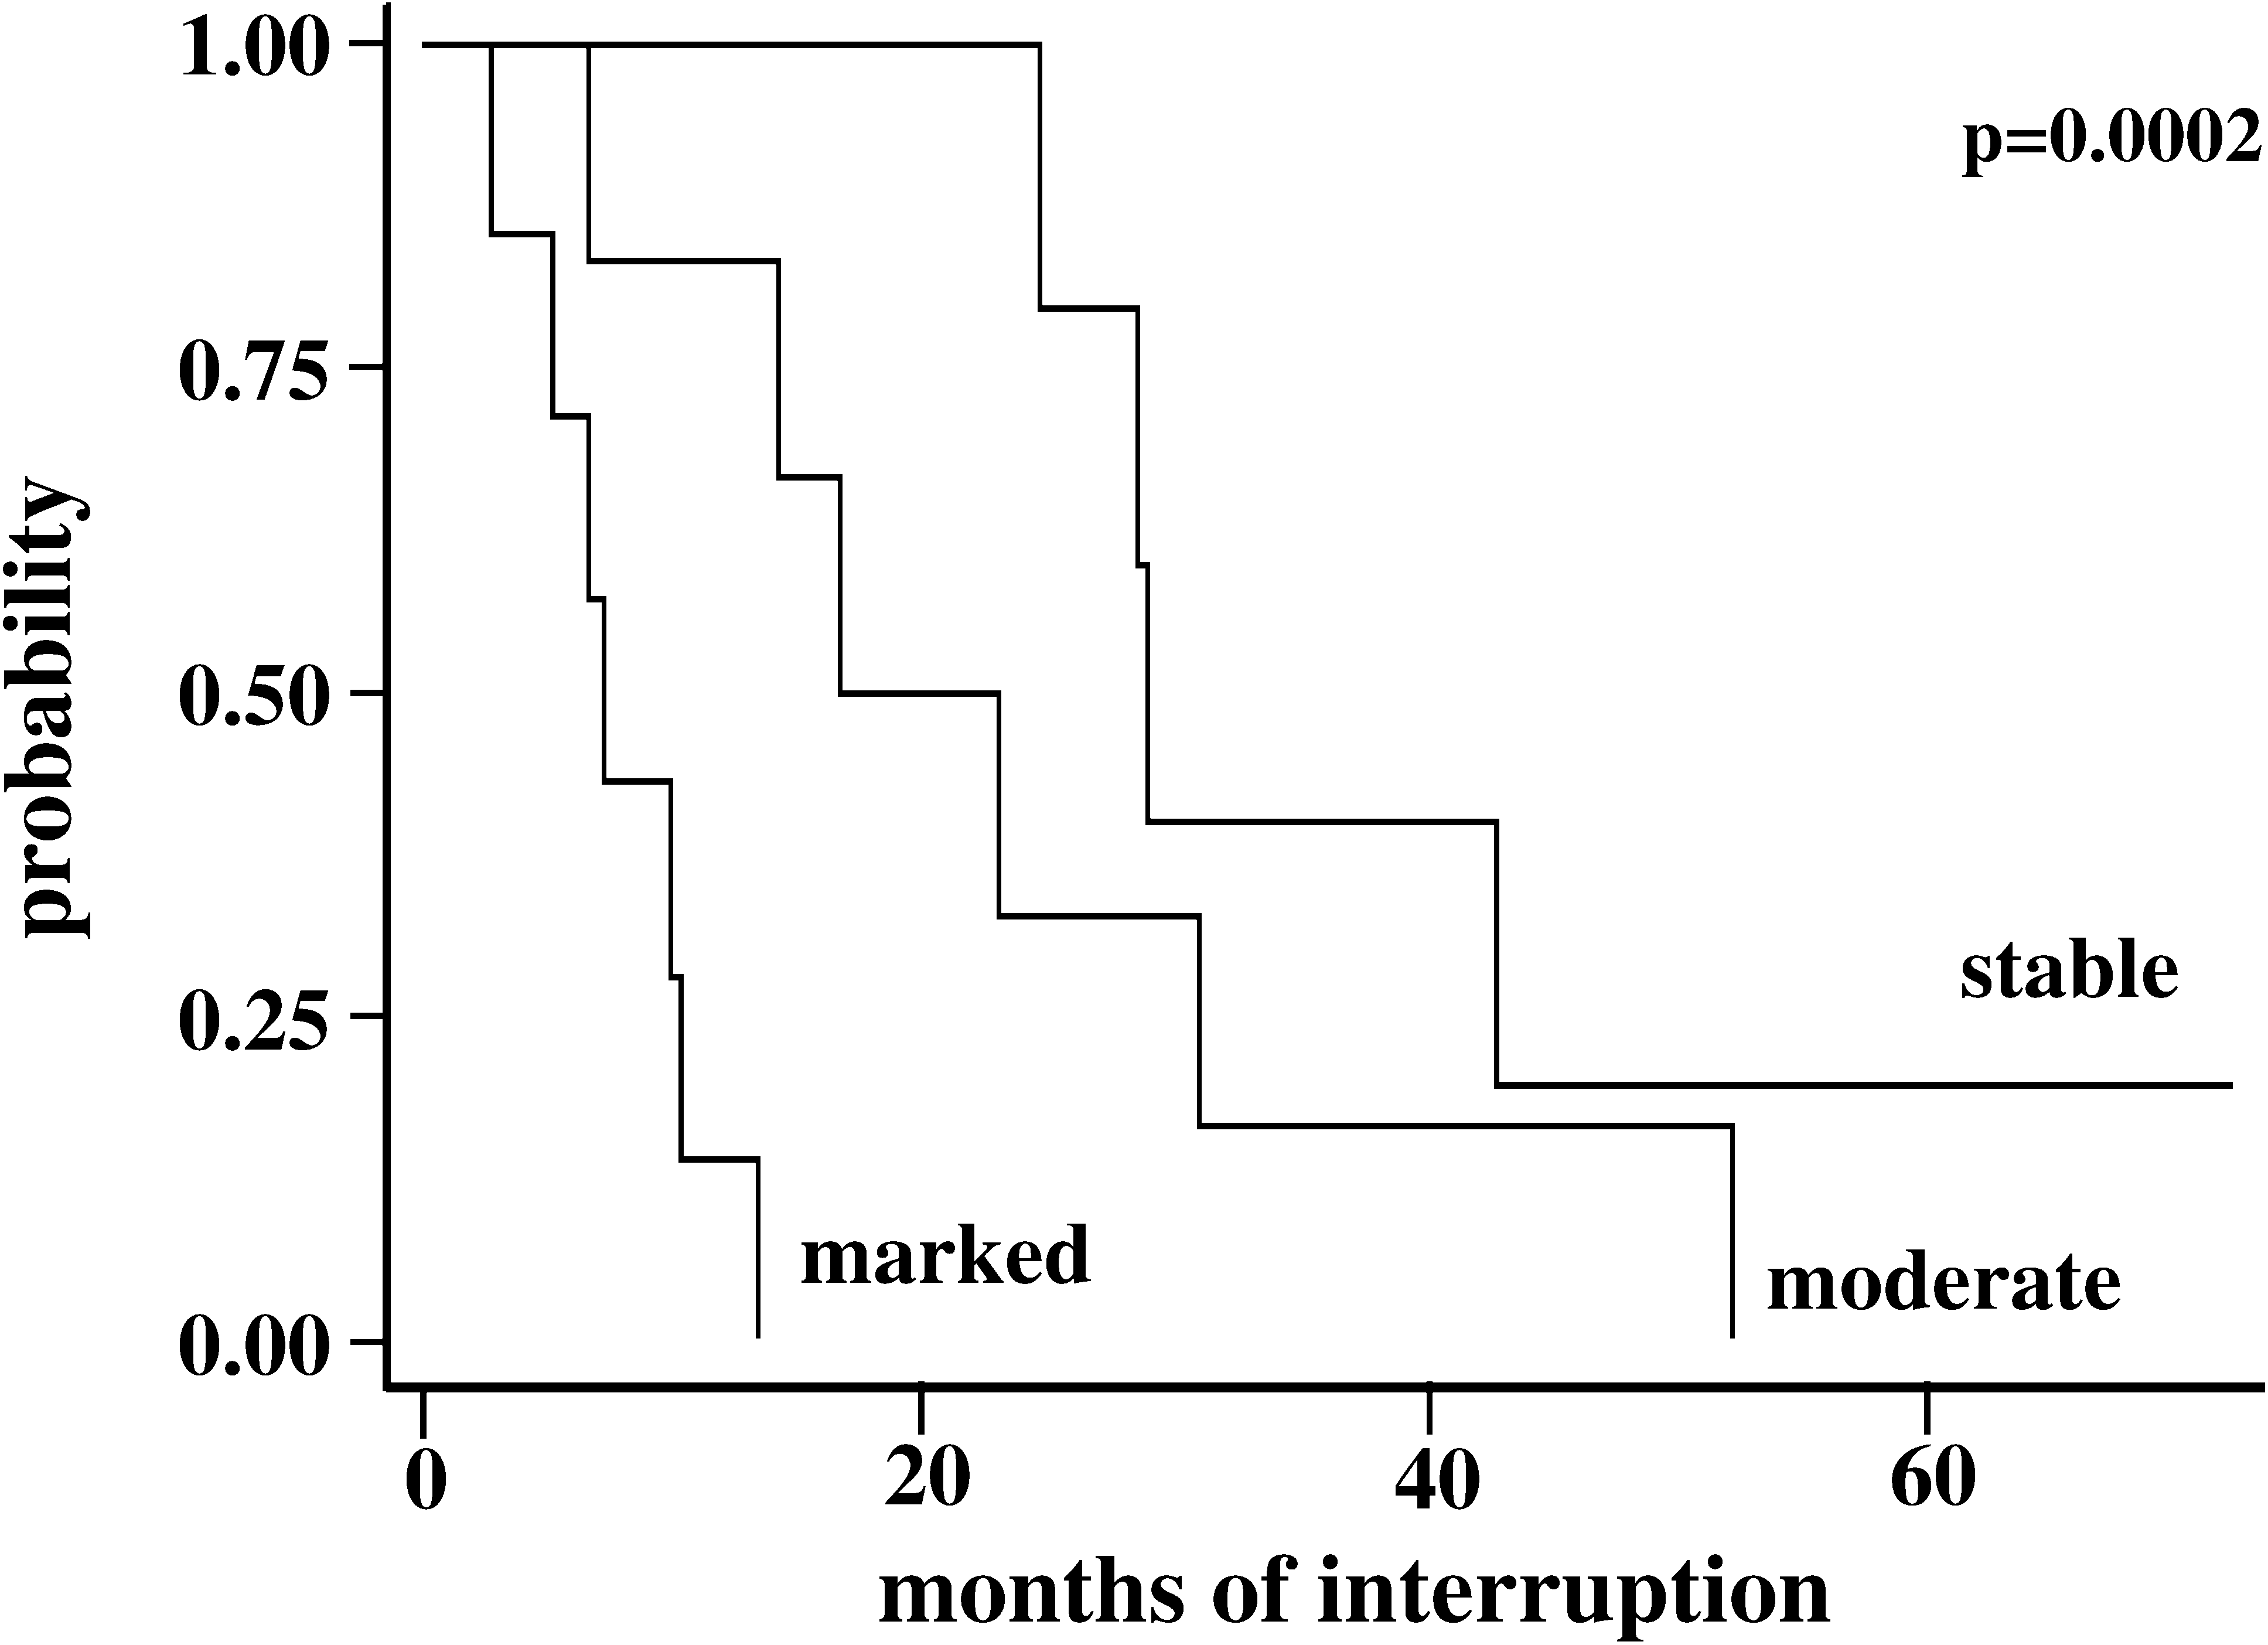
Estimation of probability of therapy restart on the basis of intracellular HIV-1 DNA content. The survival curves estimate the probability of restarting therapy of patients who had a stable level of intracellular HIV-1 DNA, or who displayed a moderate or marked increment of HIV-1 DNA in the first 2 months of TI.
Correlations between HIV-1 DNA level and viroimmunologic parameters
We analyzed the correlations between HIV-1 DNA and viroimmunologic parameters in our patients by using the Spearman test. We found that, in patients who were off treatment, taking into account all the time points, a direct correlation existed between HIV-1 DNA levels and plasma levels of HIV-1 RNA (r = 0.227; p = 0.013) (Fig. 5A). In the same group of patients, we found an inverse correlation between HIV-1 DNA level and CD4+ T cell count (r = −0.365; p < 0.0001) (Fig. 5B). Finally, in STI patients that resumed therapy, we observed that an inverse correlation exists between CD4+ T cell count and HIV-1 DNA levels (r = −0.319; p = 0.027) (Fig. 5C).

Spearman's correlations between HIV-1 DNA intracellular content and viroimmunologic parameters. Correlation between intracellular HIV-1 DNA and plasma level of HIV-1 RNA (upper panel) or CD4+ T cell count (middle panel) in STI patients during treatment interruption. Lower panel indicates the correlation between intracellular HIV-1 DNA and CD4+ T cell count in STI patients during therapy resumption. Analyses were performed with Spearman's correlation test.
Discussion
By using a novel and original approach, we quantified HIV-1 DNA content in highly purified CD4+ T lymphocytes from patients undergoing CD4-guided TI, a clinical situation that mimics viroimmunologic modifications occurring during primary acute infection. 3,15,16 To our knowledge, this is the first study that longitudinally measures this parameter in STI patients either during treatment interruption or after therapy resumption.
Considering all of our patients, we found that when the treatment is stopped, intracellular HIV-1 DNA levels tend to remain stable, even in the presence of a rebound of viral production (detected by the analysis of plasma viral load), which occurs in a relevant manner in the first months of TI, and which was stably present also in the following months. Interestingly, we observed that STI patients can be divided into different groups, depending on the changes in HIV-1 DNA that occur during the 2-month period of viral rebound. Those patients who did not increase intracellular HIV-1 DNA were able to remain off therapy for a much longer period; those with a significant increase had to restart therapy much earlier. Several studies have demonstrated that infected cells in peripheral blood are important reservoirs of the virus, and do not disappear even during successful treatment. 9,17 –19 Here we show that also during treatment restart, as well as in newly treated naïve patients, HIV-1 DNA remains well detectable and stable in peripheral CD4+ T cells.
It has been shown that the level of HIV-1 DNA in PBMCs from untreated patients provides an estimate of the cellular HIV reservoir, which is established soon after infection 20,21 and is predictive of the risk of progression, independently of CD4+ T cell count and HIV-1 RNA level. 21 –23 Furthermore, HIV-1 DNA in cells from naïve-treated patients is inversely correlated with CD4+ T cell count. 24
Our study not only confirms these observations, but also indicates that the quantification of HIV-1 DNA in purified CD4+ T cells can be considered a prognostic marker for patients who intend to interrupt treatment. We found that the amount of intracellular HIV-1 DNA is inversely correlated to the length of treatment interruption, and thus to the number of peripheral CD4+ T cells. Furthermore, we found that restarting therapy did not provoke significant changes in intracellular HIV-1 DNA content, either in STI or in naïve patients.
Finally, because the majority of the aforementioned studies have evaluated HIV-1 DNA on unsorted PBMCs and not on CD4+ T cells, our data indicate that, when performed on peripheral blood CD4+ T lymphocytes, this measure could assume even a more relevant meaning.
In conclusion, the rapid increase of virus production that we observed when therapy was stopped, even after years of successful treatment, as well as the persistence of HIV-1 DNA in these patients, reinforces the idea that precocious treatment during acute infection could be useful to preserve the immune system and to minimize the reservoirs that are difficult to eradicate and able to induce virus production rapidly in the absence of drugs. 25 –27
Footnotes
Acknowledgments
This study was partially supported by Progetto Nazionale AIDS 2007, Istituto Superiore di Sanità, Rome, Italy (grant 30G.49 to AC). We gratefully acknowledge GeneMoRe Italy (Modena, Italy) for continuous technical support.
Author Disclosure Statement
A.C. has founded and holds equity on GeneMoRe.