
Abstract
CD4 expression in HIV replication is paradoxical: HIV entry requires high cell-surface CD4 densities, but replication requires CD4 down-modulation. However, is CD4 density in HIV+ patients affected over time? Do changes in CD4 density correlate with disease progression? Here, we examined the role of CD4 density for HIV disease progression by longitudinally quantifying CD4 densities on CD4+ T cells and monocytes of ART-naive HIV+ patients with different disease progression rates. This was a retrospective study. We defined three groups of HIV+ patients by their rate of CD4+ T cell loss, calculated by the time between infection and reaching a CD4 level of 200 cells/μl: fast (<7.5 years), intermediate (7.5–12 years), and slow progressors (>12 years). Mathematical modeling permitted us to determine the maximum CD4+ T cell count after HIV seroconversion (defined as “postseroconversion CD4 count”) and longitudinal profiles of CD4 count and density. CD4 densities were quantified on CD4+ T cells and monocytes from these patients and from healthy individuals by flow cytometry. Fast progressors had significantly lower postseroconversion CD4 counts than other progressors. CD4 density on T cells was lower in HIV+ patients than in healthy individuals and decreased more rapidly in fast than in slow progressors. Antiretroviral therapy (ART) did not normalize CD4 density. Thus, postseroconversion CD4 counts define individual HIV disease progression rates that may help to identify patients who might benefit most from early ART. Early discrimination of slow and fast progressors suggests that critical events during primary infection define long-term outcome. A more rapid CD4 density decrease in fast progressors might contribute to progressive functional impairments of the immune response in advanced HIV infection. The lack of an effect of ART on CD4 density implies a persistent dysfunctional immune response by uncontrolled HIV infection.
Introduction
A
On the other hand, in vitro and in vivo studies with SCID-hu Thy/liv mice demonstrated the importance of CD4 down-modulation for HIV replication efficiency. 11 –14 Furthermore, Nef alleles from HIV strains isolated from patients with progression to AIDS efficiently down-regulate CD4, whereas Nef alleles from HIV strains isolated from long-term nonprogressors are ineffective in down-modulating CD4. 15 –18 The well-known CD4 down-regulation by HIV in vitro is mediated by the viral proteins Nef, Env, and Vpu. 19 Several explanations have been proposed for why CD4 down-modulation favors HIV, including attenuation of CD4 signaling that might decrease viral transcription, prevention of superinfection, and enhancement of virion release. 19
Thus, the role of CD4 expression in HIV infection appears paradoxical. Efficient entry of HIV into cells requires high cell-surface densities of CD4, but CD4 down-modulation by HIV gene products may be necessary for an effective HIV infection.
Few studies have examined CD4 expression in HIV-infected individuals, and those have yielded conflicting results. CD4 expression on peripheral blood T cells was significantly lower in HIV-infected individuals than in HIV-negative individuals. 20,21 Patients with late-stage HIV disease (as defined by <200 CD4+ T cells/μl) have significantly lower T cell CD4 expression levels than patients in the early stages. 20 In contrast, lymphocyte CD4 cell-surface densities have been reported as constant throughout the disease. 22
Thus, the role of CD4 expression levels for HIV pathogenesis remains unclear. Furthermore, previous cross-sectional studies did not examine several key issues. Is CD4 density on HIV target cells affected in HIV+ patients over time? If the CD4 density changes, does it correlate with disease progression? Does suppression of HIV RNA copy number by antiretroviral therapy (ART) affect CD4 density? To address these questions, we defined three groups of HIV disease progressors (i.e., fast, intermediate, and slow progressors), according to the rapidness of their CD4 count decline (i.e., the projected time from infection until the CD4 count reaches the level of 200 cells/μl, calculated by a Bayesian mathematical model 23 ). CD4 densities were quantified on CD4+ T cells and monocytes from these patients by flow cytometry. We calculated the maximum CD4+ T cell count level after seroconversion as described, 23 which was defined as “postseroconversion CD4 count.” This method was also used to determine the longitudinal profiles of CD4 counts and densities. Finally, CD4 densities on HIV target cells were analyzed before and after the start of ART to determine the role of ART on CD4 density.
Materials and Methods
Patients and cells
CD4+ T cell counts and viral load data were provided by the data center of the Swiss HIV Cohort Study (SHCS). To be included in the study, HIV+ patients from the SHCS had to meet the following criteria. (1) Patients had to be starting their first-line ART, during which (2) viremia had to be suppressed to undetectable levels within 6–9 months and remain undetectable for at least 6 months and (3) CD4 T cell counts had to recover to ≥300 cells/μl within 6–9 months after the introduction of ART. (4) At least three cryopreserved peripheral blood mononuclear cell (PBMC) samples with ≥6 × 10⁶ cells each had to be available from before the introduction of ART, and one sample had to have undetectable HIV levels under ART.
A Bayesian mathematical model was used to estimate the unknown date of infection for each individual based on the CD4 count measurements and the seroconversion window defined by the last negative and first positive documented HIV tests. 23 Using 405 patients with ≥3 blood samples stored before the initiation of ART and for whom a date of infection could be estimated, three groups of patients were defined, according to the estimated time from seroconversion to the date when CD4+ T cell counts decreased to 200 cells/μl. These were rated as fast, intermediate, and slow progressors for patients with less than 7.5 years, 7.5–12 years, and >12 years, respectively. The cut points represent tertiles (i.e., n = 135, 134, and 136, respectively). Mathematical modeling permitted us to approximate the maximum CD4+ T cell count level after seroconversion, defined as “postseroconversion CD4 count,” the longitudinal profiles of CD4+ T cell count, and viral load.
To analyze the time profiles of the CD4 T cell and HIV RNA markers, particularly near the time point of infection, 516 incident cases were selected from the SHCS. For these patients, the date of infection is known with good precision as they were seen by a clinician during primary infection or had a negative and positive test for HIV infection within a conveniently narrow time interval (here <1 year). In those cases, the date of infection was estimated as the mid-point. 23 These patients are well known to be different from prevalent cases. They are, however, very useful for assessing the trajectories of the markers from our three groups of progressors (which were defined on prevalent cases), as they provide many measurements during the first few year after the infection occurred (whereas prevalent cases usually provide measurements only at a later stage of disease).
Of the 405 patients having ≥3 blood samples stored before the initiation of ART and for whom a date of infection could be estimated, 21, 20, and 17 fast, intermediate, and slow progressors, respectively, were selected based on the above-mentioned criteria for fluorescence-activated cell sorting (FACS) analyses. Of these, 13, 15, and 12 fast, intermediate, and slow progressors, respectively, passed the criteria for cell viability by FACS analysis (see below). As controls, PBMCs from 10 healthy HIV-negative individuals were isolated at two different time points (5 to 12 months apart) and cryopreserved for ≥14 days (range: 14 days to 11 months).
Immunostaining and flow cytometry
Cryopreserved PBMCs were rapidly thawed and recovered in RPMI medium containing 10% fetal calf serum (FCS). CD4 cell-surface expression levels on CD4+ T cells and monocytes were quantified indirectly with the QIFIKIT (DakoCytomation), which allows the antigen quantity to be expressed in specific antibody-binding capacity (SABC) units. Cells were first incubated with unconjugated primary monoclonal antibody against CD4 (clone RPA-T4) at a saturating concentration or the corresponding isotype antibody in phosphate-buffered saline (PBS), 0.1% bovine serum albumin (BSA), and 0.1% sodium azide (PBS-BSA-azide) at 4°C for 30 min (all antibodies used in this study were from BD Biosciences Pharmingen). Cells, set-up beads, and calibration beads were washed with PBS-BSA-azide and incubated with FITC conjugate, according to the manufacturer's instructions at 4°C for 30 min. Cells and beads were washed with PBS-BSA-azide. Beads were resuspended in PBS-BSA-azide and kept at 4°C until flow cytometric analysis. Cells were then incubated with mIgG (Sigma; end concentration, 5 μg/ml) at 4°C for 10 min, centrifuged, and incubated with anti-CD3 PE and -CD14 APC antibodies at 4°C for 20 min. The rationale for preincubating the cells with mIgG was a strong unspecific binding of the anti-CD14 APC monoclonal antibody to CD4-FITC conjugate-stained cells, which could be prevented by preincubation with mIgG (data not shown). Cells were washed with PBS-BSA-azide, resuspended in PBS-BSA-azide, and immediately acquired on a FACSCalibur (BD Biosciences).
Data were analyzed with FlowJo software (Tree Star). Lymphocytes were defined based on the forward-scatter (FSC) and side-scatter (SSC) properties and their CD3+CD14− phenotype, whereas monocytes were defined by their FSC and SSC properties and CD3−CD14+ phenotype. A total of 20,000 beads and 10,000 live cells (lymphocyte and monocyte gates combined) were acquired. Antigen density was calculated according to the manufacturer's instructions.
Data were excluded from statistical analyses if the percentage of cells in the lymphocyte gate (as defined by the FSC/SSC profile) was <20% or if the percentage of cells in the monocyte gate (based on the FSC/SSC properties) was <5%.
Statistics
The postseroconversion profiles of CD4 count (on the square root scale), viral load (on the log to base 10), and CD4 density (on the untransformed scale) were linear over time and were completely determined by the intercepts and slopes for each group of progressors.
The profiles were compared among the three progressor groups with marginal and mixed longitudinal linear models. 24 In the context of linear models, the main difference between the two models resides in the assumptions of constancy of the variance and stationarity. 25 When the variance was approximately constant (on the chosen scale), a stationary marginal model with autoregressive of order 1 errors was used. When it was increasing with time, a mixed model (with random intercept and slope) was considered.
The bivariate relationship between the levels of CD4 count and receptor density was studied using linear mixed models, to account for repeated measurements per individual. Binary indicators (0/1) variables were used to define an intercept and slope for each group of progressors, and these parameters were compared using Wald tests.
Statistical analysis was performed with STATA 10 (STATACorp, College Station, TX). The level of significance was set at p < 0.05.
Results
Fast progressors have a significantly lower postseroconversion CD4 count level than slow progressors
The postseroconversion longitudinal profiles of CD4 count and viral load were analyzed for the three HIV+ patient groups (i.e., fast, intermediate, and slow progressors). The three groups of progressors were characterized by different CD4+ T cell count intercepts (or “postseroconversion CD4 counts”) 23 and slopes (slopes: p = 0.016, intercepts: p < 0.001, slopes and intercepts: p < 0.001) (Fig. 1A). The main difference between intermediate and fast progressors was the lower CD4+ T cell count intercept for the latter. Slow progressors had the same CD4+ T cell count intercept as intermediate progressors, but the slope was less steep. This phenomenon is even better illustrated with the CD4 count profiles of the three patient groups in 516 incident cases (Fig. 1B). Thus, fast progressors are distinguished from slow progressors by a more rapid decrease of CD4+ T cells over time and a significantly lower postseroconversion CD4 count level.

CD4+ T cell counts of HIV+ patients over time. Shown are the square roots of CD4+ T cell counts over time (in years of infection) for the three patient groups in the 40 patients evaluated (n = 13, 15, and 12 for fast, intermediate, and slow progressors, respectively) (
In all three groups of progressors, viral load (log to base 10) increased over time (Supplemental Fig. 1; see
ART does not restore CD4 densities on CD4+ T cells to physiological levels
CD4 densities on CD4+ T cells and monocytes were compared at the three time points before ART and after ART of all HIV+ patients and between HIV+ patients and HIV− donors. CD4 densities were significantly lower on CD4+ T cells (Fig. 2) but not monocytes (data not shown) of HIV+ patients at any time before or after ART than on those of HIV-negative volunteers (p < 0.001). CD4 densities on CD4+ T cells (Fig. 2) and monocytes (data not shown) from HIV+ patients were similar before and after ART (p = 0.12).
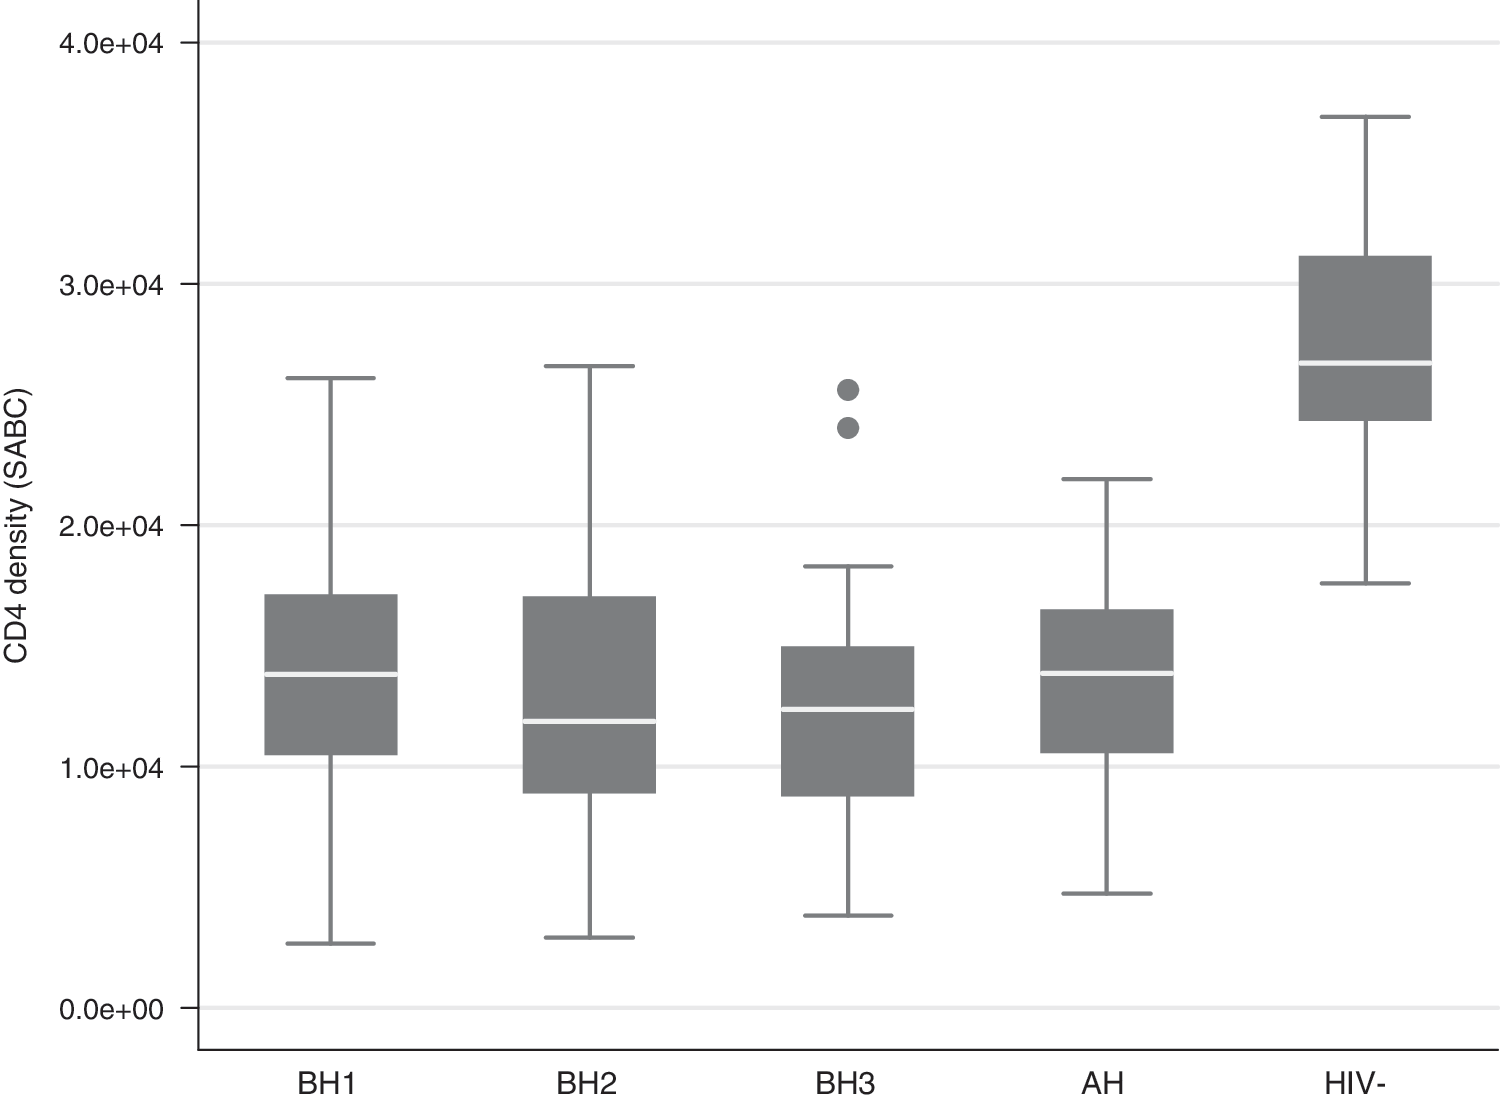
CD4 density on CD4+ T cells of HIV+ patients before and after ART and of HIV− donors. CD4 densities on CD4+ T cells (in SABC units) were compared at the three times before ART (BH1, BH2, BH3) and after ART (AH) of all HIV+ patients (n = 40 for each time point) as well as between HIV+ patients and HIV− donors (n = 10). For each HIV− donor, the mean of CD4 density at two different times was used. Whiskers of boxes represent upper and lower boundaries defining extreme values. Data were analyzed using the Wilcoxon Mann–Whitney rank-sum test.
CD4 densities decrease more rapidly in fast than in slow progressors
CD4 densities on CD4+ T cells and monocytes were examined longitudinally (before ART) for the three patient groups. CD4 densities on CD4+ T cells decreased over time in all three groups of progressors, but with a different course: the decline was more rapid in fast and intermediate progressors than in slow progressors; the intercepts were similar for fast and intermediate progressors, but somewhat lower for slow progressors (slopes: p = 0.108, intercepts: p = 0.528, slopes and intercepts: p = 0.051) (Fig. 3). In contrast, CD4 density longitudinal profiles of monocytes showed no clear differences among the groups (data not shown).

CD4 density on CD4+ T cells of HIV+ patients over time. Shown is the CD4 density on CD4+ T cells in SABC units over time (in years of infection) for the three patient groups. Tests were performed as described in Fig. 1. (Color image can be found at
CD4 counts and CD4 densities are related essentially in slow progressors
The bivariate relationships between CD4 count and CD4 density on CD4+ T cells of HIV+ patients were examined in the three progressor groups by linear mixed models to account for repeated measurements per individual. The relationships were significantly different among the three groups of progressors, with the slope being the main difference (slopes: p = 0.312, intercepts: p = 0.921, slopes and intercepts: p = 0.014) (Fig. 4). CD4 count and CD4 density were significantly correlated only in the case of slow progressors (p = 0.0279).

CD4 count versus CD4 density on CD4+ T cells of HIV+ patients. The bivariate relationship between CD4 count (in square root) and CD4 density (in SABC units) on CD4+ T cells was studied for the three patient groups with linear mixed models to account for repeated measurements per individual. (Color image can be found at
Discussion
To dissect the role of CD4 density in HIV pathogenesis, we longitudinally quantified the CD4 densities on CD4+ T cells and monocytes of ART-naive HIV-infected patients with different disease progression rates. A newly developed mathematical model integrating the CD4+ T cell loss over time, as well as information on the last negative and first positive documented HIV tests, permitted us to determine the “postseroconversion CD4 counts” and the longitudinal CD4 density profiles and compare these parameters between the three different progressors groups. Our main findings are that (1) fast progressors had a lower postseroconversion maximum CD4 count level than intermediate and slow progressors, (2) CD4 density on CD4+ T cells, but not on monocytes, was significantly lower at any time point in HIV+ patients than in HIV− individuals, (3) CD4 density on CD4+ T cells decreased more rapidly in fast than in slow progressors, (4) the relationship between CD4 T cell count and CD4 density on CD4+ T cells and monocytes over time was significantly different between the three groups of progressors, and (5) fully suppressive ART did not restore CD4 density on CD4+ T cells from HIV+ patients to levels found in healthy donors.
Our analysis of the postseroconversion CD4 count profiles of the three patient groups over time led to an intriguing finding. Fast progressors were differentiated from slow progressors not only by a more rapid decline of their CD4+ T cell counts, but also by a lower maximum CD4 count level attained after seroconversion. Intermediate progressors were distinguished from fast progressors by a higher postseroconversion CD4 count level and from slow progressors by a steeper CD4+ T cell count slope. Thus, fast progressors appear to recover CD4+ T cells less efficiently than intermediate and slow progressors after primary infection and, in addition, lose them more rapidly thereafter than slow progressors. These data also imply that pathogenic events in primary HIV infection may prime the long-term outcome of HIV disease.
The postseroconversion longitudinal profiles of viral load were also different between the three progressor groups. However, this difference, even though significant, was not as clear as that in the CD4 count profiles over time. Thus, in our study, viral load set point and/or slope were less discriminating factors among the three progressor groups than the postseroconversion CD4 counts.
Notably, more than 10 years ago, seminal work established levels of HIV RNA copy numbers at about 6 months postinfection that predict individual risk of progression rate. This was defined as the viral set point. 26,27 More recently, an immunological set point early in HIV infection was established to determine the risk of CD4+ T cell decline. 28 Our data suggest that in addition to the level of viremia and extent of immune activation in early infection, the maximal level of CD4 count attained after seroconversion may have prognostic value for guiding therapy. Two recent studies showed that initiating treatment during acute HIV infection improves the CD4+ T cell count. 29,30 Thus, patients with a high viral load set point, as well as patients with a low postseroconversion level of CD4 count, are likely to benefit from early treatment.
The CD4 density on CD4+ T cells was significantly lower in HIV+ patients at any given time point before or after ART than in healthy individuals. Two previous cross-sectional studies also found CD4 expression on peripheral blood T cells to be significantly lower in HIV-infected than in HIV-negative individuals. 20,21 In our study, the mean CD4 density on CD4+ T cells from healthy individuals was lower than that reported in the literature. 20,21,31 This discrepancy is most likely explained by the different methods employed: we used indirect immunostaining to quantify the number of SABC units as an estimate of CD4 density, whereas the previous studies used direct immunostaining. Of note, the interindividual variation was within the range of that observed in the previous studies. Surprisingly, successful suppression of HIV viremia by ART did not restore CD4 expression to physiological levels. In fact, ART had no effect on CD4 density. Lack of or only partial restoration is a well-known phenomenon in HIV disease subsequent to ART (e.g., incomplete recovery of CD4+ T cells 32,33 or normalization of immune activation 28 ). We cannot exclude a protracted clearance of HIV gene products that are known to down-regulate CD4 expression, such as Nef, Env, and Vpu, 19 while HIV RNA is already suppressed. Thus, analysis of CD4 expression levels at later time points might show partial or even complete recovery. Also of note, CD4 down-modulation occurred on the entire CD4+ T cell population, although only very few cells are infected in the chronic phase of HIV infection. 34 –37 Thus, indirect factors seem to be responsible for the CD4 down-modulation in HIV+ patients. One element that may result in CD4 down-modulation could be a dysfunctional cytokine network. Indeed, acute HIV infection is associated with an intense early cytokine “storm” in contrast to more moderate and delayed cytokine responses in acute hepatitis C virus or hepatitis B virus infections. 38 Alternatively, soluble HIV proteins, such as Nef, Vpu, or Env, may contribute to the effects observed. 19
The decrease of the CD4 density of CD4+ T cells over time tended to be more rapid in fast than in slow progressors. Notably, the more rapid decline of CD4 density in fast and intermediate progressors occurred despite their slightly higher baseline level of CD4 expression as compared to slow progressors. Similarly, Ginaldi et al. reported significantly lower CD4 expression levels on T cells in patients with late-stage disease (i.e., patients with <200 CD4+ T cells/μl) than in those with early stage disease in their cross-sectional study. 20 In contrast, Poncelet et al. found no difference in lymphocyte CD4 density between HIV-infected patients and healthy volunteers and consequently also no dependency on disease stage. 22 This discrepancy is likely explained by differences in the methods employed. Finally, data from in vitro studies also show an association of CD4 down-modulation with disease progression: Nef alleles from HIV strains isolated from patients with progression to AIDS efficiently down-regulate CD4, whereas Nef alleles from HIV strains isolated from long-term nonprogressors are compromised in their ability to down-modulate CD4. 15 –18
Importantly, the progressive CD4 down-modulation on CD4+ T cells in HIV+ patients may contribute to the functional impairment of CD4+ T cells observed in HIV infection. 39 CD4 plays an essential role in the generation of adaptive immune responses by acting as a coreceptor with the T cell receptor/CD3 complex, which binds peptide-MHC complexes. Furthermore, CD4 acts as a binding receptor for interleukin (IL)-16 40 ; ligation of IL-16 by CD4 may switch CD4+ T cell function from immune to inflammatory functions. 41 Both functions may be affected by the reduced expression levels of CD4 in HIV+ patients.
CD4 down-regulation by memory CD4+ T cells was recently proposed as a key mechanism by which African green monkeys survive SIVagm infection without developing AIDS. 42 These data might contrast with our findings of increased CD4 down-regulation in progressive HIV disease. However, they might also indicate that CD4-downregulation is not the pathway leading to CD4 depletion. The discrepancies between the studies emphasize that data obtained in monkeys must be interpreted with caution and must be corroborated in primary samples from human.
We also examined the bivariate relationship between CD4 count and CD4 density on CD4+ T cells of HIV+ patients and found that the two parameters were related only in slow progressors. Thus, the dynamics of CD4 T cell decline and decrease of CD4 density on CD4+ T cells are similar in slow, but not in intermediate and fast progressors. We may speculate that host factors, such as the cytokine network, are dysfunctional to different degrees in the three progressor groups, affecting the relationship between CD4 count and CD4 density on CD4+ T cells.
We also quantified CD4 densities on monocytes of HIV+ and HIV− individuals. Monocytes are precursors of dendritic cells and macrophages, which are among the first targets in sexual HIV transmission and thus are key components in HIV pathogenesis. 43 In line with published data, 31 physiological levels of CD4 density on monocytes (i.e., those found in healthy persons) were approximately one-third those on CD4+ T cells (data not shown). In contrast to CD4+ T cells, CD4 densities on monocytes were not lower in HIV+ patients than in healthy individuals (data not shown). Furthermore, over time, CD4 density profiles of monocytes from the three patient groups were similar. Thus, CD4 cell-surface expression is regulated physiologically and modulated by HIV in a cell type-specific manner.
Despite the clear-cut results of the statistical analyses, our conclusions as related to the CD4 densities are limited by the small number of patients analyzed. Thus, we consider this as an intriguing tendency that is more exploratory than conclusive and one that should be confirmed in a larger cohort.
In summary, this study clearly demonstrates that the CD4+ T cell count early in infection determines an individual's HIV progression rate. Thus, the postseroconversion CD4 count adds to the viral or immunological set point as a prognostic factor in early HIV infection. The prognostic implication of a lower postseroconversion CD4 count level also indicates that critical events during primary HIV infection prime the long-term outcome of HIV disease. Furthermore, this work reveals that rapid down-modulation of CD4 is associated with rapid disease progression that may contribute to the progressive functional impairment of the immune system, which may even persist after successful suppression of HIV RNA by ART.
Footnotes
Acknowledgments
This study was financed in the framework of the Swiss HIV Cohort Study, supported by the Swiss National Science Foundation. The members of the Swiss HIV Cohort Study are M. Battegay, E. Bernasconi, J. Böni, H.C. Bucher, P. Bürgisser, A. Calmy, S. Cattacin, M. Cavassini, R. Dubs, M. Egger, L. Elzi, M. Fischer, M. Flepp, A. Fontana, P. Francioli (President of the SHCS), H. Furrer (Chairman of the Clinical and Laboratory Committee), C.A. Fux, M. Gorgievski, H.F. Günthard (Chairman of the Scientific Board), H.H. Hirsch, B. Hirschel, I. Hösli, C. Kahlert, L. Kaiser, U. Karrer, C. Kind, T. Klimkait, B. Ledergerber, G. Martinetti, N. Müller, D. Nadal, F. Paccaud, G. Pantaleo, A. Rauch, S. Regenass, M. Rickenbach (Head of Data Center), Rudin C. (Chairman of the Mother & Child Substudy), P. Schmid, D. Schultze, F. Schöni-Affolter, J. Schüpbach, R. Speck, B.M. de Tejada, P. Taffé, A. Telenti, A. Trkola, P. Vernazza, R. Weber, and S. Yerly
Annette Audigé and Patrick Taffé contributed equally to this work.
Author Disclosure Statement
No competing financial interests exist.
References
Supplementary Material
Please find the following supplemental material available below.
For Open Access articles published under a Creative Commons License, all supplemental material carries the same license as the article it is associated with.
For non-Open Access articles published, all supplemental material carries a non-exclusive license, and permission requests for re-use of supplemental material or any part of supplemental material shall be sent directly to the copyright owner as specified in the copyright notice associated with the article.