




Abstract
HIV treatment with CCR5 receptor blockers may impact CCR5+ cell distribution. T cell subsets, plasmacytoid dendritic cells (PDC), and antigen-specific [Mycobacteria tuberculosis/avium (M.TB/MAI), cytomegalovirus (CMV), Herpes simplex (HSV), HIV-Gag] CD4+ T cells were measured in untreated R5-tropic-HIV-infected adults receiving 10 days of SCH532706 (Phase 1), 15 days no therapy, then 10 days of cART (without SCH532706) (Phase 2). Ten males were enrolled with median cells/μl (range) of CD4+ 310 (92–848), CCR5+CD4+ 57 (17–118), CD8+ 895 (459–1666), and CCR5+CD8+ 392 (250–983), and median plasma HIV RNA of 4.6 log10 copies/ml. At baseline, proportions of M.TB, MAI, CMV, HSV, and HIV-Gag-specific CD4+ T cells were 0.3%, 3.0%, 6.0%, 2.0%, and 1.6%, respectively. Median log10 HIV RNA copies/ml declines were 1.5 (Phase 1) and 1.75 (Phase 2) (p = 0.7). Median CD4+ and CD8+ changes, respectively, during Phases 1 (+16; +91) and 2 (+28; −71) were similar (p = 0.7 both). However, CCR5+CD8+ T cell fluctuations were significantly different (p = 0.02) during Phase 1 (+147 cells) vs. Phase 2 (−35 cells). PDC increased significantly more during Phase 1 (p = 0.04). Declines in antigen-specific cells were similar except for M. avium, which declined significantly during Phase 2 (p = 0.04). Similar declines in activation and proliferation of T cell subsets were observed during both treatment phases. For equivalent HIV RNA declines, CCR5-receptor blockade differentially increased CD8+ T cell and PDC numbers in the circulation. These results confirm that cell surface CCR5 expression on these cells constantly directs trafficking during HIV infection. The persistence and clinical meaning of these immunological changes during long-term exposure to this class of anti-HIV drugs are unknown, but may have implications for immunosurveillance of inflammation.
Introduction
C
Furthermore, we have previously shown that many viral antigen-specific CD4+ T cells in peripheral blood are CCR5+, including those specific for cytomegalovirus (CMV), HIV, and vaccinia. 5 –7
The majority of CCR5-expressing cells in the circulation are either CD4+ or CD8+ T lymphocytes. Typically 10–20% of CD4+ T cells and 40–50% of CD8+ T cells are CCR5+, 8 but it is the dual expression of CD4 and CCR5 that determines susceptibility to infection with most clinical isolates of HIV-1. 1 As previously reported, the majority of CCR5+CD4+ T cells in healthy adults are effector memory CD45RO+CD62L− cells, 7,9 10–20% are gut-homing CD45RO+intregrin ß7+ memory cells, 7,9,10 and are predominantly CD38−Ki67− resting cells. 1 Moreover, for healthy adult controls, a minority of CCR5+CD4+ T cells, typically 5–10%, is composed of T regulatory cells (unpublished data), as defined by the improved CD25+CD127dim phenotype. 11
There are other circulating cell types in healthy adults that may express CCR5 including natural killer (NK) cells, albeit at lower levels, and monocytes, 3 although in our experience, CCR5 expression is difficult to detect on CD14+ monocytes by flow cytometry. 8 CCR5 expression is not detectable on B lymphocytes. 3 In contrast, CCR5 is readily detected on circulating immature dendritic cells, 3 although these cells represent only 0.1% of leukocytes. It should be noted, particularly in the context of HIV infection, that circulating immature plasmacytoid dendritic cells (PDC) are the only cells apart from memory T lymphocytes that express relatively high levels of both CD4+ and CCR5. 12
In HIV-infected subjects, CCR5+CD4+ T cells remain largely effector memory CD45RO+CD62L− cells, but a reduced proportion are gut-homing cells. 7,9,10 Importantly, however, in subjects with primary HIV-1 infection, a large proportion of CCR5+CD4+ T cells consists of CD38+ activated cells, which in turn also contain a very high proportion of Ki67+ proliferating cells. 1,6,10 Similarly, activated and proliferating CCR5+CD4+ T cells are found in other primary viral infections including CMV, Epstein–Barr virus (EBV), and vaccinia. 1,7 In chronic HIV-1 infection, the proportion of CD4+ T cells that is CCR5+ is slightly increased, 13 but changes in the various subsets of CCR5+CD4+ T cells have not been reported.
Despite this expression of CCR5 on cells involved in both innate and adaptive antiviral immunity, those subjects in the general population lacking CCR5 due to homozygosity of the Δ32 mutation appear to be relatively unaffected by its absence, 14 except for a reported increase in susceptibility to West Nile Virus encephalitis. 15,16 In CCR5-deficient murine models Herpes simplex and cryptococcal infections have been more severe. 17 –19 However, HIV-infected subjects with a genetic reduction of CCR5 expression due to heterozygosity of the Δ32 mutation appear to have better HIV-related clinical outcomes with few negative clinical consequences. 14,20
Accordingly, small molecule CCR5 receptor blockers and monoclonal antibodies against CCR5 are in development as anti-HIV therapeutics.
17
Maraviroc (MVC), a small molecule antagonist of CCR5, has recently been approved as an anti-HIV agent
In the Phase III studies 26 there were also early (over the first 12 weeks) CD8+ T cell gains in all three arms of the study, but these were significantly greater in the MVC arms (p < 0.0001); declines occurred after week 12 in all arms, but CD8+ T cells remained significantly elevated at week 48 in the MVC arms as CD8+ peaks were higher. The mechanism underlying this observation is unclear, but effects of MVC on trafficking and reductions in immune activation 27 have been postulated as explanations. It is noteworthy that the recent development of MVC as an adjunctive antiinflammatory agent for rheumatoid arthritis 28,29 has been halted as no antiinflammatory benefit was shown. 30 Clinical trials using MVC to intensify cART in HIV-infected individuals with poor immune restoration despite virological suppression are underway, 31 but to date there is no evidence demonstrating a clinical benefit of the increased CD4+ T cell count seen with CCR5 receptor antagonists.
SCH532706 is a new small molecule CCR5 receptor blocker; in vitro data show that this compound inhibited the replication of 30 different isolates of HIV-1, with mean IC90 values below 10 nM. The in vitro affinity of SCH532706 for the CCR5 receptor appears to be greater than that of earlier agents in this class. Moreover, the drug binds CCR5 without affecting any receptor-mediated signaling but abrogates the response mediated by the natural ligands (Schering-Plough Research Institute, personal communication). Data showing the safety, anti-HIV activity, and pharmacokinetics of this agent in this cohort of HIV-infected adults have been published. 32
The aim of this study was to explore the quantitative and qualitative changes in T cell subsets, PDC, and antigen-specific CD4+ T cells during CCR5 receptor blockade with 10 days of SCH532706 (60 mg bid) given with ritonavir (100 mg qd) (Phase 1) and compare the changes to those seen during 10 days of cART (Phase 2) in the same group of patients. All patients received no therapy for 15 days (the washout) between the treatment phases. It was hypothesized that for equivalent declines in viral load during Phases 1 and 2, there would be differential effects on CCR5-expressing cell subsets and antigen-specific Mycobacteria tuberculosis/Mycobacterium avium (M.TB/MAI), CMV, HSV, and HIV Gag cells during CCR5 receptor blockade.
Materials and Methods
The study was conducted at a single center in Sydney, Australia in accordance with ICH Good Clinical Practice (GCP) guidelines (TGA annotated version, July 2000) and with St. Vincent's Hospital Human Research Ethics Committee approval using the human experimentation guidelines in the National Statement on Ethical Conduct in Research Involving Humans (NHMRC, Commonwealth of Australia). Informed consent was obtained from all patients. All patients were HIV-1-infected adults with R5-tropic virus (ViroTect Tropism assay, performed by Invirion Diagnostics, Oak Brook, IL) currently not treated, i.e., no cART for ≥3 months and ready to resume/start cART or cART naive. Whole blood for phenotyping, assessment of activation markers and antigen-specific T cells was drawn on days 1 (immediately before SCH532706 dosing), 3, and 10 in Phase 1 and on day 25 of the study (= day 1 of cART) immediately before the start of cART (Phase 2) and on days 28 (day 3 of cART) and 35 (day 10 cART). Plasma HIV RNA (Roche COBAS AmpliPrep/COBAS TaqMan HIV-1 test, analytical range 40–100,000 copies/ml) was assessed on days 1, 3, 10, 20, 25, 28, and 35.
Measurement of CCR5+ cell subsets
Ten-color flow cytometry was used to identify cell subsets including CD4+, CD8+, CCR5+CD4+, and CCR5+CD8+ T (CD3+) cells, as well as naive (RO-62L+), central memory (RO+62L+), and effector memory (RO+62L−) T cells. T regulatory cells (Tregs) were defined as CD25+CD127dim CD4+ T cells and further subdivided into CD45RO+ and CD45RO−, as previously described. 11 Gut-homing memory cells were defined as CD45RO+intregrin ß7+CD4+ T cells as previously described. 7 Activated CD4+ T cells were defined as CD45RO+CD38+, whereas proliferating cells were Ki67+. 7 PDC were quantified as lineage negative, CD4dim, HLA-DR+, and CD123+ cells. 12 Monoclonal antibodies used were CD3-Pacific Blue, CD4-AlexaFluor 700, CD8-AmCyan, CD38-PE-Cy7, HLA-DR-PerCP, CCR5-PE, Ki67-FITC, integrin ß7-APC, CD11c-APC, HLA-DR-APC-Cy7, and LIN-FITC from Becton-Dickinson (San Jose, CA), CD45RO-ECD from Beckman Coulter (Hialeah, FL), and CD62L-APC-Cy7 and CD123-PE-Cy7 from eBioscience (San Diego, CA). Fresh whole blood samples were stained and analyzed on an LSR II flow cytometer (Becton Dickinson) as previously described. 7 All samples were stained within 2 h of blood draw.
Measurement of antigen-specific CD4+ T cells
A 48 h whole blood culture and flow cytometric method was used to identify antigen-specific CD4+ T cells coexpressing CD25+ and CD134+ as described elsewhere. 33 Antigens used were PHA (SEB; Sigma, St. Louis, MO; 5 μg/ml), cytomegalovirus (CMV lysate BioWhitaker, concentration 1/250), M. tuberculosis (MTB) and M. avium (MAI) (Commonwealth Serum Laboratories, Melbourne, Australia; 5 μg/ml), and Herpes simplex (HSV) virus type 1 prepared from Vero cells incubated with HSV-1, as previously described, 33 and HIV-Gag (overlapping HIV-1 Gag 15-mer peptides, strain HXB2) from NIH AIDS reagents. Gag peptides were used as a pool of 123 peptides; the individual concentration for each peptide was 2 μg/ml as previously described. 5,6
Statistical methods
The primary endpoint was a comparison of the median [with interquartile (IQ) ranges] changes in absolute numbers and proportion of CCR5+CD4+ and CCR5+CD8+ T (CD3+) cells during 10 days of monotherapy with the CCR5 receptor antagonist (Phase 1) and 10 days of dosing with cART (Phase 2). Secondary endpoints included comparisons of the median changes (absolute numbers and proportion) in naive, memory (effector and central), proliferating (Ki67+), and activated (CD45RO+CD38+) CD4+ and CD8+ T cells, Tregs, CCR5+ T cell memory subsets, lineage negative PDC, and antigen-specific CD4+ T cells coexpressing CD25+ and CD134+, respectively. p-values were calculated from a two-sided, paired, sign rank test. A Wilcoxon rank sum test was used to compare the baseline immunological and virological parameters at the start of each treatment phase, i.e., day 1 and day 25.
Results
Subject characteristics and virological response to therapy
Ten HIV-1-infected white males with median age of 40 years (range 31–49 years) were enrolled. All were infected through male-to-male transmission. All had a clinical history of HSV infection; of the seven formally assessed for prior exposure to CMV, all were IgG positive. None had a prior history of tuberculosis or MAI disease; 4 of the 10 were antiretroviral naive. All patients were compliant with study procedures, although one patient missed a single dose of SCH532706 on day 9; all patients commenced their optimized cART regimens on day 25 and were fully adherent to day 10 and beyond. In all patients this cART regimen consisted of a dual nucleoside reverse transcriptase inhibitor (NRTI) backbone plus either a protease inhibitor (PI) in five patients [unboosted atazanavir (n = 4), fosamprenavir/r (n = 1)] or efavirenz (n = 4) or raltegravir (n = 1). Day 1 and day 25 baseline immunological and virological parameters before the start of Phases 1 and 2, respectively, are shown in Table 1. Parameters at day 25 (i.e., following the completion of Phase 1 and the 15 day washout), which were statistically different from baseline on day 1, are indicated in Table 1. The median plasma HIV RNA at the start of Phase 2 was 0.3 log10 copies/ml lower than at the start of Phase 1 (p = 0.01). Importantly, the median declines in plasma HIV RNA (VL) during 10 days of dosing with SCH532706/r and 10 days of cART were 1.5 and 1.75 log10 copies/ml, respectively (p = 0.7), and therefore were entirely comparable.
Naive (RO-62L+); memory (RO+); central memory (RO+62L+); effector memory (RO+62L−); gut homing (B7+CD127+). T cell defined by initial gating on CD3+ cells.
Wilcoxon rank sum test.
Changes in CD4+ T cell subsets
In the HIV-infected subjects, median absolute changes in T cell subsets during Phases 1 and 2 are described in Table 2. CD4+ T cell gains during Phases 1 (+16 cells/μl) and 2 (+28 cells/μl) were small and not significantly different in the pairwise comparison (p = 0.7); median changes in the CD4+ T cell fraction were similar between Phases 1 (+2.5%) and 2 (+1.4%) (p = 0.2). Changes in the absolute numbers and proportion of CD4+ memory T cells including effector and central memory cells were not significantly different during Phases 1 and 2. However, the median CD4+ T cell central memory count was significantly higher at the start of Phase 2 as shown in Table 1. Six percent (range 3–17%) of CD4+ T cells were Ki67+ at the start of Phase 1 and absolute declines in proportion of proliferating CD4+ were 1.3% and 1.6%, respectively, in Phase 1 and 2 (p = 0.9). Thirteen percent (range 6–32%) of CD4+ memory T cells expressed the activation marker CD38 at baseline; the proportion of CD4+ memory cells that was CD38+ increased marginally (0.4%) during Phase 1 and declined during Phase 2 (–3.4%); the change between phases was similar (p = 0.5).
Naive (RO−62L+); memory (RO+); central memory (RO+62L+); effector memory (RO+62L−); gut homing (B7+CD127+).
At baseline, the median proportion of CD4+ expressing CCR5 was 19% (range 11–46). Median absolute changes in CCR5+CD4+ T cells were +15 and +13 cells/μl in Phase 1 and Phase 2, respectively. These absolute changes represent a median increase in the proportion of CCR5+CD4+ T cells of 5% and 2.5% during Phase 1 and Phase 2, respectively (p = 1.0). Absolute numbers of CD4+ T cells expressing CCR5 and plasma HIV RNA levels for each time point in the study are shown in Fig. 1. The proportion of Ki67+ and CD38+ cells within the CCR5+CD4+ T cell subset pretreatment was 19% (range 10–41%) and 28% (range 10–41%), respectively; declines in both of these subsets were similar during Phases 1 and 2 (Table 2). At baseline the proportion of CCR5+CD4+ T cells that was gut homing and expressed the IL-7 receptor α chain (integrin ß7+CD127+) was 5.2% (range 0.7–12); the changes in proportions of CCR5+ gut-homing CD4+ T cells were small and similar during Phases 1 and 2 (data not shown). Similarly, small increases in Treg numbers were seen during both treatment phases (p = 0.6 in the pairwise comparison).

Median absolute CCR5+CD4+ () T cells ( ) T cells (
 ) at each time point during the treatment phases (with ranges shown). The periods of treatment with SCH532706 and cART are indicated; the panels in purple are no treatment periods (note the different scale on the y-axis in
Changes in CD8 T cell subsets
During receipt of the CCR5 receptor blocker total CD8+, CD8+ memory, and CD8+ effector memory T cells increased; in contrast, all of these CD8+ T cell subsets declined during receipt of cART. Although these changes in Phases 1 and 2 were nonsignificantly different in the pairwise comparison, the changes in total CD8+ were substantial, i.e., +92 cells/μl in Phase 1 and −71 cells/μl in Phase 2 (p = 0.7). Five percent (range 2–12%) and 13% (range 4–43%) of CD8+ T cells were Ki67+ and CD38+, respectively, pretreatment; the proportion of Ki67+CD8+ cells fell in an equivalent manner during both Phases 1 and 2 (absolute changes in numbers shown in Table 2), however, there was a trend toward a greater decline in the proportion of CD38+CD8+ cells during Phase 2 (p = 0.06), although changes in absolute numbers were equivalent during the treatment phases. At baseline, the median proportion of CD8+ T cells expressing CCR5 was 46% (range 25–70). All CD8+ T cell subsets had returned to baseline values at day 25 with the exception of the CCR5+CD8+ central memory T cells, which remained significantly higher than baseline as shown in Table 1. Median absolute changes in CCR5+CD8+ T cells were +147 and −35 cells/μl in Phase 1 and Phase 2, respectively (p = 0.02), suggesting a differential effect on this subset of CD8+ T cells during CCR5 blockade. These absolute changes represent a median increase in the proportion of CCR5+CD8+ T cells during Phase 1 of 10%, as opposed to a decline of 0.5% during Phase 2 (p = 0.004). Furthermore, most of this increase occurred by day 3 (Fig. 1). Within the CCR5+CD8+ T cells, an increase in the effector memory subset occurred during receipt of the CCR5 receptor antagonist, contrasting with a decline observed during receipt of cART, although the differences in these changes were nonsignificant in the pairwise comparison (p = 0.2). The proportion of Ki67+ and CD38+ cells within the CCR5+CD8+ T cell subset pretreatment was 8% (3–19%) and 24% (7–49%), respectively; declines in both of these subsets were similar during Phases 1 and 2 (Table 2, Fig. 2).

Median absolute CCR5+CD8+ () T cells and CCR5+CD8+Ki67+ T cells ( ) at each time point during the treatment phases (with ranges not shown). The periods of treatment with SCH532706 and cART are indicated; the panels in gray are no treatment periods. (Color image can be found at
Changes in PDC
PDC, which also largely express CCR5 in the circulation 12 (unpublished data), increased during both Phase 1 and Phase 2, but the change was significantly greater during receipt of the CCR5 receptor antagonist (p = 0.04) than during cART (Table 2).
Changes in antigen-specific CD4+ T cells
At baseline, in this relatively healthy cohort of HIV-infected males, there were large numbers of CD4+ T cells specific for CMV (6%) and MAI (3%). Proportions of CMV, M.TB, and HIV-gag-specific cells were significantly higher at the start of Phase 2 than at baseline (Table 1). Overall, during Phase 1 and Phase 2 there were equivalent declines in proportions of M.TB-, HSV-, and HIV-Gag-specific CD4+ cells (Fig. 3). In contrast, proportions of MAI-specific CD4+ cells remained unchanged during CCR5 blockade and declined significantly on cART (p = 0.04); there was a trend toward a greater decline in CMV-specific CD4+ cells during receipt of cART compared to the period of CCR5 blockade (p = 0.06).
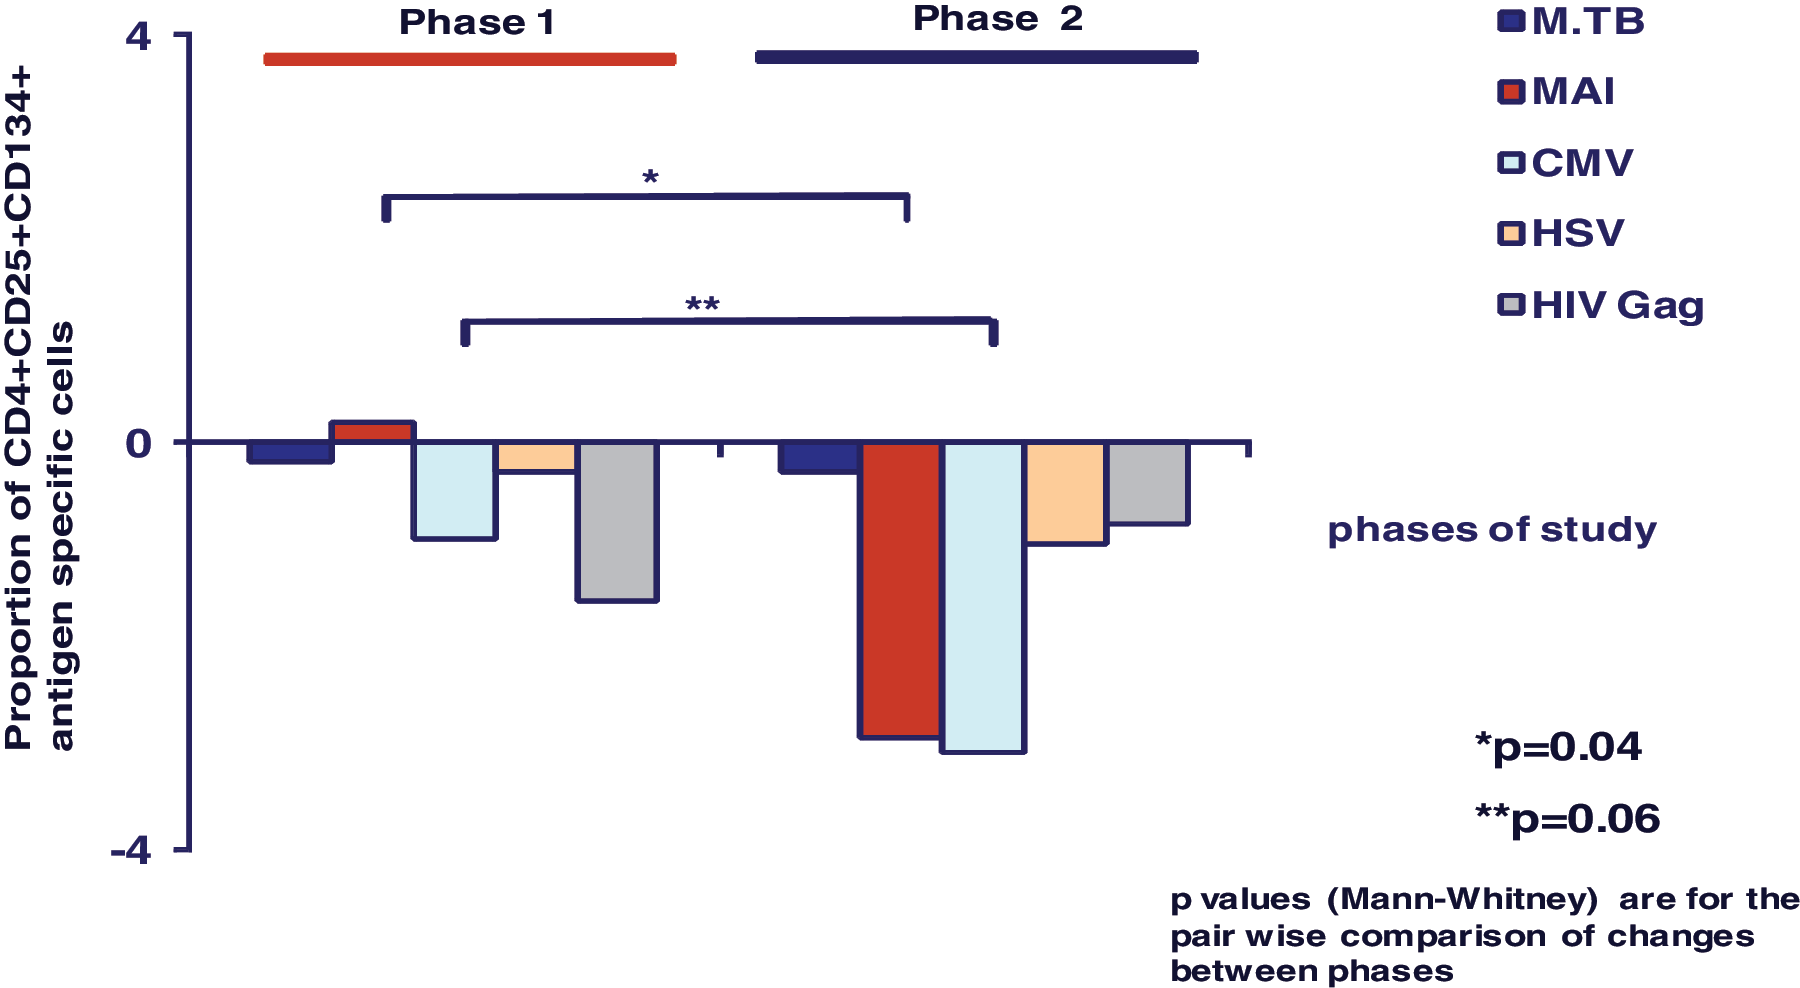
Changes in proportion of CD4+CD25+CD134+ antigen-specific cells during Phase 1 compared to Phase 2. (Color image can be found at
Discussion
In this study, where the same group of patients was sequentially exposed to receipt of a new CCR5 receptor blocker as monotherapy, a no-therapy washout period of 15 days and then cART, there were equivalent declines in plasma HIV RNA during the two respective treatment periods. Changes in CD4+ T cells were modest and equivalent during both treatment periods and this is not unexpected given the very short exposure to both the CCR5 receptor blocker and cART in this study.
In contrast, the changes in CD8+ T cell numbers were positive during receipt of the CCR5 receptor blocker and negative during receipt of cART. The most striking and significant difference was found in the CCR5+ subset of CD8+ T cells. Here, there was both an increase in the absolute numbers and the subset fraction during CCR5 blockade, whereas there was a decline during receipt of cART. The increase in this subset as a proportion of CD8+ T cells during receipt of the CCR5 receptor blocker, compared with the decrease during cART, was highly statistically significant (p = 0.004). Moreover, the changes in this subset began very early during dosing with the CCR5 blocker, i.e., before the drug had reached steady state 32 and prior to any significant changes in plasma HIV RNA (Fig. 1). Furthermore, the majority of the change was over by day 3.
Overall, the changes in the number of CCR5+CD8 T cells will be the composite of several complex processes. We have previously demonstrated that during very early HIV infection, rates of proliferation of CCR5+ T cells dramatically increase compared to HIV-negative controls, resulting in the accumulation of activated CCR5+CD8+ T cells. 1 This accumulation is probably driven in vivo by constant proliferation, since these cells rapidly undergo apoptosis in vitro, 10 and the equivalent subset disappears quickly from the circulation in healthy controls following the response to vaccinia inoculation, with an apparent half-life of 2–3 days. 7
In the current study, the high proliferation rate and activation state of CCR5+CD8+ T cells were rapidly reduced both by monotherapy with the CCR5 receptor blocker and subsequent cART; this would be expected to reduce CD8+ T cell numbers. Therefore, the rapid rise in CCR5+CD8+ T cells during receipt of the CCR5 receptor blocker, taken together with a decline in the proportion of these cells that expressed the proliferation marker Ki67 (Fig. 2) and the activation marker CD38, strongly suggests that the administration of this compound was associated with the accumulation of cells in blood due to inhibition of CCR5-directed chemotaxis and extravasation. This conclusion is strengthened by the observation that the increase occurred before there was any decrease in plasma viral load, making it less likely that changes in antigen load contributed to this phenomenon.
Interestingly, a similar increase was not seen in the CCR5+ subset of CD4+ T cells during CCR5 blockade. CCR5+CD4+ T cells, in contrast to the CD8+ T cells, during HIV infection proliferate, but do not accumulate, 1 and a similar phenomenon for CCR5+ memory CD4+ T cells has been subsequently reported in SIV infection. 34 Therefore, the total number of CCR5+CD4+ T cells will result not only from an increase in cells trapped in the circulation by the CCR5 blocker, but also may increase due to reduced infection of these cells, whereas they may decrease due to reduced proliferation and rapid clearance of activated apoptosis-prone cells. The differential effect on the CCR5+CD4+ and CCR5+CD8+ T cells seen in this study may relate to differences in trafficking characteristics of these two T cell subsets and to the total numbers available in later stages of HIV-1 disease. It is unknown if the binding of this CCR5 receptor blocker to CCR5 on CD4+ and CD8+ T cells is different in vivo. Additionally, it may be more likely that there are many more CCR5+CD8+ T cells and they normally represent a much higher fraction of CD8+ T cells than the CCR5+ proportion of CD4+ T cells as discussed previously. Therefore decreased trafficking due to the antiviral effect of therapy leads to a general rise in circulating memory cells 35 due to trafficking of trapped cells 36 including both CCR5+ and CCR5−CD8+ T cells. 1
There was also a significant differential increase in PDC during receipt of the CCR5 receptor blocker compared to cART. We suggest that during active HIV replication, circulating PDC, which express high levels of CCR5 and CXCR3 (unpublished data), traffic into inflamed tissue, creating an apparent decrease in the steady-state circulating number, whereas this depletion is ameliorated during receipt of antiretroviral therapy. The differential effect on the PDC subset during CCR5 blockade compared to the changes during cART suggests an additional direct effect on PDC trafficking over and above the effects of viral load suppression.
Circulating T cells continually undertake extravasation either into lymph nodes or white pulp of the spleen, or into nonlymphoid tissue, before returning to blood via lymphatic vessels and the thoracic duct. 4 The extravasation into secondary lymphoid tissue via high endothelial venules has been shown to be dependent on three coordinated adhesion interactions involving molecules on T cells: CD62L, integrin activation, and the chemokine receptor CCR7. 4 In the case of extravasation into nonlymphoid tissues by T cells lacking CD62L, CCR5 is believed to be particularly important. 4 The constitutive role of G protein-coupled receptors generally in this process of extravasation was inferred from the lymphocytosis induced by administration of pertussis toxin in SIV-infected rhesus macaques. 37 The current study confirms and extends previous data, thus implicating CCR5 in the regulation of the number of circulating effector lymphocytes and PDC.
Overall, there was a “damping down” of the number of antigen-specific CD4+ T cells responding to recall antigens during both treatment phases, which was equivalent except for cells specific for MAI, which declined more during cART; for CMV-specific cells, there was a trend toward a greater reduction during cART. The declines in CD4+ HIV Gag-specific T cells probably correlate with declines in plasma HIV RNA, but it is difficult to reconcile the declines in the other antigen-specific cells during the treatment phases. These data do not provide a clear explanation for the excess of Herpes (simplex and zoster) infections reported in those receiving other CCR5 receptor inhibitors such as maraviroc. 21 However, the duration of exposure and follow-up may well have been too short to see a differential effect. The changes seen in the 10-day period of intervention are likely to have been dominated by changes in cell trafficking with rapid changes in the inflammatory milieu in tissues as viral load and cell death decrease precipitously. This might result in an increase in cells with other specificities being trapped in the periphery. CD8+ pathogen-specific immune responses were not examined in this study. Given the changes seen in CD8+ T cell subsets reported here and the impact of maraviroc on the CD8+ T cell pool, 25,26 this deserves consideration in future studies.
There is considerable interest in the potential activity of CCR5 receptor blockers in reducing immune activation, an important component of HIV pathogenesis. 27 Recent data presented from a subanalysis of the MERIT study 38 suggest a more rapid decline in some activation markers such as CD38 on CD4+ T cells and the D-dimer in those receiving MVC compared to those receiving efavirenz (EFV)-based regimens, but not others such as IL-6. Although there was a correlation between the increase in CD4+ T cells and the decline in CD38 in that study, it was not clear whether the greater increases in CD4+ T cells seen in MVC recipients were related to trafficking changes, greater reductions in immune activation, or both. In this study, although there were substantial reductions in proliferation and activation of CD4+ and CD8+ and in the CCR5+ T cell subsets during receipt of the CCR5 receptor blocker, these reductions were similar to those seen during cART with a trend toward a greater decline in the proportion of activated CD8+ T cells during the period of cART administration.
The interpretation of the results of this study are somewhat limited by the small number of patients and the short duration of exposure to the CCR5 receptor blocker in Phase 1. In addition, it might be argued that the sequential design of the study, incorporating a washout period of 15 days, which may not have been long enough to obviate all the effects of the CCR5 blocker, may have had an impact on the changes seen in the cART phase. But, the return to baseline of almost all the immunological parameters at the start of the cART treatment phase argues against this (Table 1). The findings presented here provide informative and novel insights into the early immunological changes that occur with this CCR5 receptor blocker, which cannot be explained by a differential effect on HIV replication or CD8+ T cell proliferation or activation compared to cART without a CCR5 receptor blocker and so are likely to be related to altered cell trafficking. 38 Overall, these data extend the observations in Phase III studies regarding early CD8+ T cell rises in patients receiving CCR5 receptor blockers.
Further exploration of the in vivo immunological effects of CCR5 receptor blockers is required. First to exclude any long-term harmful effects on immune responses to pathogens and second to elucidate the mechanism (trafficking versus putative reduction in immune activation above and beyond an effect on HIV viral replication versus other) of the higher CD4+ and CD8+ T cell gains observed in the maraviroc licensing studies 21,22 and to determine whether this finding offers any additional clinical benefit to patients with HIV.
Footnotes
Acknowledgments
In addition to all the patients who participated in this study we would like to acknowledge John McAllister, Mark Lacey, Martina Rafferty, and Brett Sinclair of the HIV, Immunology and Infectious Diseases Clinical Services Unit, St. Vincent's Hospital, Sydney; Min Kim of Westmead Millenium Institute for HSV preparations; and the NIH Reference Reagents Program for provision of HIV-1 overlapping Gag peptides.
The study was coordinated by the National Centre in HIV Epidemiology and Clinical Research (NCHECR), Sydney, Australia and conducted at St. Vincent's Hospital, Sydney, Australia between February 2007 and September 2007. The Phase 1 study (P04112) was funded by Schering-Plough Research Institute (SPRI); this immunology substudy was conducted with permission from Schering-Plough Research Institute (SPRI) but was funded by the NCHECR. NCHECR is funded by the Australian Government Department of Health and Ageing, and is affiliated with the Faculty of Medicine, The University of New South Wales.
These data were presented at P297, HIV9 Glasgow Congress, 9–13 November 2008, Glasgow, Scotland, UK.
Phase I studies are exempt, but this study was registered on the Australian Clinical Trials Registry (ACTR): ACTRN012607000171415.
Sarah Pett and John Zaunders contributed equally to this article.
Author Disclosure Statement
No competing financial interests exist.