
Abstract
The isolation and characterization of primary strains of human immunodeficiency virus (HIV) is a vital tool for assessing properties of viruses replicating in HIV-infected subjects. HIV-1 isolation was carried out from 30 HIV-1-infected patients from a Comprehensive Care Clinic (CCC) after informed consent. Virus was successfully isolated from 9 out of the 30 samples investigated. Seven of the isolates were from drug-naive patients while two were from patients on antiretroviral drugs. The isolates were biologically phenotyped through measurement of the syncytium-inducing capacity in MT2 cells. Six of the isolates exhibited syncytia induction (SI) associated with CXCR4 coreceptor usage while three of the isolates were non-syncytia-inducing (NSI) isolates associated with CCR5 coreceptor usage. In addition, the replication capacity of the isolates was further determined in established cell line CD4+ C8166. Indirect immunofluorescence assay was used to check the antigen expression on the cells as a supplementary test. HIV-1 isolation success was 70% (7/10) and 20% (2/20) in naive and drug-experienced patients, respectively. The majority of the viral isolates obtained (6/9) were of the SI phenotype, though SI virus strains are rare among non-B subtypes. A significant correlation between virus isolation success and viral load was established. Coreceptor use data for heavily treatment-experienced patients with limited treatment options are scanty and this is the group with perhaps the most urgent need of novel antiretroviral agents.
Introduction
HIV/AIDS
HIV coreceptor usage and switching have been analyzed most extensively for clade B isolates, which predominate in North America and western Europe. 4,5 The biological and molecular properties of non-clade B viruses, which now cause the majority of new HIV-1 infections worldwide, remain largely unknown. The coreceptor specificity of non-clade B HIV-1 isolates is only beginning to be characterized. 6,7 Available data suggest that clade C isolates, which predominate in sub-Saharan Africa and Asia, are by and large R5, even when derived from patients with advanced AIDS. 8,9
The MT2 cell line expresses CD4 and the CXCR4 coreceptor, but no CCR5; the X4 but not R5 strains infect these cells. The cell line can be useful for differentiating the CXCR4-using or syncytia-inducing (SI) strains from the CCR5-using or non-syncytia-inducing (NSI) strains. The method may be more useful for obtaining prior knowledge of preferential coreceptor usage in viruses from patients before starting therapy with chemokine inhibitors, especially with CCR5 antagonists, in order to exclude the presence of X4 viruses. These variants could be present at cellular reservoirs and therefore are being missed by testing plasma, a limitation that probably also applies to other methods based on viral isolates derived from peripheral blood mononuclear cells (PBMCs). 10
Virologic features of HIV-1 isolates and plasma viral burden have been reported to play an important role in disease outcome of infected adults. 9,11,12 M-tropic R5 NSI HIV-1 strains predominate during the asymptomatic period of infection and are the phenotypes preferentially transmitted. 9 As the infection progresses, in approximately 50% of the patients HIV-1 switches from M-Tropic to either T-tropic (X4) or dual tropic (R5X4) SI, which is followed by a rapid decline of circulating CD4 T+ cell counts and progression to AIDS. 13,14 Usually M-tropic NSI strains have an in vitro slower replication rate with a lower yield of virus than T-tropic SI viral strains. 11,15 Phenotypic studies on non-B viruses are rare.
Earlier relationship between viral phenotype (i.e., NSI or SI) and the virulence of HIV strains had been established. 9 It is now known that, in vitro, R5 viruses usually correspond to NSI on T cell lines and are able to replicate in monocyte macrophages (M-tropic), all features that previously had been linked to less virulent strains. In contrast, X4 strains are SI on T cell lines and replicate preferentially on T lymphocytes (T-tropic), all characteristics of more pathogenic virus strains. 14,16 On the basis of these findings, it is clear that HIV coreceptor usage may be associated with disease progression.
Recently, interest in HIV tropism has resurged, mainly due to the appearance of promising new anti-HIV molecules that target CCR5 and CXCR4 receptors. 17,18 These may finally become a part of the anti-HIV armamentarium in developing countries, hence making it critical to have at our disposal laboratory methods to easily determine coreceptor HIV tropism. Given their mechanism of action, the clinical development of these compounds may require prior knowledge of viral tropism in a given HIV-infected individual. Moreover, close follow-up of viral tropism in patients undergoing treatment with these compounds to exclude possible phenotype shifts could be advisable. 19,20
Materials and Methods
Study population and samples
The study included 30 HIV-1-infected adults enrolled in a Comprehensive Care Clinic (CCC) on the western outskirts of Nairobi city. Written informed consent from the patients was obtained. The study was reviewed and approved by the Institute's Review Board. The median age of the patients at the time of the study was 35.2 years with a sex distribution of 6 men and 24 women. Of the 30 patients 10 were naive while 20 were on treatment with combination therapy consisting of combinations of two nucleoside reverse transcriptase inhibitors for a mean time of 6–12 months. Whole blood/EDTA samples were collected from the subjects between April and June 2006. The participants ranged from 24 years to 47 years. Six were male and 25 were female. All the study subjects were emigrants from different upcountry geographic locations in search of better opportunities in Nairobi, the capital city of Kenya. Study patients' characteristics are shown in Table 1.
A total of 30 subjects were enrolled in the study; 20 patients were on antiretroviral therapy (ART) while 10 were ART naive; 24 were females and 6 were males. Those on ART were on treatment for a period of 6 months to 1 year.
ART, antiretroviral therapy; DL, detection limit.
Viral load assay
This was carried out on plasma obtained from the blood samples. The assay was run using the NucliSens HIV-1 QT assay (Biomeurex, The Netherlands), which is based on target amplification using a nucleic acid-based assay (NASBA) according to the manufacturer's instructions. The assay selectively and directly amplifies HIV-1 RNA in an isothermal one-step sandwich hybridization procedure using two oligonucleotide primers.
CD4+ cell count assay
CD4+ cell enumeration was carried out with the Cyflow counter (Partec, Germany). The Partec Cyflow is a single-platform, three-parameter (SSC plus two-color fluorescence) desktop flow cytometer. It contains a solid-state laser for green excitation. CD4+ cells were analyzed using true volumetric absolute counting. For data analysis, the analyzer used Flomax software. The kit used contained direct immunofluorescence reagents for enumeration of mature CD4+ T lymphocytes and, simultaneously, of CD45+ cells in peripheral blood. The kit consisted of a monoclonal antibody, MEM-241, which recognizes the human CD4 antigen, a transmembrane glycoprotein (59 kDa) of the immunoglobulin supergene family, present on a subset of T lymphocytes (“helper/inducer” T cells) and expressed at lower levels on monocytes and granulocytes. Briefly, 20 μl of EDTA whole blood was added into a Partec tube containing monoclonal antibodies and lyse buffer followed by a 20-min incubation step. The tube was then attached to the cyflow instrument that initiated automized flow cytometric counting analysis. Results were then read as CD4+ T cells/μl of blood.
Preparing PBMCs
Five milliliters of whole blood was centrifuged at 1500 rpm for 10 min and plasma was separated from cells and stored in cryovials at −30°C. The plasma was used for viral load assay. Cells were then diluted two times with sterile phosphate-buffered saline (PBS) and layered slowly in Ficol Paque (Amersham Biosciences, Sweden). The cells were then centrifuged at 15,000 rpm for 30 min with breaks off. The buffy coat was carefully removed. PBMCs obtained were washed three times in PBS. Cell count was done using the Trypan blue dye exclusion test and cell concentration was adjusted to 2×10⁶ cells/ml.
HIV isolation
Virus isolation was performed by standard coculture technique as previously described. 21 Briefly, freshly isolated PBMCs were recovered from patients and cocultured with an equal volume of PBMCs obtained from HIV-seronegative blood donors already prestimulated for 48 h with phytohemagglutinin (PHA) (5 μg/ml, Difco, USA) in RPMI 1640 medium (Sigma, USA) supplemented with 10% fetal bovine serum (Gibco USA), 5 U/ml interleukin (IL)-2 (r-human, Gibco), and 100 U/ml penicillin/streptomycin (Gibco). Cultures harvested were assayed for P24 antigen using the P24 antigen detection kit (Vironistika, USA) and were maintained for 28 days; cell-free supernatants were collected on the third day and every seventh day up to 28 days. Fresh PHA-stimulated donor PBMCs were added to the cultures. Viral stocks were stored at −80°C for further infectivity assays.
P24 antigen ELISA to determine isolation success and replication rate
This was carried out using a commercial P24 enzyme immunoassay Vironistica HIV-1 kit (Biomereux, France) according to the manufacturer's instructions. The virus isolation positive samples were those with optical density (OD) above the cut-off value.
Determination of the viral phenotype
Syncytium formation assay
To determine the SI phenotype, supernatant from infected PBMC cultures were cocultured with the MT2 cell line. Twice a week, the MT2 cells were observed for syncytium formation under a light microscope and the culture supernatants were tested for HIV-1 P24 antigen production. An isolate was considered SI when both formations of syncytia under light microscopy were observed and proviral DNA was detected in the infected MT2 cells. As the MT2 cell line expresses CD4 and the CXCR4 coreceptor, but not CCR5, the X4 but not R5 strains infect the MT2 cells. Thus, this cell line is useful for differentiating the CXCR4-using or SI from the CCR5-using or NSI strains. VIHNL.3 LAI (X4 or SI) was used as a positive control. The assay for syncytium formation was performed as previously described. 16 Briefly, supernatant from HIV-1-positive cocultures was added to duplicate wells containing 5×10⁴ MT2 cells/well in RPMI 1640 medium (Sigma, USA) supplemented with 10% fetal bovine serum (Invitrogen, USA) and 10 μg/ml gentamicin (Invitrogen, USA) in 96-well plates. SI primary isolates from patients were used as positive controls in each assay, and wells without virus served as negative controls. Syncytium formation of the culture was examined microscopically at 3 to 4 day intervals for 28 days. After each examination, half of the culture volume was replaced with fresh medium. SI was scored when an infected well had five or more syncytia. At the end of the culture, the cells were recovered, washed twice with PBS, and HIV-1 proviral DNA was amplified directly on cell lysates as described. 1 An indirect immunofluorescence assay of the infected MT2 cells was carried out as a supplementary test (Fig. 1).
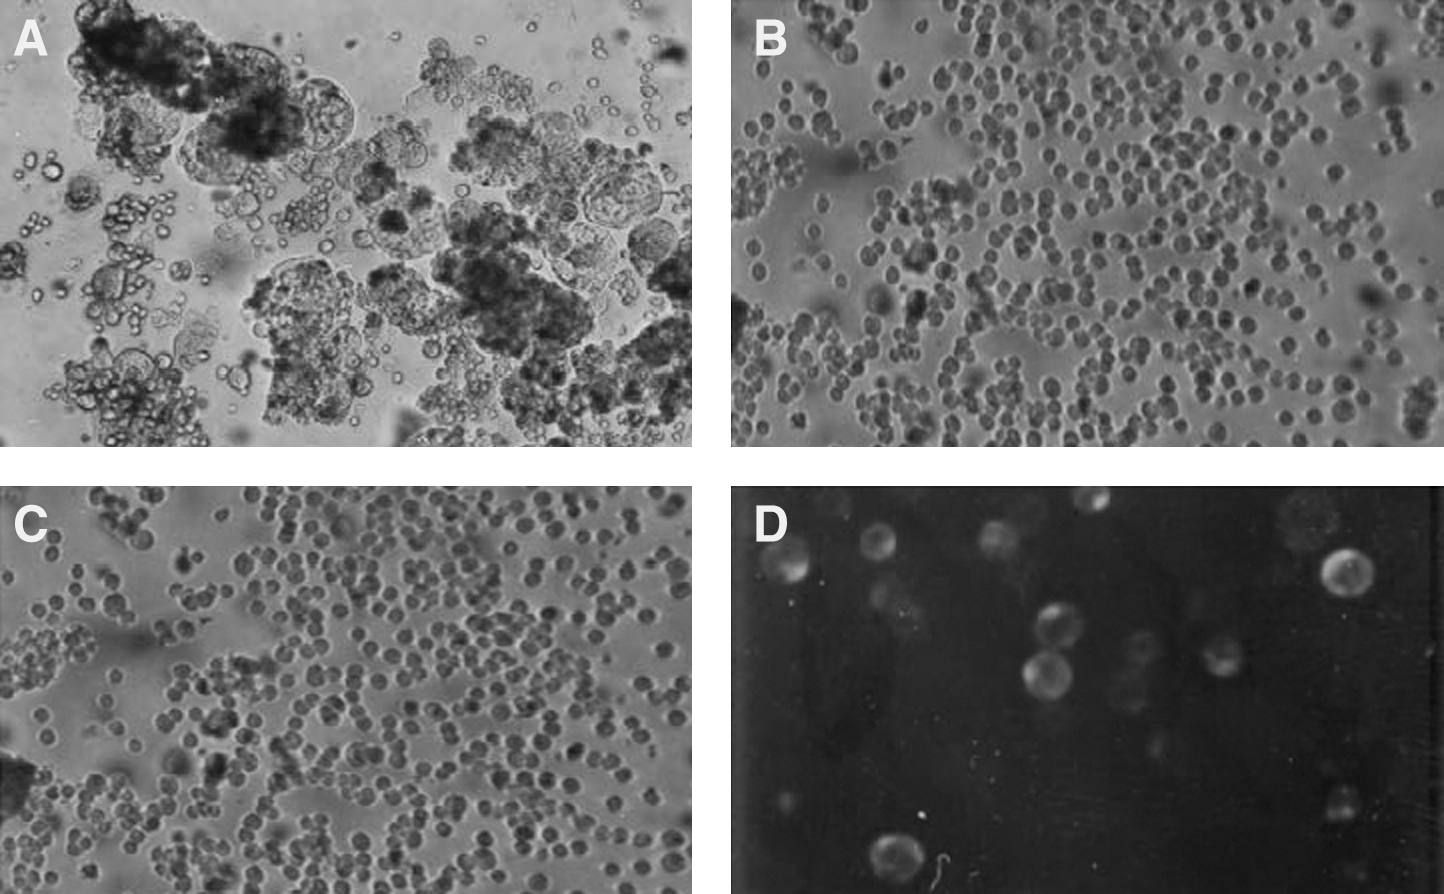
Cytopathic effects of HIV-1 isolates in MT2 cell lines. MT2 and C8166 cells were plated in 96-well plates. MT2 cells were then exposed to culture supernatants and microplates were incubated for 3 days. The cells were observed under an inverted microscope.
Isolates growth in C8166 CD4+ cell line
The C1866 CD4+ cell line was also used to assess the ability of the viral stocks to grow and cause CPE. Cells were used in their logarithmic phase of growth. These were plated in a 96-well plate at a concentration of 1×10⁵ cells/well and 20 μl of the viral stock inoculated into each well. The plate was incubated in RPMI 1640 medium (Invitrogen, USA.) supplemented with 10% fetal calf serum (Gibco, USA) in a 5% CO2 humidified incubator for 5 days with the plate being examined every day. This test supplemented the MT2 assay for confirming the virus phenotype.
Amplification of proviral DNA from MT2 cells
This was carried out on the MT2 cells previously infected with the HIV-1 primary isolates. The cells were pelleted by spinning at 1500 rpm and DNA was extracted from the cells using DNAZOL reagent (Molecular Research Center Inc., Cincinnati, OH). A part of the HIV-1 group M env gene covering the C2-V3 region was amplified by nested PCR using primers F1 (5'-CCAATTCCCATACATTATTGTGCCCCAGCTGG-3') and R1 (5'-CCAATTGTCCCTCATATCTCCTCCTCCAGG-3') in the first round and F2 (5'-GTCAGCACAGTACAATGACACATGG-3') and R2 (5'-TCCTTCCATGGGAGGGGCATACATTGC-3') in the second round. The cycling conditions for this PCR were similar, i.e., a hot start at 95°C followed by 35 cycles of denaturation at 95°C for 30 s, annealing at 55°C for 30 s, and extension at 72°C for 1 min, and a final extension of 72°C for 10 min. PCR amplification was confirmed by visualization with ethidium bromide staining of agarose gels. A product of about 500 base pairs in size was amplified from the MT2 cells with the proviral DNA. The amplified products were sequenced directly using the second PCR primers of the C2-V3 region that were used to generate the amplicons. The BigDye Terminator DNA sequencing kit from Applied Biosystems was used to sequence the DNA amplicons on the ABI Prism 310 genetic analyzer (Applied Biosystems, Foster City, CA). The generated sequences were aligned manually based on the alignment of Los Alamos database reference sequences for subtyping. Sequences were aligned using CLUSTAL W version 1.81 22 with subsequent inspection and manual modification. The Position-Specific Scoring Matrix (PSSM), a tool for categorizing V3 sequences into X4 or R5 phenotype that detects nonrandom amino acid distributions at adjacent sites associated with empirically determined groupings of sequences with a known characteristic, was used. Two matrices are available for determining the predicted phenotype: an X4R5 matrix calculated by using sequences of known coreceptor phenotype and an SINSI matrix calculated by using sequences of known syncytium-inducing phenotype on the MT2 cell line. This comparison produces a score: the higher the score, the more closely the sequence resembles those of known X4 viruses. 18 The specific C-PSSM with the current available si/nsi matrix was used for subtype env sequences.
Indirect immunofluorescence
This was carried out on cells that had been inoculated with viral stocks. Cells were washed in phosphate-buffered saline (PBS) three times. Each wash was done for 5 min and the cell count was adjusted to 2×10⁶/ml. Then 10 μl of the cell suspension was added on each microwell of the Teflon-coated glass slides. HIV-1-positive plasma was added on the wells followed by an incubation step in a humidified chamber set at 37°C. A conjugate bound with a fluorescent dye FITC (Dako, Denmark) was added to the wells. Fluorescence was observed on wells positive for syncytia indicating HIV-1 antigen expression on the cells.
Statistical analysis
A descriptive analysis of virus isolation rates was then made. A chi square analysis using a 107 programme was performed to assess the association of viral load and successful HIV isolation (P24 antigen positivity in culture) using a Chi square test. A similar comparison was also made based on CD4 cell count and P24 antigen assay positivity. Descriptive analysis of virus phenotype of isolates from patients on ARVs and those that are naive was made.
Results
CD4 count
The participants displayed a wide range of rates of progression to AIDS, defined as development of a CD4+ T cell count of <200 cells/μl. The detection of X4 strains was significantly correlated with more rapid progression to an AIDS-defining illness or a CD4+ T cell count of <200 cells/mm. There was no relationship between the detectable HIV-1 isolation (P24 antigen detection) and CD4 count, categorized status; CD4 >200 cells and CD4 count <200 cells, p=0.13 (Table 2).
Eight of the nine isolates were from samples with CD4 of less than 200 cells/ml and one from CD4 greater than 200 cells/ml. There was no relationship between the detectable HIV-1 isolation (P24 antigen detection) and CD4 count, categorized status; CD4 >200 cells and CD4 count <200 cell, Chi=2.42, p=0.13.
P24, protein 24; CD4, cluster of differentiation 4.
HIV virus isolation
Table 1 shows characteristics of patients whose samples were used for virus isolation. Ten of the patients were drug naive while 20 were on ARV treatment. There were 6 male patients and 14 female patients. HIV-1 was successfully isolated from 9 of the 30 samples as determined by the P24 ELISA (Table 2). This represents 30% HIV-1 isolation success. Table 2 shows HIV isolation in relation to CD4 count and viral load. There was no relationship between the detectable HIV-1 isolation (P24 antigen detection) and CD4 count, categorized status; CD4 >200 cells and CD4 count <200 cells, p=0.13; however, there was a strong association between virus isolation and viral load (p<0.000)
Biological features of HIV-1 isolates
The isolates were evaluated for SI capability in the MT2 cell line; 6 out of the 9 isolates (67%) were able to induce syncytia formation (Table 3). To ensure infection of the MT2 cells by SI strains versus noninfection by the NSI strains we examined the presence of HIV-1 provirus by PCR on MT2 cells cultured with the viral isolates (Fig. 2). HIV-1 provirus was present in MT2 cells inoculated with all SI strains but also with one NSI strain. This finding suggests that either (1) the number of SI strains in the viral isolate is too low to induce syncytium formation or (2) the existence of a viral strain able to infect MT2 cells without causing syncytia. The infection of the MT2 cells by SI strains was further confirmed by use of an indirect immunofluorescence assay (IFA).There was a strong association between MT2 syncytium induction phenotype and viral load (p<0.000). Although all isolates were of the X4 phenotype, direct sequence and use of the X4/R5 matrix showed an X4 (six isolates) when the V3 sequences were interpreted with PSSM as well as the 11/25 rule. All the SI isolates presented a net charge >4 at position 11 (Fig. 3).
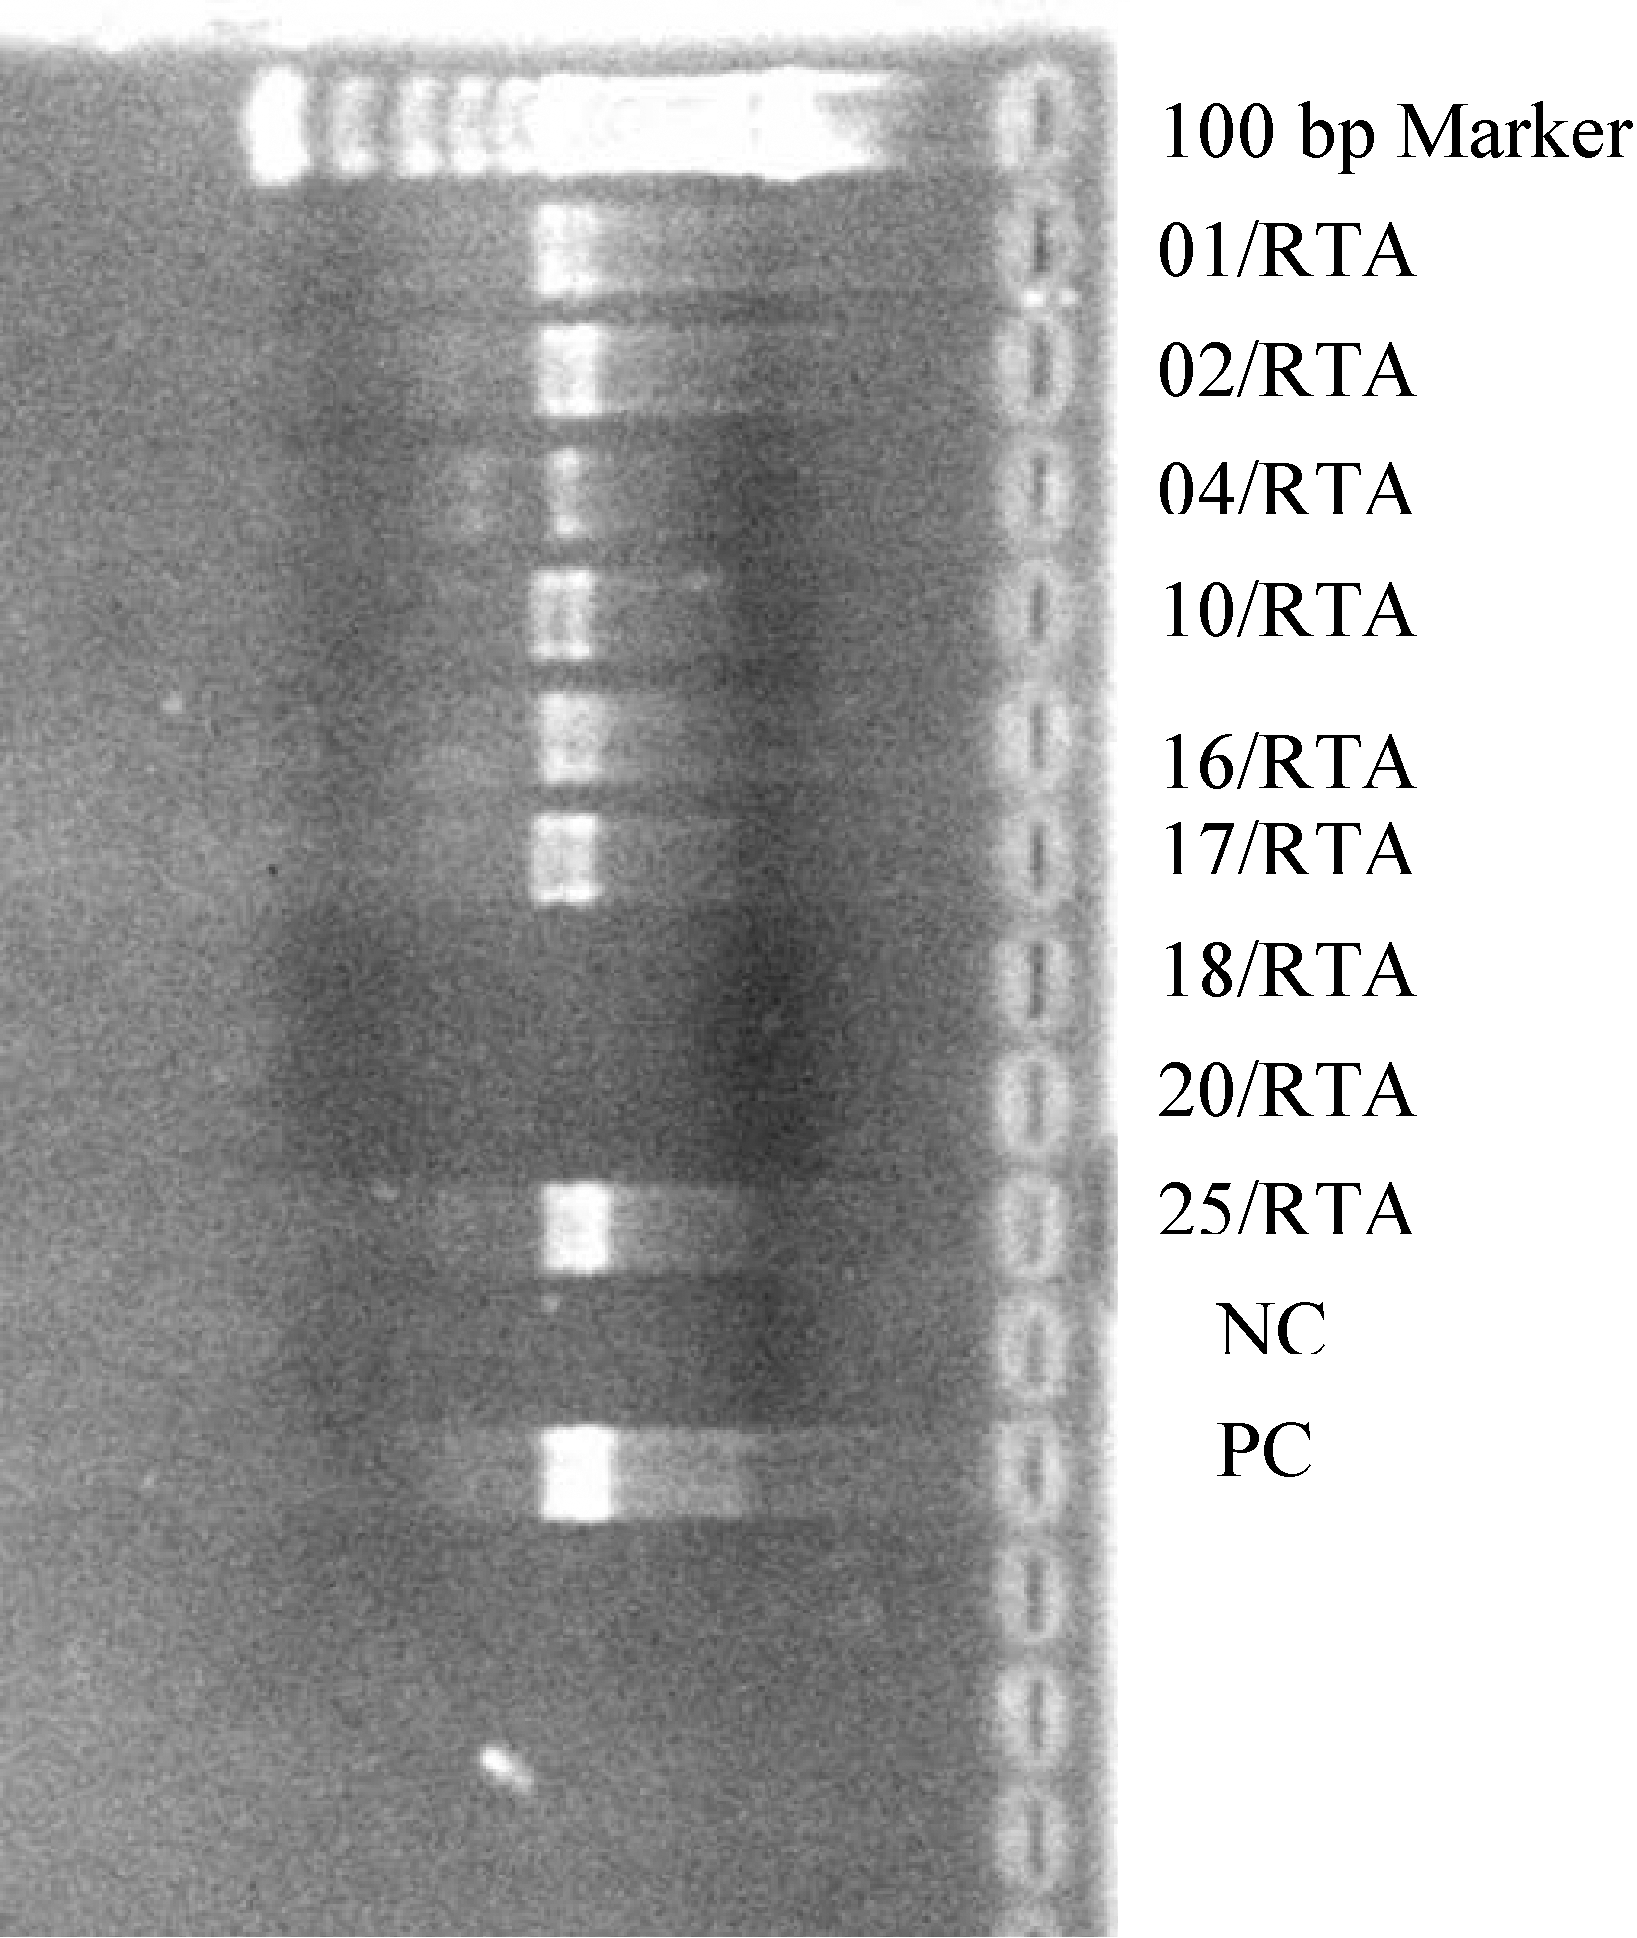
PCR amplicons of viral isolates (approximate size 500 bp). MT2 cells were infected with primary isolates and after 28 days of proviral DNA was extracted from the cells and PCR amplification was carried out. NC (negative control) was from an NSI virus whereas PC (positive control) was from SI virus IIIB.

Alignment of the HIV-1 envelope C2V3 amino acid sequences of the six isolates generated in this study. Subject code and GenBank accession number of the sequence are depicted on the left. The amino acid substitutions in the sequences are shown. A dash represents identity to the reference sequence.
There was a significant correlation between viral load and isolation positivity (p<0.0001).
ART, antiretroviral therapy.
Discussion
The use of the MT2 cell assay for the biological phenotyping of HIV-1 isolates has many advantages over the cumbersome characterization performed in PBMCs. It is easy to perform, reliable, has a high degree of sensitivity and specificity, and the correlation to the replication rate in PBMCs is very good. It can be used for routine testing of large numbers of infected individuals. 24 Brumme et al. 25 studied antiretroviral drug-naive HIV-1-infected patients. CXCR4 using virus was detected in 18% of those individuals. Coakley et al. 26 found that proportion to be 15%. In yet another study, Demarest et al. 27 reported 12% CXCR4 using virus. The data on the effect of antiretroviral therapy on tropism of non-B subtypes are limited, although one study of subtype C HIV-1-infected patients from Zimbabwe indicated that antiretroviral drug treatment was associated with increased CXCR4 use. 28 In this study the effect of ART on virus phenotype could not be conclusively determined since only two isolates were raised from subjects on ARV treatment (Tables 4 and 5).
Viral isolation in peripheral blood mononuclear cell culture was higher in the naive group than in the ART group. The majority of the isolates exhibited SI phenotype in MT2.
ART, antiretroviral therapy; SI, syncytium-inducing; NST, non-syncytium-inducing.
In this study, we investigated whether patients carrying MT2-positive and MT2-negative HIV-1 strains differ in terms of HIV-1 RNA load and CD4 count. The MT2 assay has been described by Koot et al. 29 and Boucher et al. 30 as a simple and convenient method of determining the biological phenotype of HIV-1 isolates. However, clinical deterioration in patients with MT2-negative virus is not uncommon. Isolate 001/RTA, despite exhibiting the NSI phenotype, was obtained from a patient whose viral load was 350,000 copies/ml and who had a CD4 count of 98 cells/mm3. Schneweis et al. 13 reported that a high CD4+ count was associated with failure to isolate HIV. This study found no association between CD4+ count and virus isolation (p=0.13). However, in all study subjects except one (16/RTA), the CD4 count was less than 200 cells/mm3. This is one of the WHO markers of clinical suppression based on which naive patients are considered for ART while those already on treatment are considered for a change to a second-line regime on suspicion of drug resistance. 31
There were significantly lower rates of positive cultures in the ART group, 2 out of 20 (10%), than in the naive group, 7 out of 10 (70%). Because the two groups differed in the frequency of suppression of plasma HIV-1 RNA levels, it was presumed that samples with lower plasma HIV-1 RNA levels would have a lower rate of positive cultures. When a patient harbors dual tropic HIV-1 variants, the efficiency with which these variants utilize the CXCR4 coreceptor may influence the patient's response to CCR5 antagonists. Lastly, previous reports associated SI viruses mainly with B strains. 32 This low prevalence of SI viruses in Africans has been attributed to immune activation due to parasitic and bacterial infections. 33 However, in this study the majority of viral isolates were SI in biological phenotype.
All the sequences generated in this study were deposited in GenBank with the following accession numbers: JF829685, JF829686, JF829687, JF829688, and JF829689.
Footnotes
Acknowledgments
This study was carried out at the Centre for Virus Research within the Kenya Medical Research Institute. It was funded by the KEMRI/Japan International Cooperation Agency. The authors wish to thank the participants for consenting to the use of their samples in this study. We would also like to thank Dr. Horuyo Mori of Osaka Institute of Public Health for the MT2 cells and technical assistance.
Author Disclosure Statement
No competing financial interests exist.