




Abstract
An increased incidence of bone and lipid toxicities is associated with HIV-1 infection and its treatment. Mesenchymal stem cells (MSCs) are multipotent cells that can differentiate into both osteoblasts (OB) and adipocytes (AC). We hypothesize that the interaction of MSC and HIV-1 underlie these toxicities. Serum was collected from uninfected control and HIV-infected, antiviral-naive patients. Sera were divided into three groups: HIV-negative sera (n = 5), HIV-positive low viral load (LVL) (VL range 120; 4000, n = 5) or high viral load (HVL) (VL range 100,000; 500,000, n = 5). MSCs were exposed to these sera (5%) in an adipogenic/osteogenic condition and in nondifferentiating conditions in acute and chronic exposure models. Markers of adipogenesis/osteogenesis were examined in both MSCs induced to differentiated and nondifferentiating cells. Sera from HVL HIV-1-infected individuals induced a clear proadipogenic phenotype, as evidenced by an increase in adipocyte formation and the induction of increased expression of adipogenic markers including LPL and PPARγ. Both CD4 receptor blockade and treatment with the antiretroviral AZT attenuated these proadipogenic effects, suggesting that an infection event may underlie the observed phenomena. Finally, inhibition of COUP TF-1 by HIV-1 TAT was identified as a potential molecular mechanism for these effects. These results suggest that HIV-1 directly interacts with and may infect MSCs resulting in alterations of their differentiation potential, findings that significantly enhance our understanding of HIV-1-associated bone and fat toxicities.
Introduction
I
Mesenchymal stem cells (MSCs) are multipotent precursor cells derived from the bone marrow that can differentiate into a number of cell types, including chondrocytes, adipocytes, and osteoblasts. 5 These cells are identified by expression of the STRO 1 extracellular marker. In addition to their roles as a source of replacement cells for a variety of tissues, these cells are considered to have important hematopoietic supportive functions in the bone marrow compartment. Their differentiation into terminal cell type is a tightly regulated and, as of yet, not fully elucidated process. 6,7
MSCs are of clinical interest in the setting of HIV-1 infection as they are the cell type from which both osteoblasts (OB) and adipocyte (AC) cells are derived. 7,8 Since the early 1990s researchers have hypothesized that a “see-saw” relationship exists in the bone marrow cavity, where production of ACs from stromal precursors is at the expense of OB production and vice versa. 8,9 This theory is borne out by clinically observed phenomenon, such as the increased AC content of osteoporotic and aging bone 10,11 as well as studies in which agents inducing AC production reduced OB numbers. 6,8 Similarly, treatment of bone marrow stromal cells with bone morphogenic proteins (BMP) results in reduced formation of ACs. 12 Adipocytes produce secreted factors such as leptin and estrogen, which can positively regulate bone mass. 13 –17 The activities of peroxisome proliferator-activated receptors gamma (PPARγ) and the runt-related transcription factor-2 (RUNX-2) are key to our understanding of the relationship between fat and bone. Activity of the RUNX-2 transcription factor is not only essential for the maintenance of the OB phenotype, but also drives the differentiation of OBs from MSCs, while activity of PPARγ in MSCs induces differentiation into adipocytes. 5,15 –17
The eventual phenotype of the differentiating cell is generally considered to be controlled by an antagonistic balance between RUNX-2 and PPARγ. 17,18 For example, studies have demonstrated that activation of PPARγ using pharmacological agents can lead to decreased bone mass in vivo, while mice lacking the PPARγ gene display increased bone mass and an inability to develop adipocytes. 18 –20 Indeed, even in the differentiated mature cell, function can be altered by perturbing this balance, with in vivo studies using a mouse model demonstrating a reduced bone formation rate and suppression of RUNX-2 in OBs in which PPARγ had been activated, 20 although Kim et al. have demonstrated that activation of PPARγ induces death through an MAPK-dependent mechanism in osteoblastic cells. 21
The possibility that impaired production of ACs and OBs from MSCs contributes to the phenomenon of HIV-1/ART-associated bone and fat abnormalities has been considered in some studies; Wang et al. demonstrated that HIV-1 infection could alter the clonogenic potential of MSCs in an HIV-1 TAT protein/tumor necrosis factor (TNF)-α-dependent manner, 22 while previous studies by our group have demonstrated that exogenous treatment of MSCs with HIV-1 REV and p55 could alter their potential to differentiate into OBs. 23 To our knowledge only one group has examined the direct effects of ART on MSC; in ex vivo experiments Jain et al. have demonstrated that a subset of HIV-1 protease inhibitor (PIs) drugs could inhibit both osteogenic and adipogenic differentiation. 24 However, a clear picture of the interaction between HIV-1, its treatment, and MSCs has yet to emerge.
In the ex vivo studies published herein, we demonstrate that treatment with serum from HIV-1 patients can both dysregulate OB function and MSC osteogenic/adipogenic differentiation in a viral load-dependent manner. We also delineate the involvement of the HIV-1 proteins gp120 and TAT in these events. In addition, we demonstrate that an infection event appears to underlie, at least in part, the observed phenomena. These findings offer new insights on the role of MSC in HIV-1-associated toxicities.
Materials and Methods
Ethical approval
Patients were enrolled in this study as part of the Dublin City HIV cohort, which was approved by the Mater Misericodiae University Hospital ethics committee. Patients were enrolled after written informed consent was obtained.
Serum collection
Serum was prepared from whole blood collected form patients enrolled in the Dublin City HIV Cohort. The patients were divided into three groups: uninfected control (n = 5), treatment-naive high viral load (HVL 100,000–150,000) (n = 5), and low viral load (LVL 200–4000) (n = 5), respectively (see Table 1). Uninfected control patients all had a negative HIV test in the previous 6 months. Serum was extracted by centrifugation, after which it was aliquoted and stored at −80°C until required.
Age is given in years. Sex: m = male, f = female. Viral load is copies per ml, as determined by branched DNA analysis.
Cell culture
A human mesenchymal stem cell line was obtained from Lonza, UK (lot #6F4392—cells obtained from a 19-year old-male) and routinely cultured at 37°C, 5% CO2 in mesenchymal stem cell growth media. Cells were differentiated by culturing in osteoblast differentiation media for 15 days or maintained for three 3-day cycles of adipogenic induction or adipogenic maintenance media (both obtained from Lonza). Cells were used between passage 3 and 6.
Serum experiments
Initially cells were incubated with varying concentrations (0–10%) of control (i.e., noninfected) serum diluted in basal media for 24 h. Posttreatment, cells were harvested and their number and viability/activity were determined as described below. A concentration of 5% serum was identified as the optimum, as it had a minimal effect on cell growth/viability (Fig. 1A) and was used for subsequent experiments.
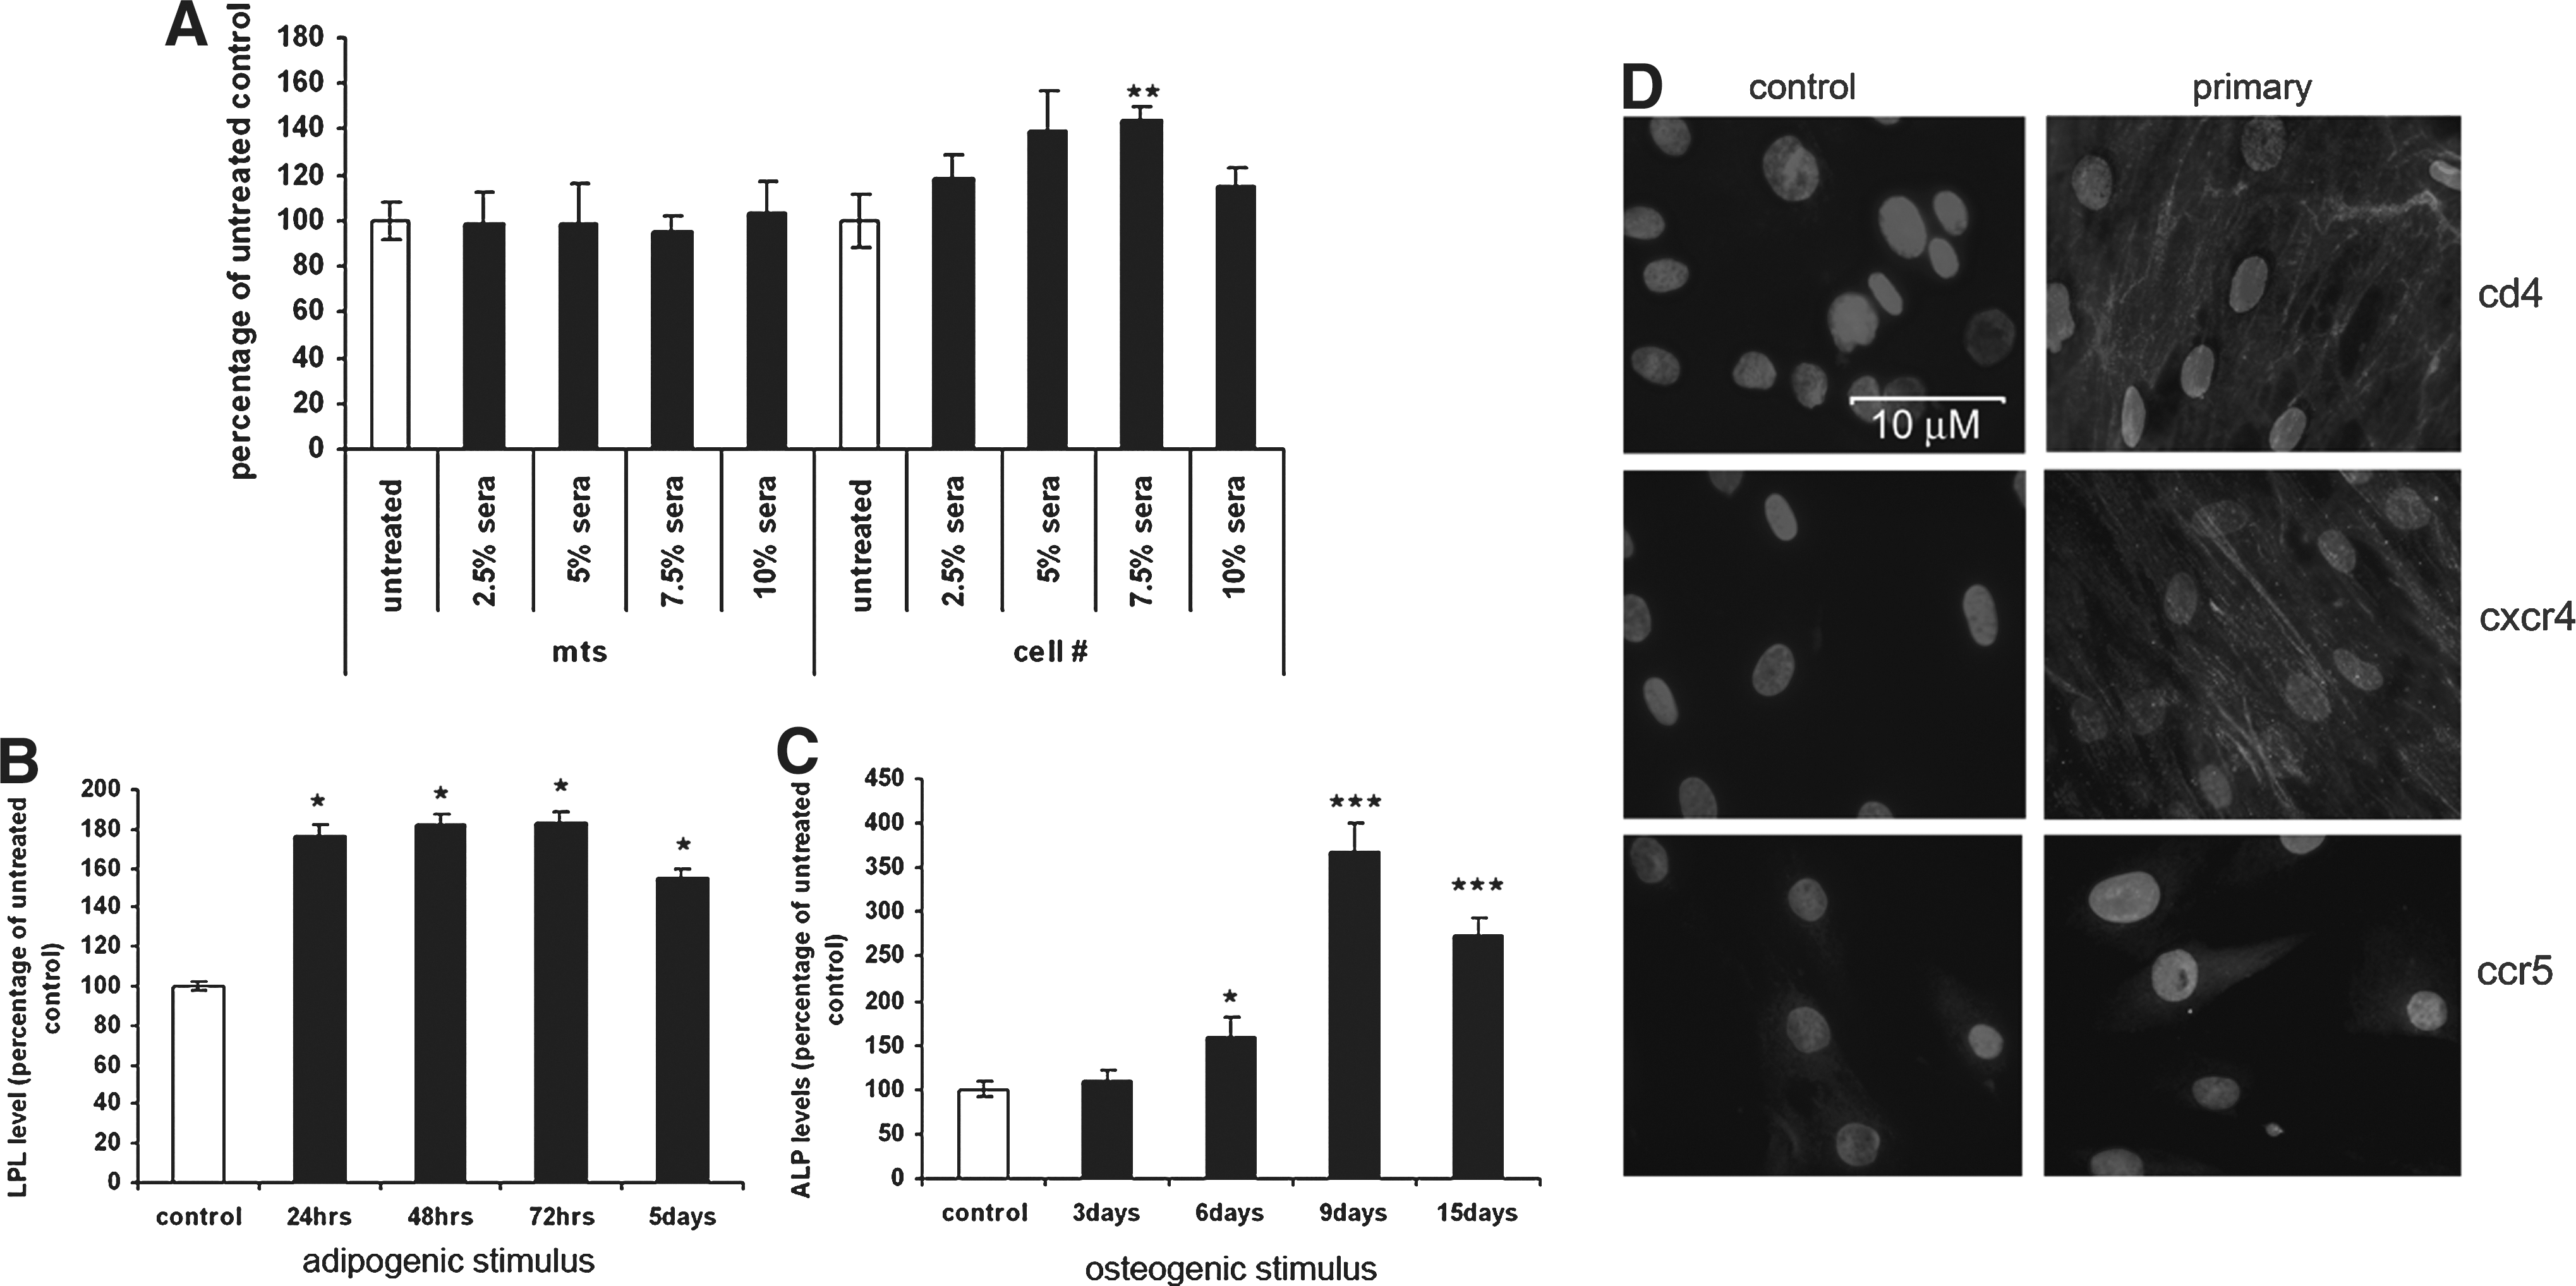
Validation of experimental design and protocols and characterization of MSC receptor expression. MSCs were exposed to varying concentrations of human sera (2.5–10% v/v) collected from non-HIV-1-infected donors for 72 h and cell number and cell activity/viability were determined using quantitative ponceau red staining and MTS assay, respectively
Due to the limited quantity of serum samples available, some experiments in Figs. 2 –6 were carried out using individual patient's serum samples rather than sera from all five. These experiments were, as standard, repeated at least three times.
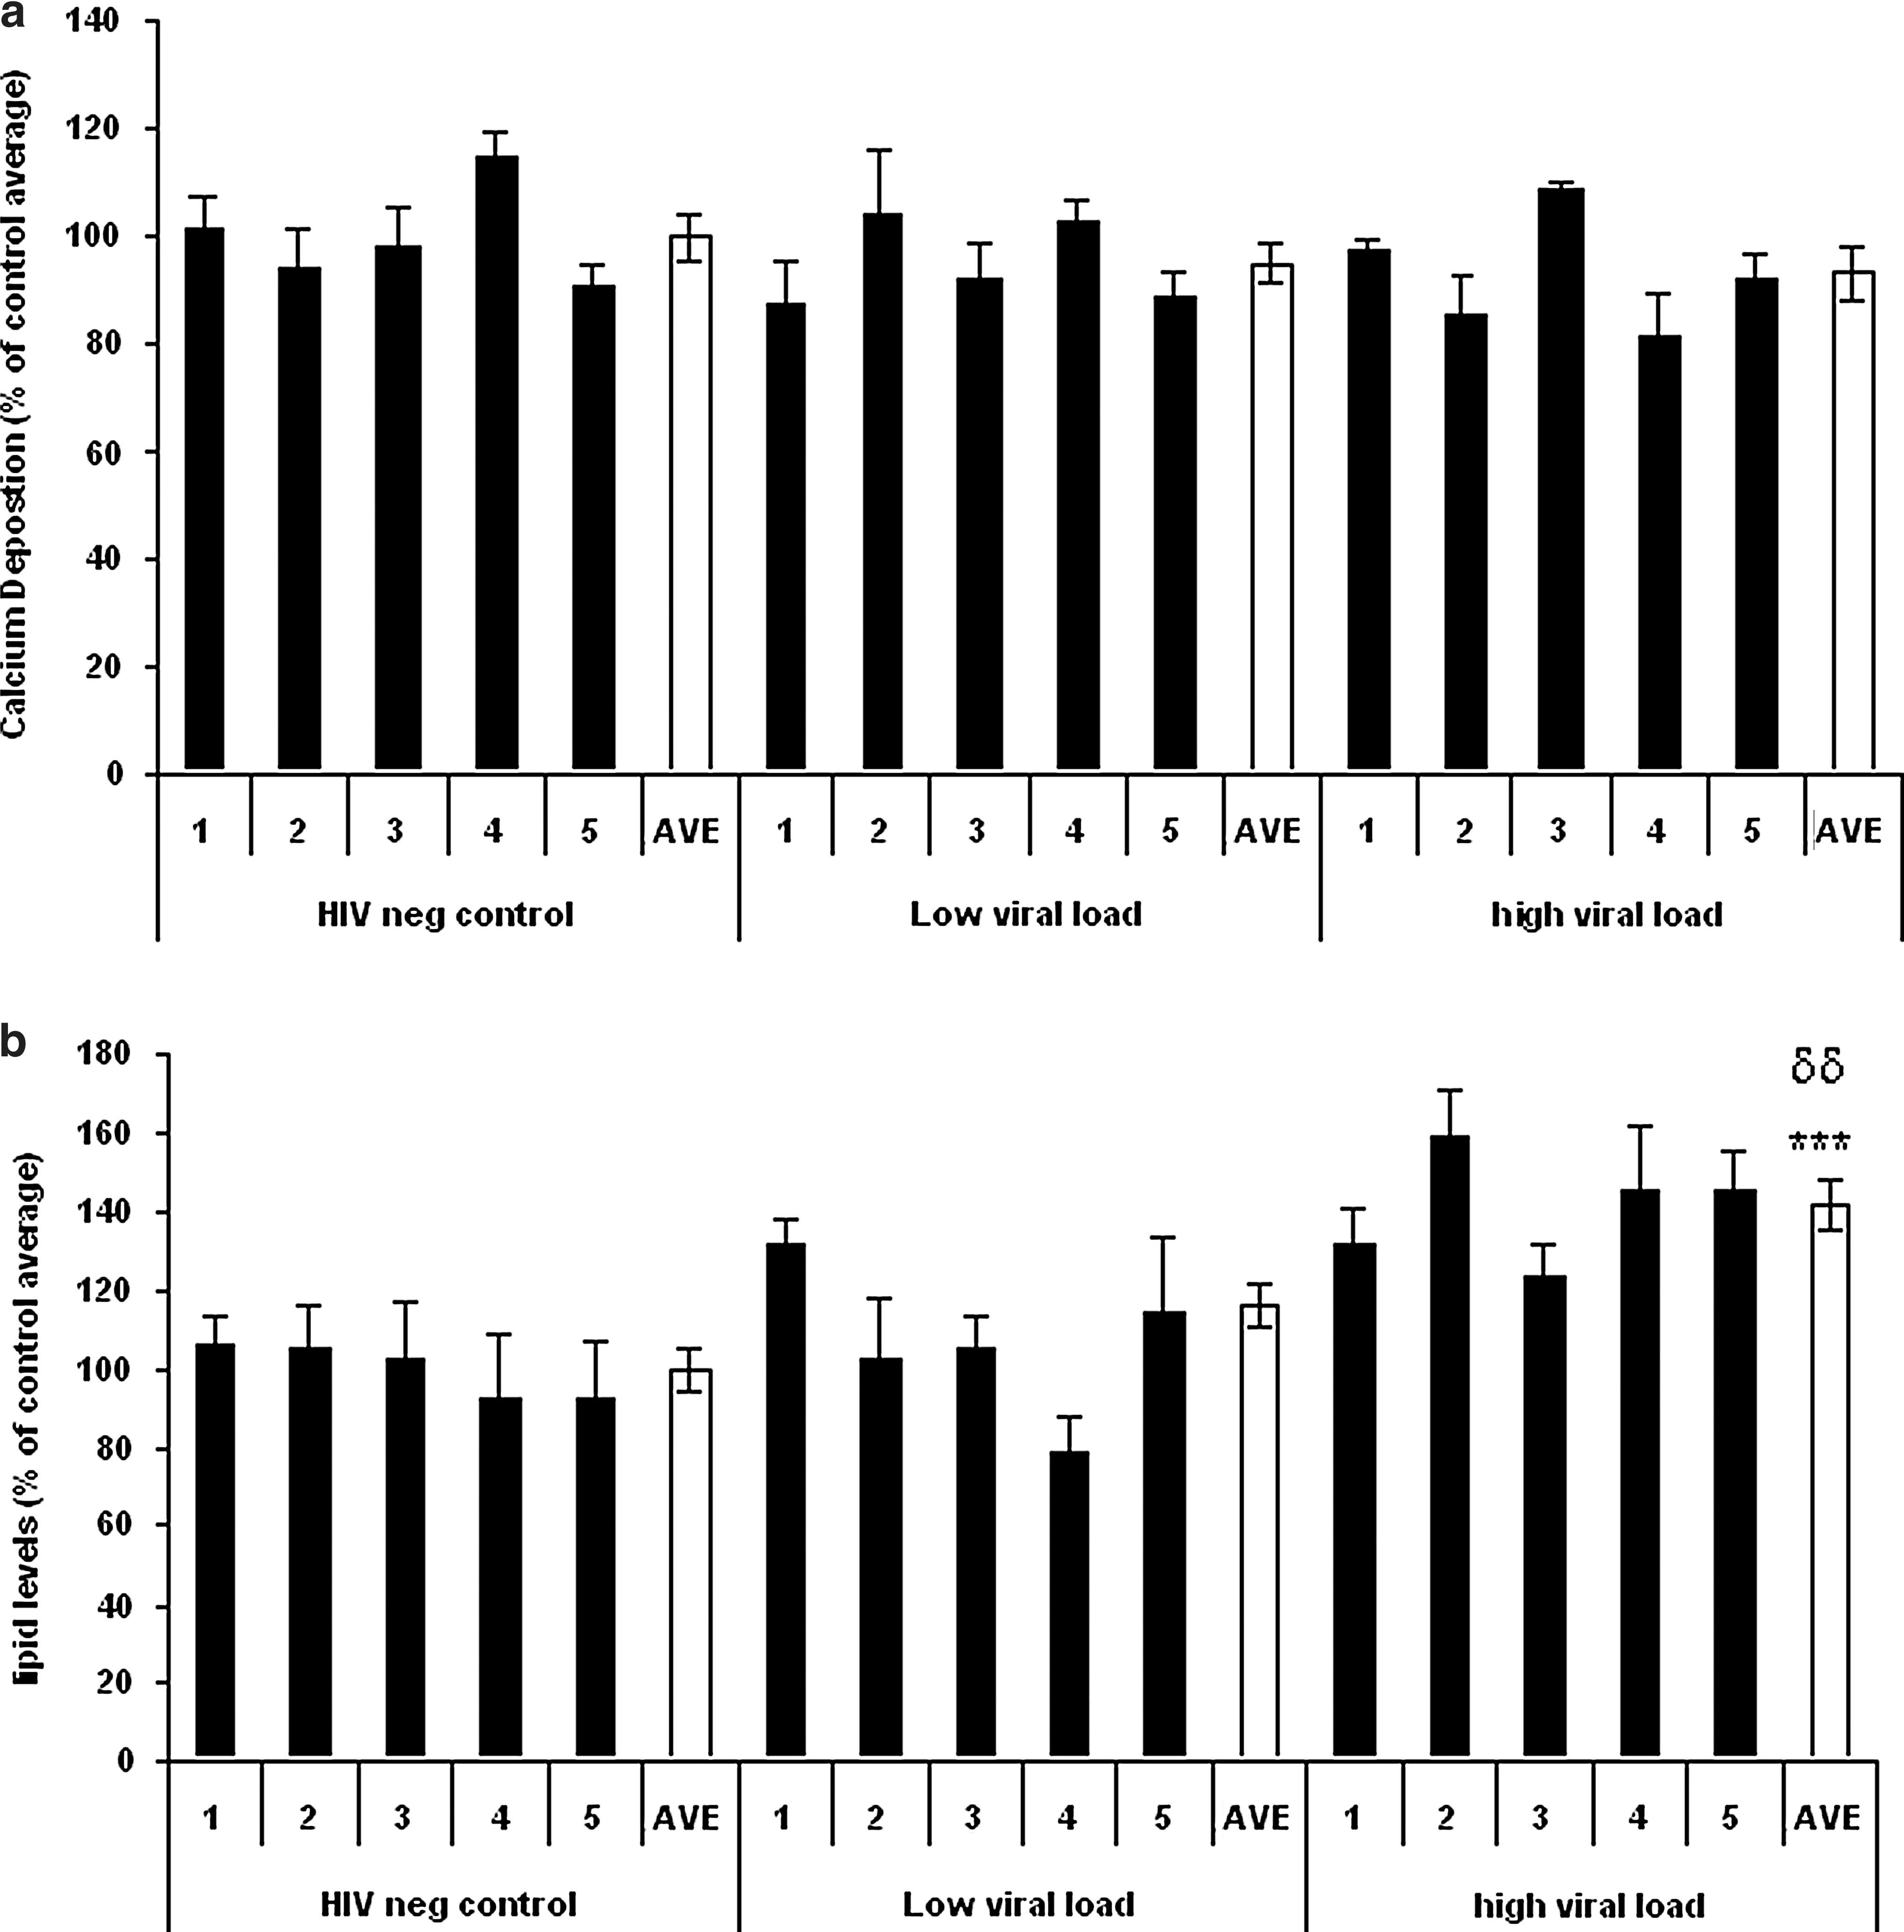
Effect of HIV-1-infected sera on MSC osteogenesis
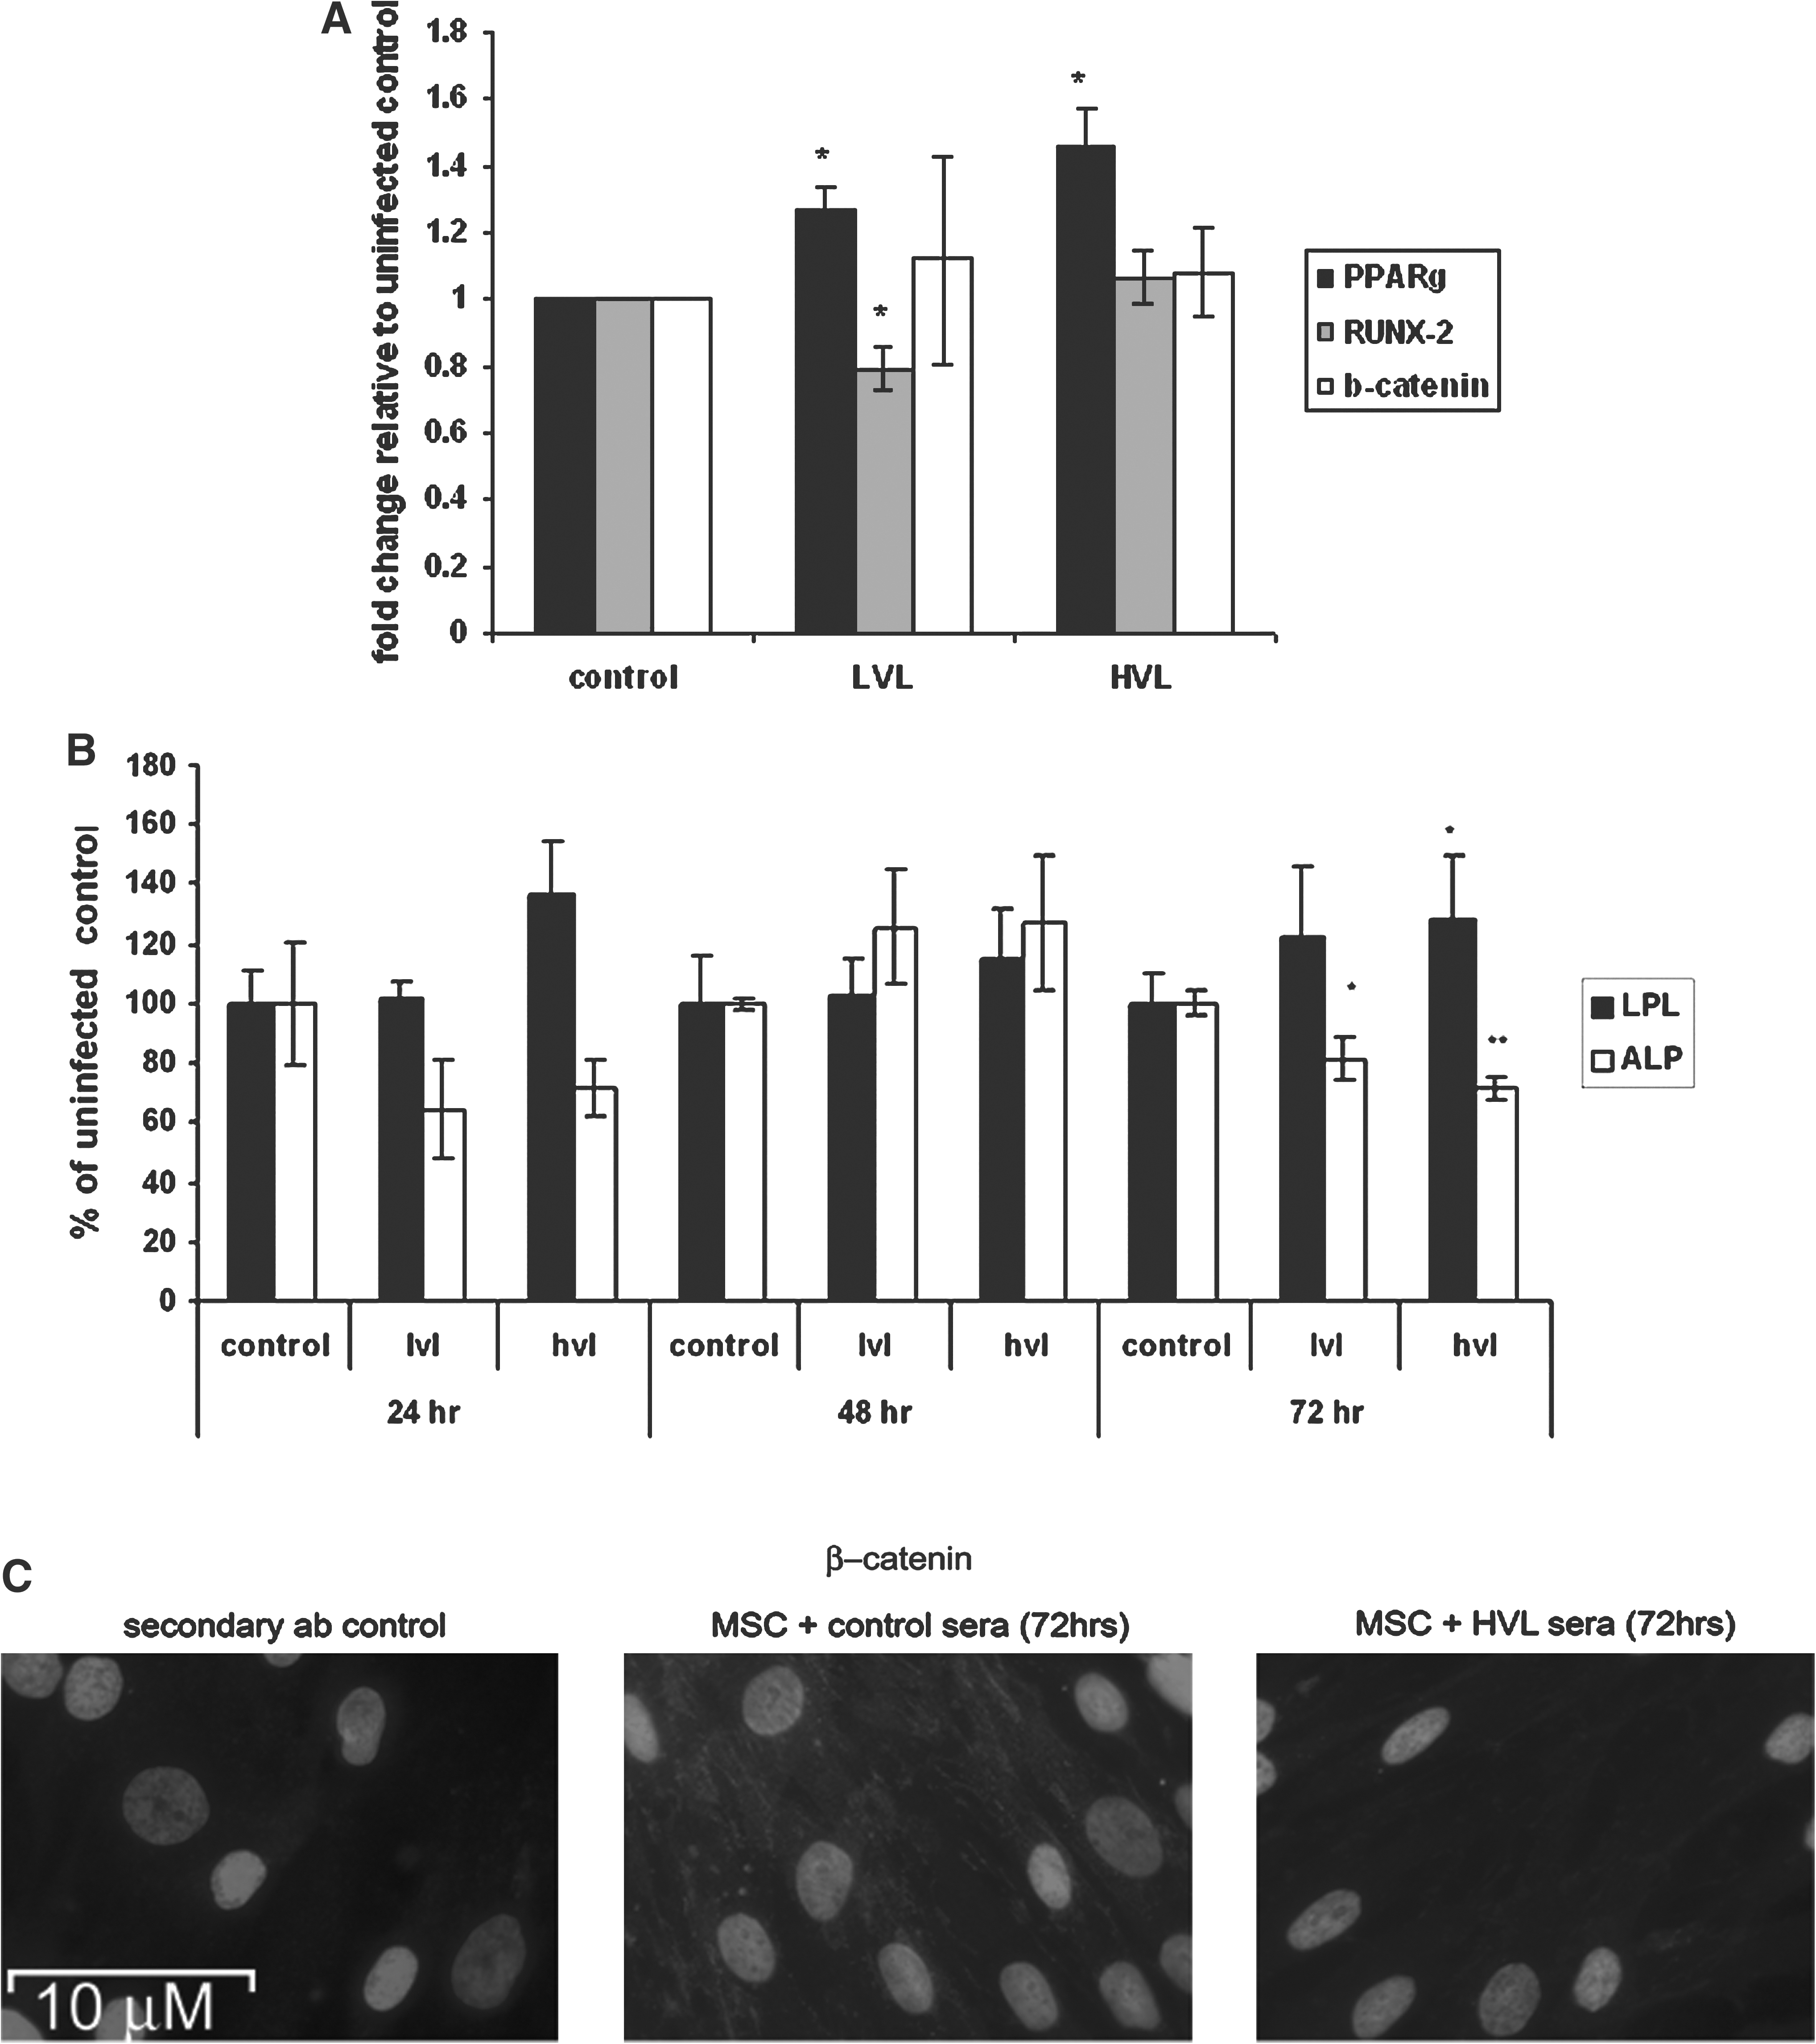
Short- and medium-term exposure to HVL sera induces proadipocyte changes in gene expression, protein levels, and enzyme activity. MSCs were exposed to serum from control, LVL, and HVL groups for 24–72 h. To assess short-term changes in gene expression cells were harvested after 24 h and the mRNA levels of peroxisome proliferator-activated receptors gamma (PPARγ), runt-related transcription factor-2 (RUNX-2), and beta-catenin (β-catenin) were determined using RT-PCR with gene-specific primers

Coincubation with pyridoxal 5-phosphate and zidovudine attenuates the effect of HVL sera on MSCs. MSCs were exposed to sera from control and HVL groups in the presence and absence of the CD-4 antagonist pyridoxal 5-phosphate (p5p) (45 μM) and the antiretroviral drug zidovudine (AZT) (5 nM) in both adipogenic (three cycles) and normal media (72 h). In cells cultured in adipogenic conditions the degree of adipogenesis was determined using quantitative Oil Red-O staining

An infection event putatively underscores the effect of HVL sera on MSCs. MSCs were exposed to sera from uninfected control and HVL donors in a variety of experimental paradigms.
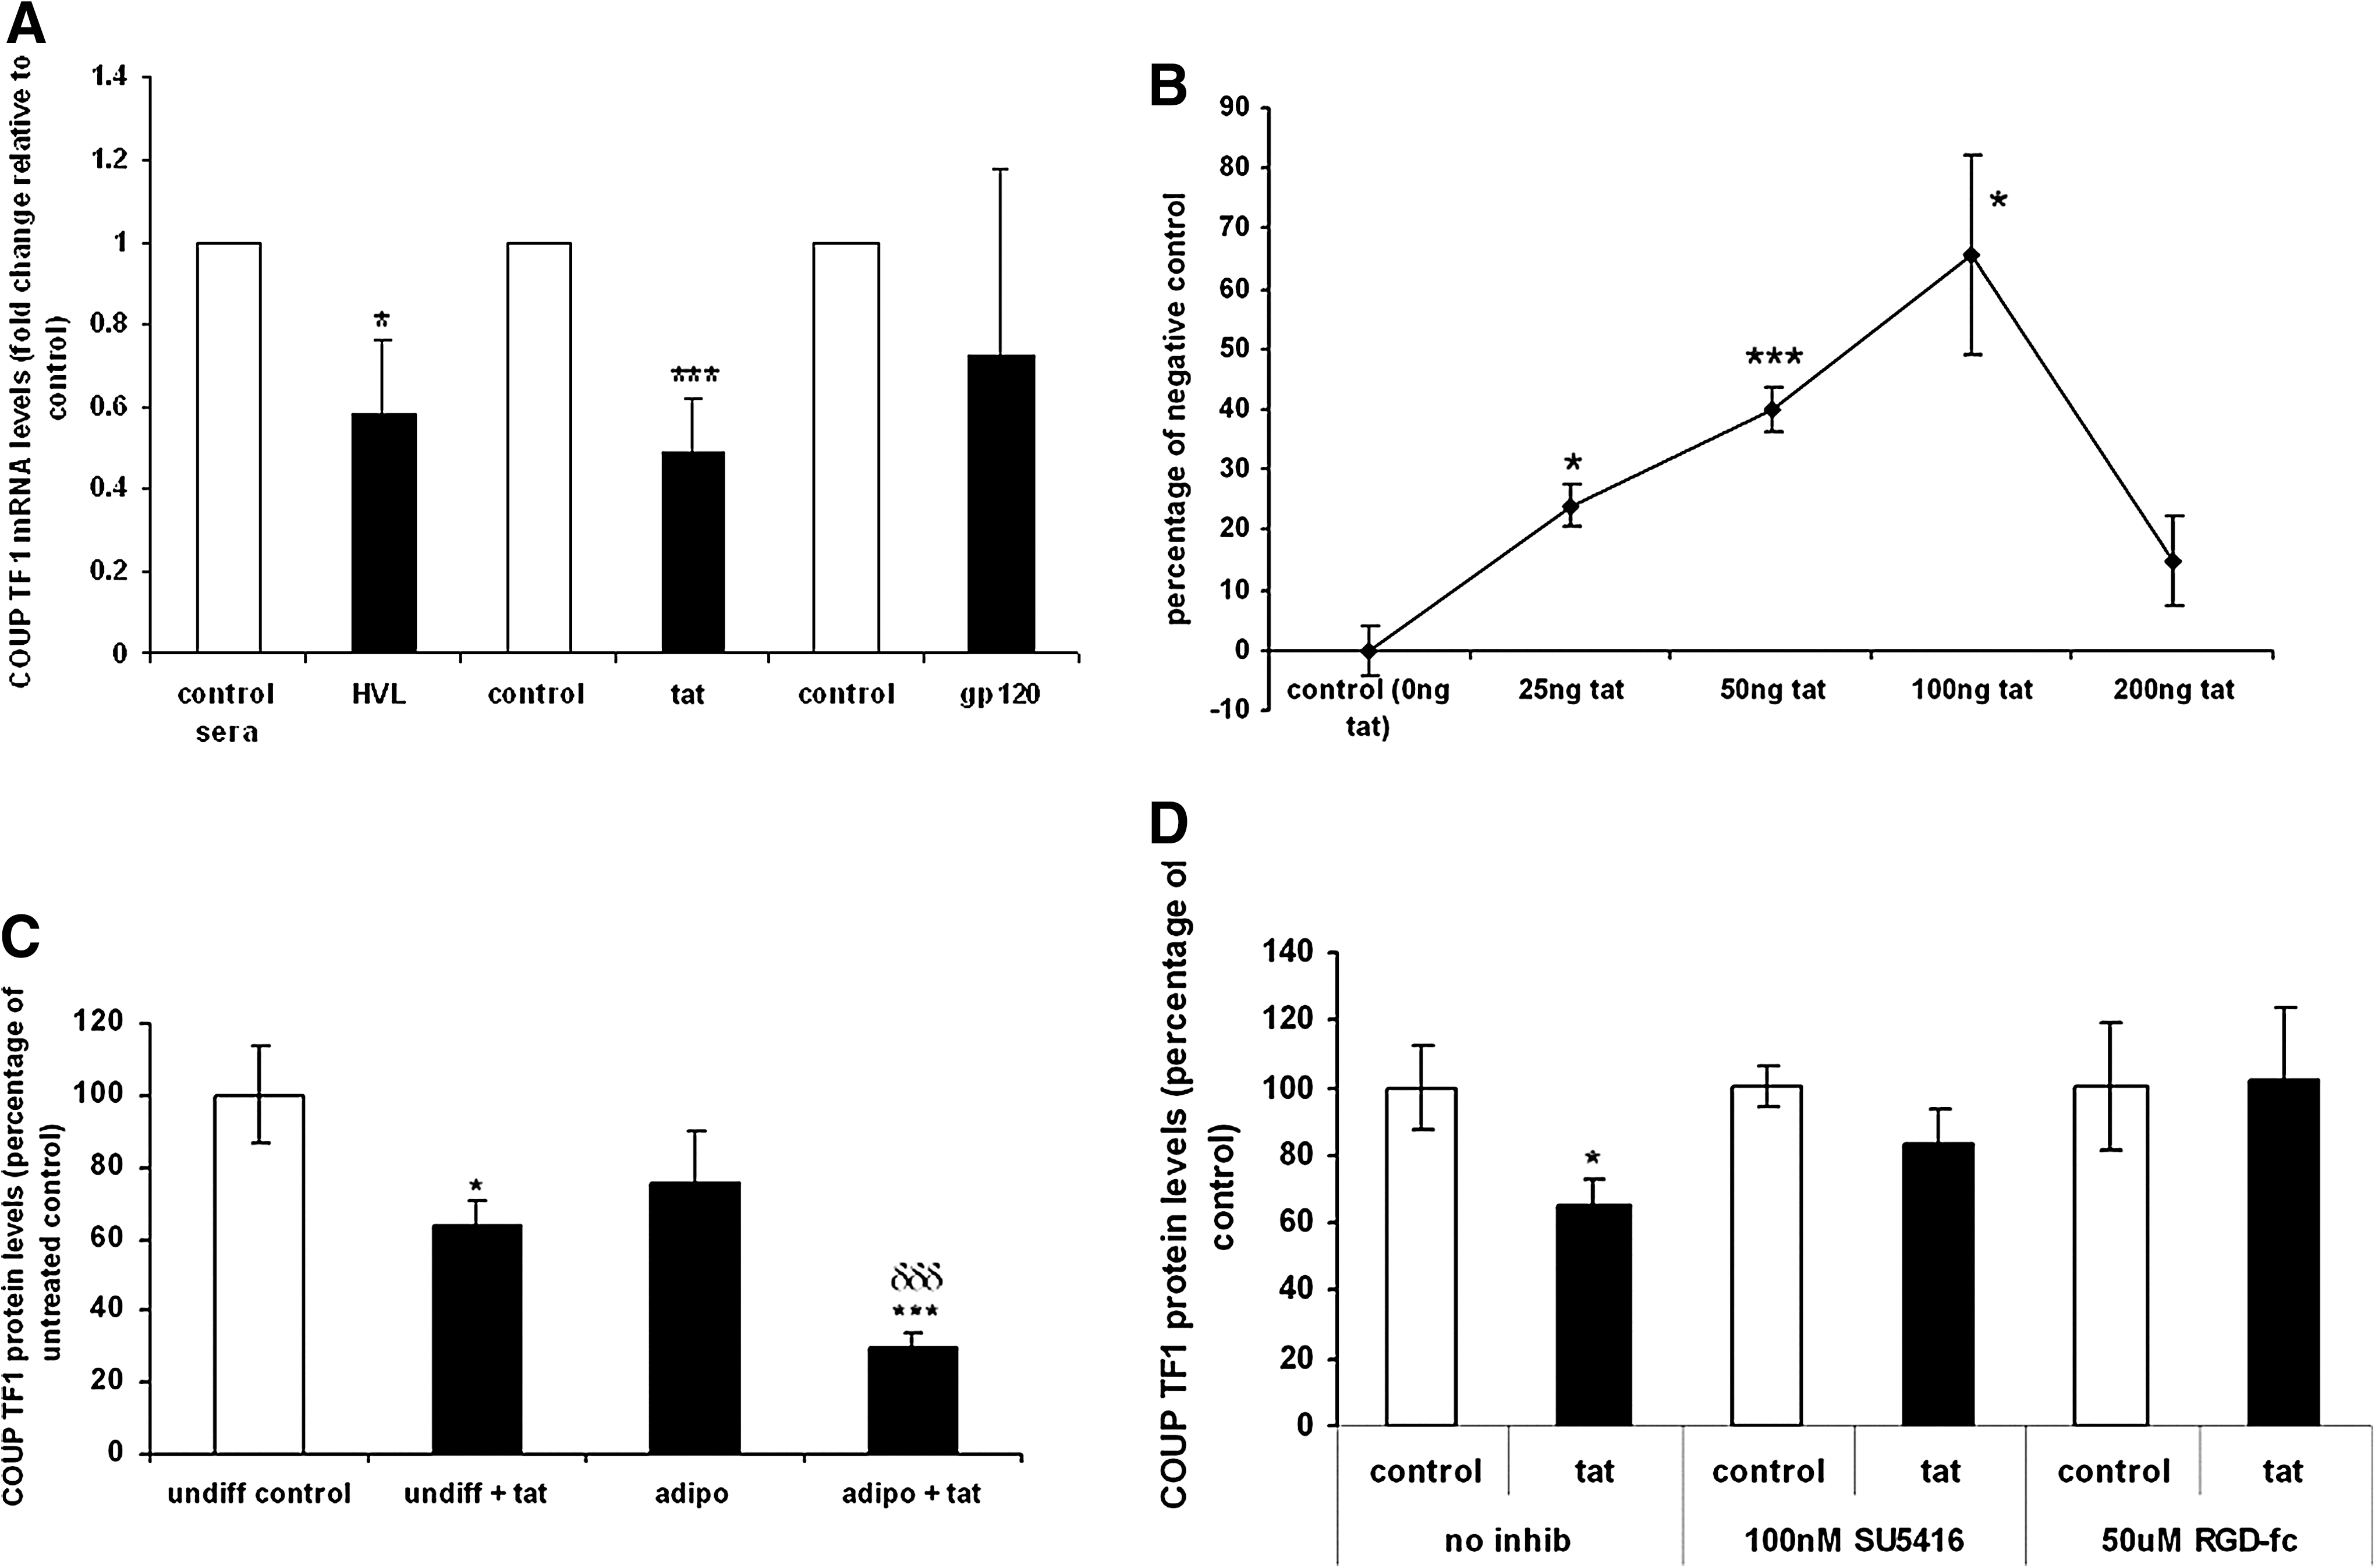
Tat/chicken ovalbumin upstream promoter transcription factor 1 (COUP TF1) interaction putatively underlies the proadipogenic phenotype observed. MSCs were exposed to sera from uninfected control/HVL donors and HIV-1 Tat and gp120 proteins in a variety of experimental paradigms.
Treatment with pyridoxal 5-phosphate (p5p), cyclic RGD peptide, SU5416, and AZT
Cells were incubated with 45 μM p5p (Sigma), 26 50 μM RGD-fc (Anaspec), 27 and 100 nM SU5416 (Sigma) 28,29 (to block the CD4 receptor, αvβ3 integrins, and the VEGFR2 receptor, respectively), or 5 nM zidovudine (AZT; obtained from the NIH AIDS Reagent Program).
HIV-1 proteins
Cells were treated with 100 ng/ml HIV gp120 and Tat proteins, a concentration previously determined to be representative of in vivo levels of HIV gp120 in untreated patients.
30
Viral proteins were obtained from the NIH AIDS Reagent Program (
MTS assay
Cell viability was assessed using the Promega CellTiter Kit in accordance with the manufacturer's instructions. Readings were normalized to cell number determined as described below.
Real time PCR
Total RNA was extracted as previously described by the TRI-reagent/chloroform method. 31 cDNA to the messenger RNA (mRNA) was then generated using reverse transcription with oligo(dT) (Sigma) primers and enhanced avian reverse transcriptase (eAMV, Sigma). The cDNA was then assayed in triplicate using a Rotorgene 3.0 Real Time PCR instrument (Corbet Research, Australia) and the Real Time PCR amplification kit SYBR Green I (Qiagen, UK). Using gene-specific primer pairs, RUNX-2, PPARγ, β−catenin, and CD-4 gene products were measured by absolute quantification and were reported as a function of crossing time (C t), the cycle number at which polymerase chain reaction (PCR) amplification becomes linear. mRNA expression was normalized to control and GAPDH expression resulting in mean fold change values or ΔΔC t. Following cycling, to ensure specificity, melt curve analysis was carried out to verify the amplification of PCR products starting at 65°C and ramping to 95°C at 0.1°C/s. One peak in the melt curve indicated that no secondary, nonspecific products were formed.
Primers
GAPDH For 5′ TTGATTTTGGAGGGATCCGRev 5′ GAGTCAACGGATTTGGTCGT
RUNX-2 For 5′ AGATGGGACTGTGGTTACTGRev 5′ GTAGCTACTTGGGGAGGATT
PPARγ For 5′ TGAATGTGAAGCCATTGAARev 5′ CTGCAGTAGCTGCACGTGTT
β-Catenin For 5′ GAAACGCTTTCAGTTGACCRev 5′ CTGGCCATATCCACCAGAGT
CD-4 For 5′ CACCACCAGGTTCACTTCCTRev 5′ CTAAGCTCCAGATGGGCAAG
COUP TF1 For 5′ AAAGCCATCGTGCTGTTCACRev 5′ TGCAGGCTCTCGATGTGG
Cell number determination
For experiments performed in 96-well plates (calcium deposition, alkaline phosphatase, lipid accumulation, and whole cell ELISAs), cell number determination was carried out using quantitative ponceau red/methylene green stainin. 23
After fixation cells were washed twice with phosphate-buffered saline (PBS) and allowed to air dry before being stained with ponceau red (100 μl per well, 10 min). Unstained wells containing similarly treated cells were included as blanks for each treatment. The cells were then washed twice with 200 μl PBS per well to remove excess stain, air dried, and destained [100 μl PBS per well, 10 min, agitation (100 rpm)]. The plate was then read at 540 nm, with a reference wavelength of 700 nm, and cell number per well was determined using a standard curve of cell number vs. OD540. Unstained wells containing similarly treated cells were included as blanks for each treatment.
For differentiation experiments, as increased production of proteinaceous extracellular matrix made cell number determination using protein staining inaccurate, DNA staining with 1% methylene green (dH2O) was used. Cells were stained/destained in a manner similar to ponceau red, and dye extracted was read at 600 nm, with cell number per well determined using an appropriate standard curve.
LPL/COUP TF-1 whole cell enzyme-linked immunosorbent assay (ELISA)
Whole cell ELISAs for LPL and COUP TF-1 were carried out using the methods previously described. 23
MSCs were cultured in 96-well plates and treated as described above. Following treatment cells were washed with PBS and fixed with 100 μl ice cold methanol per well. Cell number was determined as described above.
Following determination of cell number the cells were solubilized with 1% Triton-X/PBS for 5 min before being blocked in 100 μl PBS containing 10% bovine serum albumin (BSA) for 30 min. The cells were then treated with 100 μl of appropriate primary antibody dilution [rabbit anti-LPL (Santa Cruz): 1/100 and mouse anti-COUP TF-1 (Santa Cruz); 1/150 all dilutions in PBS/10% BSA] and incubated for 1 h at room temperature. Following incubation wells were washed three times with PBS containing 0.05% Tween and incubated with appropriate concentrations of horseradish peroxidase (HRP)-labeled secondary antibodies [antirabbit HRP (sigma): 1/200 and mouse anti-COUP TF-1 (Santa Cruz); 1/200 all dilutions in PBS/10% BSA]. Wells incubated with secondary antibody were included for each treatment as a control for nonspecific binding and to act as blanks. The optimum concentration of primary/secondary antibodies had been previously determined using concentration gradients.
Following incubation with secondary antibody, the wells were washed four times in PBS containing 0.05% Tween and allowed to air dry. SigmaFAST OPD was prepared as per the manufacturer's instructions and 100 μl of the solution was added to all wells. The plate was then covered and incubated at room temperature for 15 min. After incubation the reaction was stopped by the addition of 50 μl of 0.1 M acetic acid and the plates were read on a spectrometer at 450 nm with the correction wavelength of 600 nm. OD values for each well were zeroed by subtraction of the value of the appropriate secondary-only control and the zeroed value was normalized to cell number.
For primary antibodies, rabbit anti-LPL (Santa Cruz) used at a dilution of 1–100 was detected with HRP-labeled antirabbit IgG (Sigma, 1–200 working dilution) (Fig. 1B) and mouse anti-COUP TF-1 (Santa Cruz) at a dilution of 1–100 was detected with 1–250 HRP-labeled antimouse IgG (Sigma). Readings were normalized to cell number per well.
ALP assay
ALP activity was determined using the BCIP/NBT staining method adapted for 96-well plates described previously (Fig. 1C). 23
Cells were cultured in a 96-well plate and treated as described above. Cells were then washed in PBS and fixed with 100 μl ice-cold 1:1 ethanol:acetone for 10 min. After cell number determination (see below), cells were washed several times in PBS to remove any remaining stain and allowed to air dry. A SigmaFAST BCIP/NBT solution was prepared as per the manufacturer's instructions and 100 μl of stain solution was added to each well. The plate was then incubated for 30 min at 37°C. Unstained, similarly treated wells were also included as blanks. Following incubation, the remaining substrate solution was removed and the wells were washed three times with 100 μl PBS and allowed to air dry.
The degree of staining was quantitated spectrophotometrically; 100 μl 1% CPC was added to each well and the plates were incubated with agitation for 1 h (100 rpm). The plates were then read at 560 nm with a correction wavelength of 700 nm.
Alizarin red staining
Cells were cultured in a 96-well plate and treated as described above. Cells were then washed in PBS and fixed with 100 μl ice-cold methanol for 10 min. After cell number determination (see below), cells were washed several times in PBS to remove any remaining stain and allowed to air dry. Then 100 μl of 40 mM alizarin red (pH 4) solution was added to each well. The plate was then incubated for 10 min at room temperature. Unstained, similarly treated wells were also included as blanks. Following incubation, the remaining stain solution was removed and the wells were washed three times with 100 μl PBS and allowed to air dry. The plate was then scanned at 300 dpi using a standard flatbed scanner.
The degree of staining was quantitated spectrophotometrically; 100 μl 1% CPC was added to each well and the plates were incubated with agitation for 30 min (100 rpm). The plates were then read at 557 nm with a correction wavelength of 700 nm and alizarin red concentration was determined using a standard curve of concentration vs. OD557nm. Data were normalized to cell number per well.
Lipid staining
Lipid levels were assessed using a quantitative Oil Red-O protocol adapted for use in a 96-well plate format. Briefly, undifferentiated MSCs were cultured and treated as described above. Cells were then washed in PBS and fixed with 100 μl formalin (8%) for 10 min. After cell number determination (see above), cells were washed several times in PBS to remove any remaining stain and allowed to air dry. A stock solution of Oil Red-O (Sigma) was prepared (5 mg/ml 60% isopropanol). This was used to prepare a working solution of 3.3 mg/ml, which was then filtered. Then 100 μl of this solution was added to each well and left to stain for 15 min. Poststaining cells were washed (first wash 60% isopropanol, second wash PBS) and allowed to air dry before being destained with 80 μl 100% isopropanol (10 min). Again unstained wells containing similarly treated cells were included as blanks for each treatment. The plate was read at 530 nm, with a reference wavelength of 700 nm, and the Oil Red-O concentration was determined using a standard curve of concentration vs. OD530. Data were normalized to cell number per well. In undifferentiated MSCs, levels of lipid staining were modest, the staining being visible to the naked eye, but differences being undeterminable.
Immunocytochemistry
Cells were cultured and treated in chamber slides. Posttreatment cells were washed in PBS before being fixed in methanol:acetone (1:1). After the fixed cells were solubilized in 1% Triton-X (5 min) to allow staining of the entire cell contents (β-catenin), in the case of CD-4, the solubilization step was not carried out. Cells were then blocked for 30 min in 10% BSA and incubated for 1 h with the primary antibody of interest as follows: anti-β-catenin (mouse, Santa Cruz) 1/100, anti-CD-4 (mouse, Abcam) 1/100, anti-CXCR4 (mouse, Abcam) 1/50, and anti-CCR5 (mouse, Santa Cruz) 1/50. Preparations were then washed in 0.05% PBS/Tween buffer and incubated with an antimouse FITC-labeled antibody (Sigma) for 1 h. Cells were incubated with secondary antibody alone to control for nonspecific staining. Postsecondary incubation cells were again washed with PBS/Tween. Cells were also conterstained with the nuclear specific DAPI stain. After staining, preparations were mounted and photographed using an Olympus fluorescent microscope equipped with appropriate fluorescent filters. Micrographs of FITC and DAPI staining were overlayed using photoshop (FITC on DAPI, FITC opacity reduced to 61%).
Alu-PCR and gel electrophoresis
MSCs were treated as appropriate and then harvested for genomic DNA using the Tri-Reagent protocol (Ambion). Genomic DNA was extracted from whole blood collected from HIV-1-infected patients using the Quiagen DNA midi preps kit.
DNA was analyzed using two-step PCR with a starting concentration of 0.4 μg DNA using the method described by O'Doherty et al. 32
After amplification products were analyzed using agarose gel electrophoresis (2% agarose gel, 70 V, 1.5 h) and stained in a 10 μg/ml ethidium bromide (Sigma) solution for 40 min. Gel was then photographed using a UV transilluminator. Gel photographs were edited using photoshop and inverted to aid visualization. A clear band at 100 bp was considered evidence of HIV-1 integration.
TAT/COUP TF1 interaction assay
To detect the intercellular interaction of COUP TF1 and the HIV-1 Tat protein an interaction ELISA technique was developed. Briefly, 96 wells were coated by incubation with mouse anti-COUP TF1 (Abcam) (1–250 dilution in PBS, 100 μl per well) at 4°C overnight. Plates were then blocked using 10% BSA (Sigma) for 30 min. Plates were then incubated for a further 2 h with cell lysates [collected using Celllytic lysis buffer (Sigma)] from MSC treated with varying concentrations of Tat (1/10 dilution in PBS). Plates were then washed four times with 0.05% PBS/Tween to remove any loosely associated protein. They were then incubated with rabbit anti-Tat (Abcam, 1/200) for a further 1 h and washed four times in PBS/Tween. The plates were finally incubated with 1/400 antirabbit HRP (Sigma) and again washed four times with PBS/Tween. Bound HRP secondary antibody was detected colorimetrically using SigmaFAST OPD (Sigma) and quantified using spectrophotometry (450 nm). Cell lysate-free wells were included to act as blanks for the assay. Readings were normalized to lysate total protein concentrations determined using the Bradford method, and all samples were assayed in triplicate.
Statistical analysis
Statistical analysis was performed using the Student's unpaired t-test with significance determined at *p ≤ 0.05, **p ≤ 0.01, and ***p ≤ 0.005 relative to untreated control and δ p ≤ 0.05, δδ p ≤ 0.01, and δδδ p ≤ 0.00 relative to treated control.
Results
Exposure to HIV-1 patient sera alters MSC differentiation, cell phenotype, and gene expression in a viral load-specific manner
Serum was collected from uninfected donors and HIV-1-infected donors with high (HVL 100,000–150,000) and low (LVL 200–4000) viral load, respectively. This serum was used to treat human OBs in culture. A 5% v/v serum concentration was determined to be the optimum concentration as it did not significantly affect cell viability or number (Fig. 1A). MSCs were also characterized as expressing the cytokine receptors CD4 and CXCR4 using immunocytochemistry. Some staining was also observed for the CCR5 receptor, although this was very faint (Fig. 1D), suggesting that MSCs do not express CCR5 as abundantly as CXCR4/CD4.
To determine if HIV-1 could affect MSC function ex vivo, MSCs were incubated with sera from each group [uninfected control, low viral load (LVL), and high viral load (HVL)] and chemically induced to differentiate into either OBs or ACs. The degree of osteogenic/adipogenic differentiation was determined by assaying calcium deposition and lipid levels, respectively.
No significant affect on osteogenesis was observed in response to either LVL or HVL serum, although a small, statistically insignificant decrease was observed in cells treated with HVL (<10%) (Fig. 2a). In contrast, HVL sera significantly increased adipogenesis, both relative to uninfected control and LVL sera-treated cells (41.8 ± 6.2% and 38.7 ± 5.5%, respectively, p ≤ 0.05, n = 5, Fig. 2b).
Given the effect of HVL serum on chemically induced differentiation, its effect on cycling MSC gene expression and phenotype was determined. Cells were exposed to sera from each group over a 72-h time period and RUNX-2, PPARγ, and β-catenin mRNA expression and lipoprotein lipase (LPL) and alkaline phosphatase (ALP) levels were determined, respectively, at 24 h, 48 h, and 72 h time points.
Serum from both LVL and HVL increased PPARγ expression in MSCs relative to control serum (26.5 ± 7.4% and 45.5 ± 12.5%, p ≤ 0.05, respectively, n = 3) (Fig. 3A). No significant changes in RUNX-2 or β-catenin mRNA levels were observed in response to treatment with HVL serum; however, treatment with LVL serum induced a statistically significant decrease (20.8 ± 6.4%, p ≤ 0.05, n = 3) (Fig. 3A).
In MSCs exposed chronically to sera, both LVL and HVL sera significantly reduced ALP activity relative to control serum after 72 h treatment (28.5 ± 7.1% and 38.7 ± 3.6%, respectively, p ≤ 0.05). In addition, HVL sera also significantly increased LPL protein levels after 72 h, inducing an increase of 27.9 ± 20% relative to control (p ≤ 0.05, n = 4). Levels of β-catenin protein were also examined using immunocytochemistry, with a clear decrease in cytoplasmic and nuclear staining being observed in MSCs treated with HVL sera for 72 h (Fig. 3B and C).
The effects of HVL sera on MSC differentiation and phenotype is attenuated by antiretroviral drugs and CD-4 blockade
To delineate the mechanism by which HVL sera exerts a proadipogenic effect on MSCs, cells were incubated with sera from both HVL and control groups in the presence and absence of the CD-4 antagonist p5p and the nucleoside reverse transcriptase inhibitor (NRTI) zidovudine (AZT). Both AZT and p5p significantly attenuated the effect of HVL sera on induced MSC adipogenesis (Fig. 4A, >20%, p ≤ 0.05, n = 4). In nondifferentiating MSCs, p5p attenuated the HVL-induced increase in LPL levels (but not the reduction in ALP activity), while coincubation with AZT significantly attenuated the effects on both LPL levels and ALP activity (p ≤ 0.05, n = 4) (Fig. 4B).
The HIV-1 proteins gp120 and tat, which are shed from HIV-1-infected cells, are known to contribute to HIV-1 effects in a number of tissues. We examined their effects on both MSC adipogenesis and undifferentiated MSC phenotype. Both HIV-1 gp120 and tat increased the degree of adipogenesis, tat significantly so (p ≤ 0.01, n = 4), while both proteins significantly reduced ALP expression in undifferentiated cells (p ≤ 0.05, n = 4) (Fig. 4C and D).
An infection/integration event underscores the effect of HVL sera on MSC differentiation and phenotype
Having determined that the effects of HVL on MSCs can be (in part) attenuated by compounds that prevent HIV-1 interacting or infecting MSCs (the CD-4 antagonist p5p and the NRTI AZT, respectively), we considered the possibility that HIV-1 infection and integration contributed to the observed phenomena.
Short-term exposure to HVL sera did not alter CD-4 mRNA levels (Fig. 5A); however, in cells exposed to HVL for 72 h there was a clear increase in extracellular CD-4, as detected using immunocytochemistry (Fig. 5B).
“Washout” experiments were also carried out in which the cells were preincubated with HVL or control sera (72 h), washed thoroughly with PBS, and then cultured in normal (2 weeks) or adipogenic media (three cycles). In these experiments, preexposure to HIV-1-infected sera was sufficient to induce a proadipogenic response (Fig. 5C and D, p ≤ 0.05, n = 4). These data reinforce the hypothesis that an infection event may underscore the effect.
To directly detect HIV-1 integrated in the MSC genome, a nested, two-step, PCR strategy was employed. Briefly, this technique utilizes nested primer pairs; in the first PCR reaction primers that amplify regions of varying length between genomic Alu repeats and the HIV-1 gag gene are used, whereas the second amplifies a specific 100-bp region of the HIV-1 genome. In addition to DNA from cells treated with either control or HVL sera (n = 3), DNA extracted from blood collected from HIV-1-infected patients (n = 3) and DNA extracted from MSC unexposed to either control or HVL sera were included as positive and negative controls, respectively. A clear 100-bp product was observed in both the patient DNA and DNA extracted from HVL-treated MSCs, suggesting HIV-1 integration into the host genome (Fig. 5E).
Given the apparent infection of MSCs by HIV-1 contained in the HVL sera, we examined whether this infection was productive or latent. An ELISA for HIV-p24 was carried out on supernatants collected at time points from the washout experiments described above, but no p24 secretion was detected in any sample (data not shown). In addition, the HIV Rev protein (the first protein translated from the HIV-1 genome) was detected using immunocytochemistry in cells exposed to HVL sera for 72 h, but no staining was observed for other HIV proteins. These data suggest latent infection of MSCs by HIV-1.
Tat/chicken ovalbumin upstream promoter transcription factor 1 (COUP TF1) interaction underlies the proadipogenic phenotype driven by HIV-1
To discern the molecular signals underscoring the observed phenomena, we examined the role of chicken ovalbumin upstream promoter transcription factor 1 (COUP TF1) in HVL-induced adipogenesis. Both treatment with HVL sera and 100 ng Tat (24 h) significantly reduced COUP TF1 mRNA expression (>30%, n = 3, p ≤ 0.05), whereas gp120 had no significant effect (Fig. 6A). In an experiment to determine the intercellular interaction between COUP TF1 and Tat, MSCs were treated with varying concentrations of Tat (0–200 ng/ml, 24 h) and the degree of COUP TF1/Tat interaction was determined using an ELISA technique. A COUP TF-1/Tat interaction was detected and was shown to be dose dependent, with maximum interaction at 100 ng Tat (Fig. 6B). Treatment of MSCs with Tat (100 ng/ml, 72 h) was also seen to significantly reduce COUP TF-1 protein levels (>30%, n = 4, p ≤ 0.05), whereas addition of Tat to MSCs incubated in adipogenic conditions (72 h) also significantly potentiated the decrease in COUP TF1 induced by the adipogenic stimulus (n = 4, p ≤ 0.001) (Fig. 6C).
Finally, to determine the mechanism of Tat/MSC extracellular interaction, MSCs were treated with Tat (100 ng/ml, 72 h) in the presence and absence of 100 nM SU5416 and 50 μM RGD-fc [antagonists of vascular endothelial growth factor receptor 2 (VEGFR2) and alphaV-beta3 (αvβ3) integrins, respectively 26 –29 ]. Both antagonists attenuated the effects of Tat treatment on COUP TF1 protein levels in MSCs (Fig. 6D).
Discussion
In this study we present data that demonstrate an effect of HIV-1 on mesenchymal precursors using an ex vivo experimental model (Fig. 7). Increasingly, reduced bone mass has become a recognized complication of HIV-1 disease, and disorders of the lipid metabolism have been long associated with HIV-1 treatment. 1 –4 The data from these experiments suggest that HIV-1 may directly disrupt the formation of bone and fat tissue from precursors.

Putative mechanism of HIV-1/MSC interaction.
In our initial experiments we focused on the effect of sera from HIV-1-infected individuals on the osteogenic and adipogenic potential of MSCs. Interestingly, neither LVL nor HVL sera significantly altered chemically induced osteoblastogenesis from MSCs, although a slight decrease was observed with HVL sera (Fig. 2a). In contrast, adipogenesis was significantly elevated by both LVL and HVL serum, in a dose-dependent manner, given that adipogenesis in HVL-treated cells is also significantly greater than that observed with LVL-treated cells (Fig. 2b). This observed proadipogenic effect of serum from HIV-1-infected donors was also evidenced by the finding of induction of expression of markers of adipogenic differentiation (increased PPARγ expression/LPL levels, decreased β-catenin staining) in cells in the absence of other adipogenic stimuli (Fig. 3A and B).
Intriguingly, p5p and AZT (compounds preventing binding to the CD4 receptor and the integration of HIV-1 DNA into the host genome) attenuated the effects of HVL on induced adipogenesis and (in part) resting cell phenotype, suggesting that an infection event may underlie the effect on MSCs (Fig. 4). Treatment with the HIV-1 proteins gp120 and Tat (known to be shed by infected cells and to have varying effects in a number of cell and tissue types 22,25,30 ) also induced changes in MSC differentiation and phenotype, with Tat significantly increasing adipogenesis (Fig. 4C and D). Although HIV-1 productive infection of MSCs has been demonstrated in vitro, their infection in vivo, or indeed ex vivo, has not been demonstrated. 22 However, human MSCs express the receptors necessary for HIV-1 infection, and the possibility that they may be infected in vivo has been considered.
To further understand the cell–virus interaction in this setting, we determined whether HVL serum was capable of productively infecting MSCs. We found that extracellular staining for the CD-4 receptor increased after exposure to HVL serum for 72 h. Although CD4 levels in HIV-1-infected cells are known to decrease over time, given the short-term nature of our exposures, this finding is suggestive of it being bound by gp120 and activated (Fig. 5B). Also in “washout” experiments (where cells were pretreated with HVL and control sera for 72 h before being washed and cultured in adipogenic and normal conditions), the effect of HVL sera exposure persisted (albeit to a lesser if still significant degree) even after the complete removal of exogenous sera (Fig. 5C and D). Although these findings could be indicative of exposure to HIV-1 viral particles/proteins having a long lasting “reprogramming” effect on the MSCs, they are also suggestive of an infection event.
This suggestion was further clarified using an Alu-PCR assay specific for HIV-1 interaction, although this assay produced a significant amount of nonspecific product (possibly due to the low annealing temperatures used in both the preamplification and amplification steps), there is a clear 100-bp band present in both the positive control (DNA extracted from the blood of HIV-1-infected patients) and HVL treated MSC lanes (Fig. 4E). Again this finding lends weight to the hypothesis of HIV-1 infection of MSCs. Finally we conducted experiments to determine if there was productive infection of MSCs on exposure to HVL sera; we detected no secretion of HIV-p24 (at time points up to a week) or no detectable levels of the Tat protein (after 72 h exposure). However, there was clear staining for the Rev protein (Fig. 5F). This finding is interesting; in the processes of HIV-1 transcription translation of the Rev protein precedes transcription of all other HIV-1 proteins, including Tat and p24; in our case the presence of Rev with the absence of other HIV-1 proteins suggests that the any infection remains in a latent phase. 33,34
Finally, given that the HIV-1 Tat protein played a role in the induction of a proadipogenic phenotype (see Fig. 4), we investigated the molecular mechanism by which it may be exerting its effects. Scheideler et al. have used microarray analysis to identify a number of genes differentially regulated in the early stages of adipogenesis/osteogenesis. 35 Chicken ovalbumin upstream promoter transcription factor 1 (COUP TF1) was of particular potential interest. This gene, which was found to be upregulated in MSCs undergoing osteogenesis and downregulated in adipogenic MSCs, produces a protein known to regulate HIV-1 gene expression through a Tat interaction. 36 The closely related COUP TFII is a regulator of HIV-1 gene expression and also negatively regulates adipogenesis through inhibition of PPARγ. 37 We found that both HVL sera and Tat significantly downregulated COUP-TF1 expression in MSCs, whereas treatment with gp120 did not. We also determined, using an ELISA method, that COUP TF1 and Tat were interacting intercellularly in MSCs treated with exogenously added Tat. Addition of Tat was also seen to increase the reduction in COUP TF-1 protein in the early stages of adipogenesis. Finally, blockade of both αvβ3 and VEGFR2 (both extracellular targets for Tat 38,39 ) was seen to attenuate the Tat-mediated reduction of COUP TF1 protein. These data suggest that Tat added exogenously and perhaps produced intercellularly is capable of interacting with and inhibiting transcription of COUP TF1 with a net proadipogenic effect. However, further studies are necessary to determine the intricacies of this effect.
Taken together, our data suggest a model in which MSC function can be altered both by exposure to and infection by HIV-1, the combined effects leading to a changed clonogenic potential and altered cell phenotype, which in our experiments were directed to a “proadipogenic” phenotype.
It is interesting to speculate on the potential in vivo impact of the phenomena described herein; increased adipogenic potential of MSCs in HIV-1 infection may not lead directly to increased fat mass, but potentially may reduce the availability of OB precursors. Indeed, it is likely (given existing clinical knowledge) that exposure to HIV-1 impairs the normal function of MSCs; for example, in conjunction with the reported increased incidence of fracture in the HIV-1-infected population, HH management of fractures in HIV-1-infected individual has been shown to be complicated by poor regrowth of bone, suggesting reduced functional regenerative OB precursors. 40,41
Our findings add to the growing understanding of HIV-1 pathogenesis and complications. However, further ex vivo and clinical studies are necessary to fully explore this area.
Author Disclosure Statement
No competing financial interests exist.