




Abstract
The IgG capture BED enzyme immunoassay (BED-CEIA) was developed to detect recent HIV-1 infection for the estimation of HIV-1 incidence from cross-sectional specimens. The mean time interval between seroconversion and reaching a specified assay cutoff value [referred to here as the mean recency period (ω)], an important parameter for incidence estimation, is determined for some HIV-1 subtypes, but testing in more cohorts and new statistical methods suggest the need for a revised estimation of ω in different subtypes. A total of 2927 longitudinal specimens from 756 persons with incident HIV infections who had been enrolled in 17 cohort studies was tested by the BED-CEIA. The ω was determined using two statistical approaches: (1) linear mixed effects regression (ω1) and (2) a nonparametric survival method (ω2). Recency periods varied among individuals and by population. At an OD-n cutoff of 0.8, ω1 was 176 days (95% CL 164–188 days) whereas ω2 was 162 days (95% CL 152–172 days) when using a comparable subset of specimens (13 cohorts). When method 2 was applied to all available data (17 cohorts), ω2 ranged from 127 days (Thai AE) to 236 days (subtypes AG, AD) with an overall ω2 of 197 days (95% CL 173–220). About 70% of individuals reached a threshold OD-n of 0.8 by 197 days (mean ω) and 95% of people reached 0.8 OD-n by 480 days. The determination of ω with more data and new methodology suggests that ω of the BED-CEIA varies between different subtypes and/or populations. These estimates for ω may affect incidence estimates in various studies.
Introduction
M
The IgG capture BED enzyme immunoassay (BED-CEIA) was developed to address some of the issues raised by the 3A11-LS assay and includes a peptide with divergent sequences from the immunodominant region of the transmembrane protein, gp41. 4 The three divergent sequences included in the BED peptide represent sequences from all major subtypes and recombinants from the Los Alamos database. 17 The assay was shown to have similar ω values in divergent subtypes B and AE from Thailand, thus demonstrating that the basic premise of using this approach is valid. 4 We present here results from BED testing of several seroconverter cohorts to determine the subtype-specific ω values and overall ω, irrespective of subtype.
This article also details two approaches used to estimate ω and evaluates the distribution of ω, which may provide information about variations among individuals and/or subtypes.
Materials and Methods
Specimens/cohort description
Longitudinal specimens from individuals infected with HIV-1 were collected as part of various cohort studies in different locales by different investigators. The specimens from consenting individuals were made available to permit development and characterization of new incidence assays, including the BED assay. Some of the basic information about the cohorts, including source, number of seroconverters, available specimens, and likely or confirmed HIV-1 subtypes, are shown in Table 1. The following cohort or other specimen sets were included: HIVnet = HIV network for prevention trials 18 ; Vax003 19 and Vax004 20 ; multicenter AIDS cohort study (MACS) 21 ; Amsterdam cohort 22 ; CIDUS = CDC injecting drug users study 23 ; BMA = Bangkok Metropolitan Administration IDU cohort 24 ; Ivory Coast and Uganda 25 ; REACH (Recruiting Acute Cases of HIV) cohort from Nigeria; Kenya 26 ; and incident infections from CDC's Hospital Infection Program.
See Materials and Methods section for additional information.
All subjects must have one or more observations within 365 days of last negative test. Further restrictions for implementation of the mixed effects regression analysis include the following: (1) span of observations (days since first positive test) ≥60 days (must have 2+ observations to compute span); (2) observations are within 1095 days (3 years) of last negative test; (3) subjects must have ≥3 longitudinal observations; (4) subjects with resultant negative slope are excluded.
The totals do not equal the sum from cohort numbers of subjects and specimens because the Vax003 data include observations from specimens that were untypable.
We also included 67 specimens from 22 commercially available seroconversion panels [Boston Biomedical Inc. (BBI), Waltham, MA and North American Biologicals Inc. (NABI), Miami, FL], which typically cover bleeds that are closely spaced and have better precision of seroconversion time due to short intervals between last negative and first positive specimens. Specimens in these panels provide critical information about the early dynamics of antibody development that otherwise cannot be deduced from cohort specimens. Because early antiretroviral therapy can affect the development of the antibody response against HIV, only specimens from persons who had not received therapy were used.
BED-capture enzyme immunoassay
The assay was performed as described in detail previously. 4,27 All specimens were tested independently on two separate runs to generate duplicate values, instead of running duplicate specimens on the same plate, to ensure interrun variability is taken into account. OD-n (normalized OD) for each value was calculated by using a calibrator specimen tested with each run. Controls and calibrator specimens were run in triplicate. All the testing was done blinded to ensure nonbias.
Determination of recency period (ω)
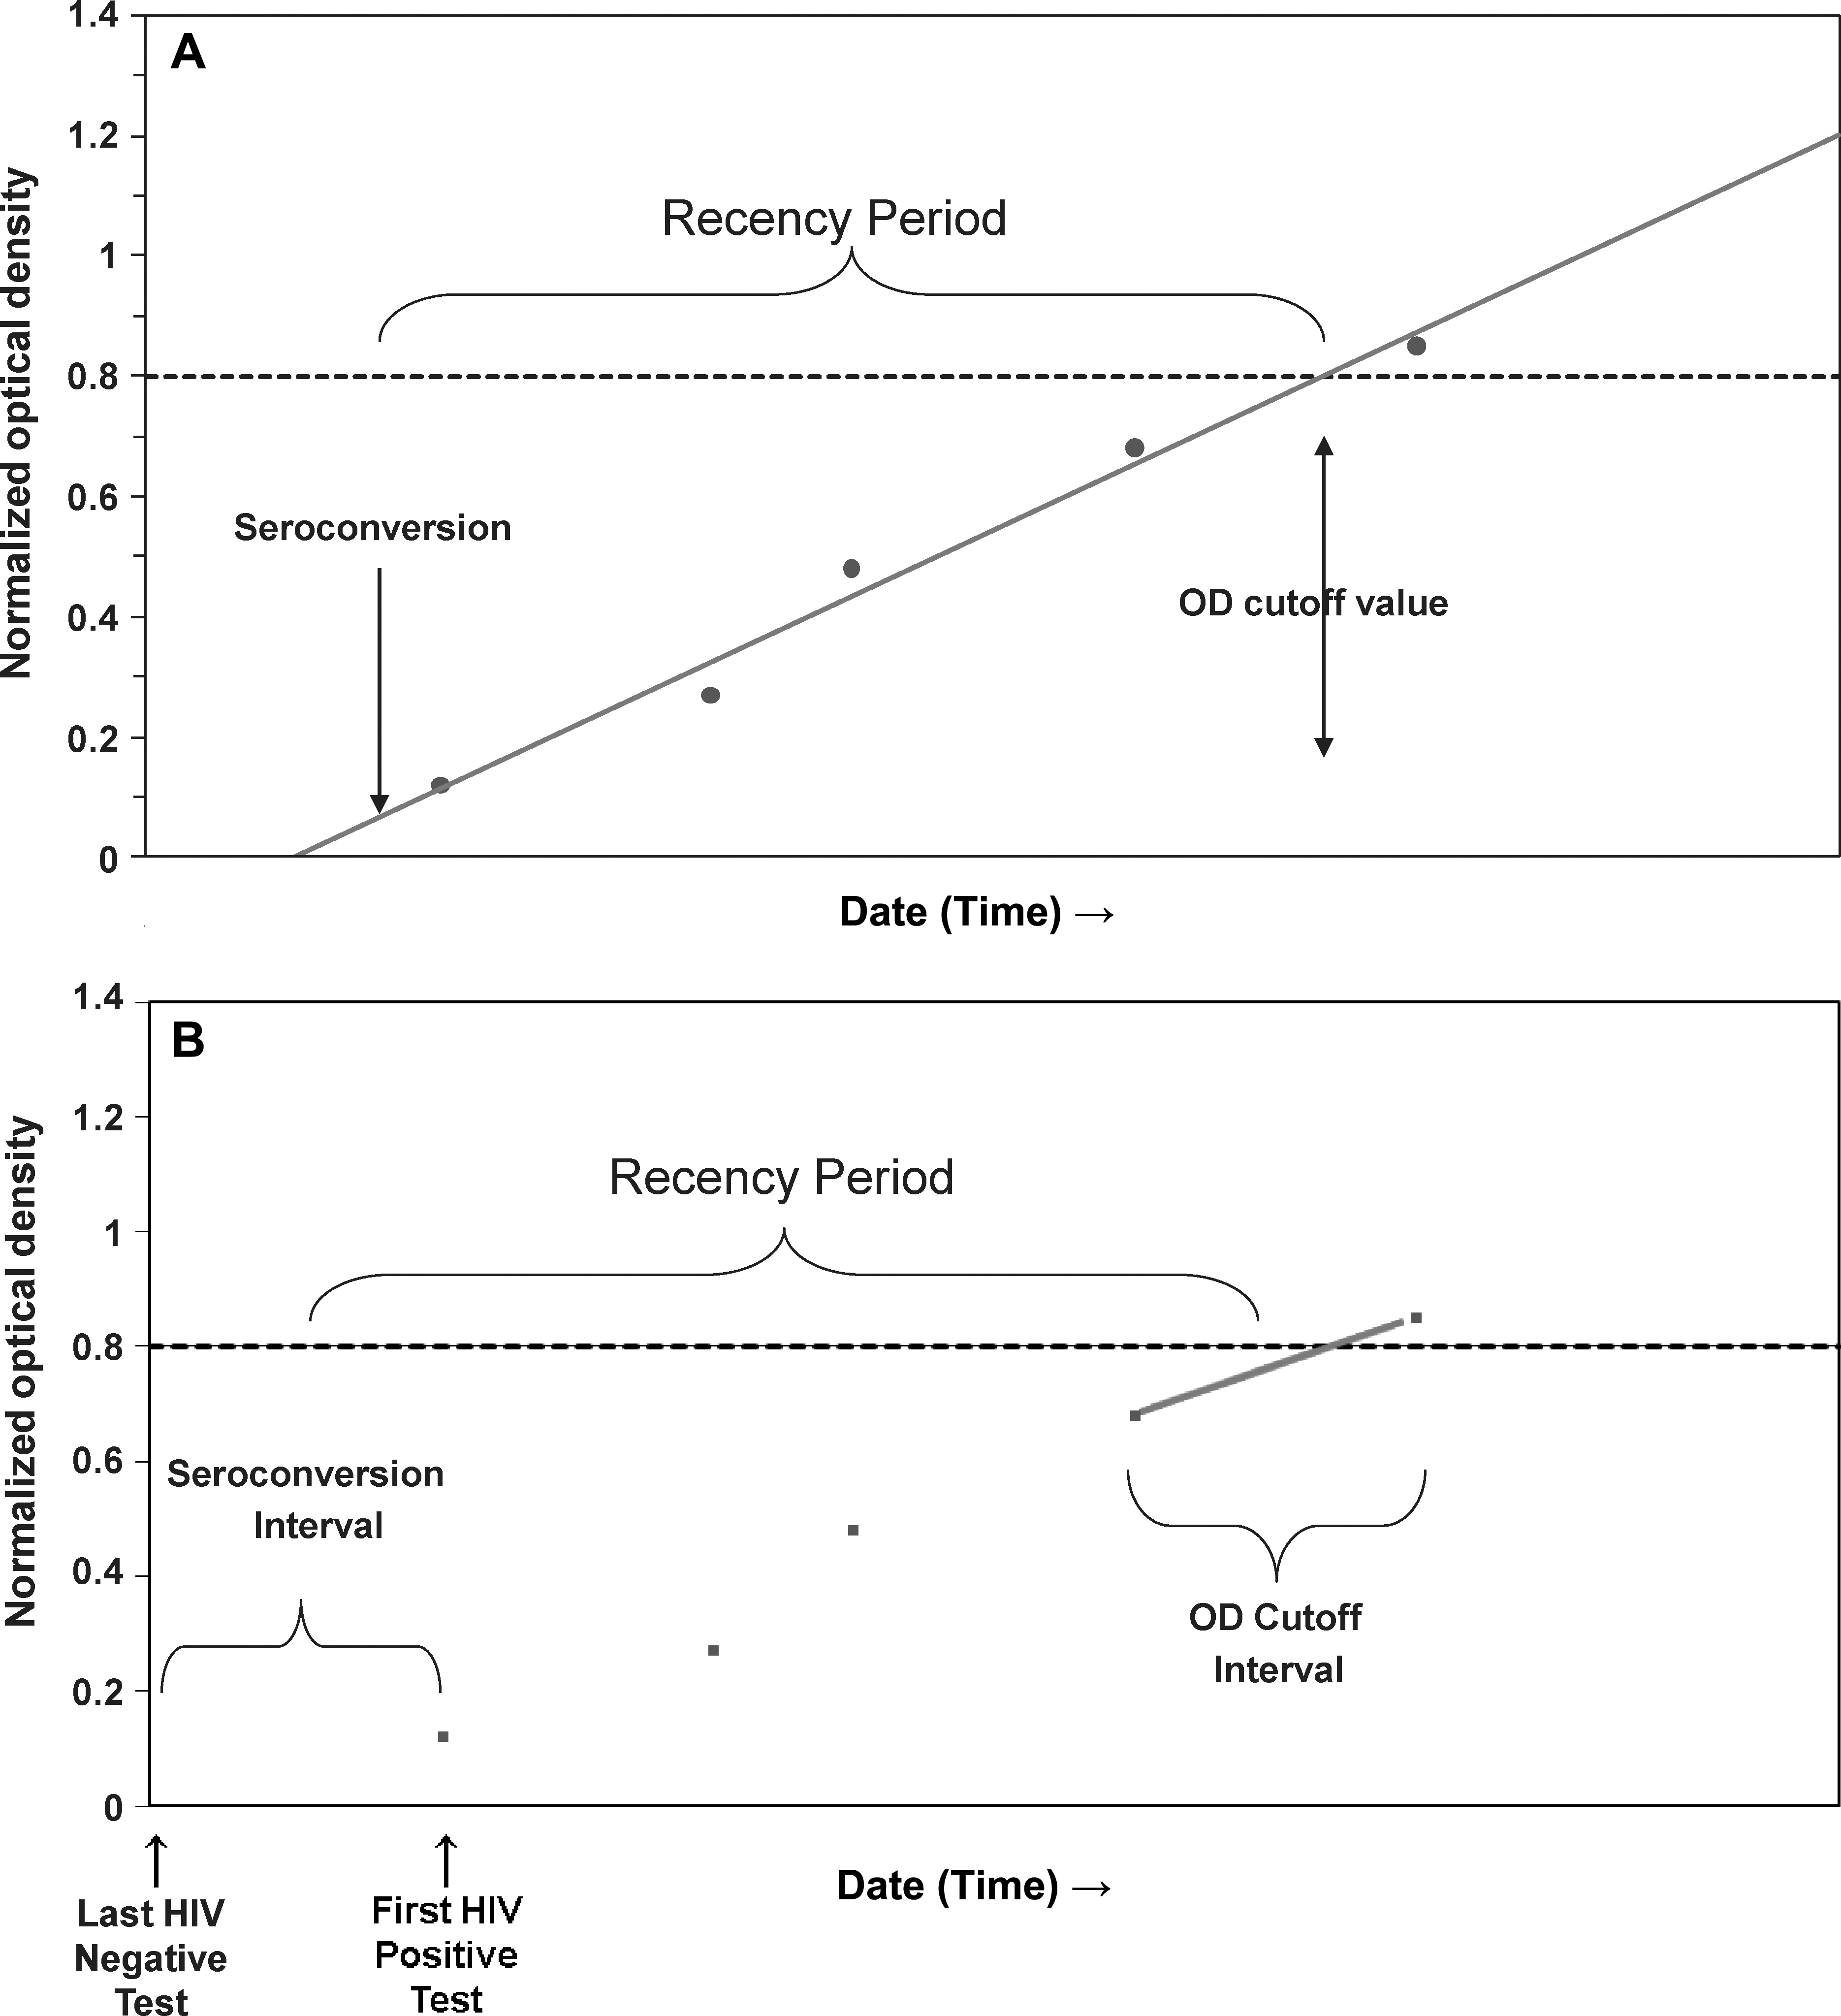
The statistical methods used to calculate the mean time interval (termed mean recency period “ω”) from seroconversion until the cutoff is reached must account for the fact that neither the date of HIV seroconversion nor the date when the cutoff is reached is precisely known. To minimize the uncertainty in estimating HIV seroconversion dates, all estimates for ω were restricted to data from seroconverters for which the time interval between the last HIV-negative and first HIV-positive tests was at most 365 days. Two statistical methods were implemented to estimate ω: linear mixed effects regression (Fig. 1A) and nonparametric survival (Fig. 1B). Selection of the optimal cutoff value for delineating recency for use in estimating incidence was previously described 4 and is partly based on having a value of ω close to 5–6 months. For this report, we estimate ω at the widely used OD-n cutoff value of 0.800 for the BED assay, and we calculate ω and 95% confidence limits separately for HIV-1 subtype B, subtype C, subtypes B and AE from Thailand, and combined specimens with subtype A, D, and AG recombinants. Additionally, the probability that a seroconverter would require greater than 2ω to reach the 0.800 OD-n cutoff, a value used in proposed adjustments for using BED results to estimate incidence, 28,29 was determined from the estimated distribution in each model.
Mixed effects regression
Mixed effects regression methods for correlated, longitudinal data, 30 with time since last negative HIV test as an independent variable and OD-n values as the dependent variable, were used to estimate the subject-specific, predicted recency periods, i.e., the expected time for OD-n level in HIV-positive individuals to reach the 0.800 cutoff. Data transformations of the square root of OD-n and the natural logarithm of time since the last negative HIV test were used to linearize the data with constant variance for all possible values of the data. To more accurately estimate the linear increase in OD-n, mixed effects models were restricted to data from seroconverters with at least three HIV-positive specimens prior to initiation of HIV therapy that spanned a minimum of 60 days and were collected within 3 years of the last negative HIV test. In addition, subjects (n = 8) whose OD-n did not increase over the period of observation were excluded, a potential limitation of this method.
Subject-specific predicted recency periods were calculated from the random effects of the mixed models, linear random coefficients models with exchangeable covariance structure. The estimated date of seroconversion was taken to be the point at which the fitted line intersected the background OD-n level observed in uninfected persons; the time at which the linear fit intersected the OD-n cutoff was taken to be the point at which the selected OD-n level is reached. We verified that the model-based predicted seroconversion date was no later than the first positive HIV test date, and that the predicted date the cutoff value was reached was no later than the first observed value above the selected cutoff.
The mean recency period ω1 was estimated as the mean of the log-logistic distribution fit to the subject-specific predicted recency periods. Bootstrap methods were used to estimate confidence limits for the composite difference between predicted values at the selected cutoff value and baseline for ω1. 31 For bootstrap estimates, N predicted recency periods, with N equal to the total number of subjects in the study population, were randomly selected with replacement; 1000 replicates were computed.
Nonparametric survival
Kaplan–Meier methods 32 were used to estimate the mean survival duration ω2 between the time of seroconversion and the time when the 0.800 OD-n cutoff is reached. Although only one BED measurement per subject is necessary with this method, for comparative purposes, we calculated ω2 with the same data as that used with the mixed effects regression, and with an expanded dataset of specimens from multiple cohorts having no data restrictions. Although the survival starting and ending events are known to occur within defined intervals, the BED OD-n measurements provide additional information about when during the respective intervals seroconversion occurred and when the selected OD-n cutoff was surpassed.
Time since seroconversion was multiply imputed 10 times using a predictive mean matching regression method for data with monotone missing patterns, 33 conditional on its occurrence between the last negative and first positive HIV test dates. Before application of the imputation model, linear mixed effects regression of BED OD-n on days since the midpoint between the last negative and first positive HIV tests was performed to estimate the OD-n increase per day (slope) and model intercept—two covariates used in the imputation model. Only observations prior to and including the first observation above the selected cutoff value, or prior to and including the highest OD-n for those seroconverters who do not reach the 0.800 OD-n cutoff, were used in the mixed effects model for estimation of slope and intercept. A goodness of fit test was performed to demonstrate the linearity of these untransformed data. In addition to slope and intercept, the imputation model included covariates for HIV subtype, time since seroconversion, and BED OD-n of the observation with the closest fit to the estimated linear regression slope. We assumed the seroconversion dates were nonmissing and equal to the midpoint of the interval for those seroconverters with intervals of ≤90 days between the last negative and first positive tests. Thus, the seroconversion date was nonmissing for approximately 15% of seroconverters and the limits of uncertainty about the nonmissing estimates were within 45 days.
For seroconverters with at least one OD-n measurement greater than 0.800, the estimated time when the cutoff was reached was linearly interpolated from times when OD-n first reached the selected cutoff value and the preceding longitudinal observation (or background OD-n if there was no preceding observation). Observations were right-censored at the time of the highest OD-n value for those seroconverters who did not have an OD-n greater than the selected cutoff. Although mean survival time may not be defined when there are censored times longer than event times, for this data set, the mean was finite. Proportional hazards regression was used to compare survival distributions by HIV-1 subtypes.
Results
A total of 2927 specimens from 756 seroconverters were tested with BED. These data comprise test results on specimens from 17 cohorts (Table 1). The increase in OD-n with time since seroconversion is shown for a subset of seroconverters in Fig. 2. The median time between last HIV-negative to first HIV-positive test was 168 days, the first and third quartiles were 105 and 192 days, respectively, and the maximum was 365 days. To estimate the ω1 with the linear mixed effects regression method, a subset of 2327 specimens from 482 seroconverters from 13 cohorts was analyzed. In constructing this dataset, 494 observations were excluded from subjects with fewer than three longitudinal specimens or for which the specimens did not span at least 60 days. Also excluded were 46 observations from specimens obtained later than 3 years after the last HIV-negative test and 60 observations from seroconverters whose OD-n did not increase over the period of observation. The mean background OD-n, based upon HIV-negative specimens (n = 31), was 0.07 (range 0.05–0.11).
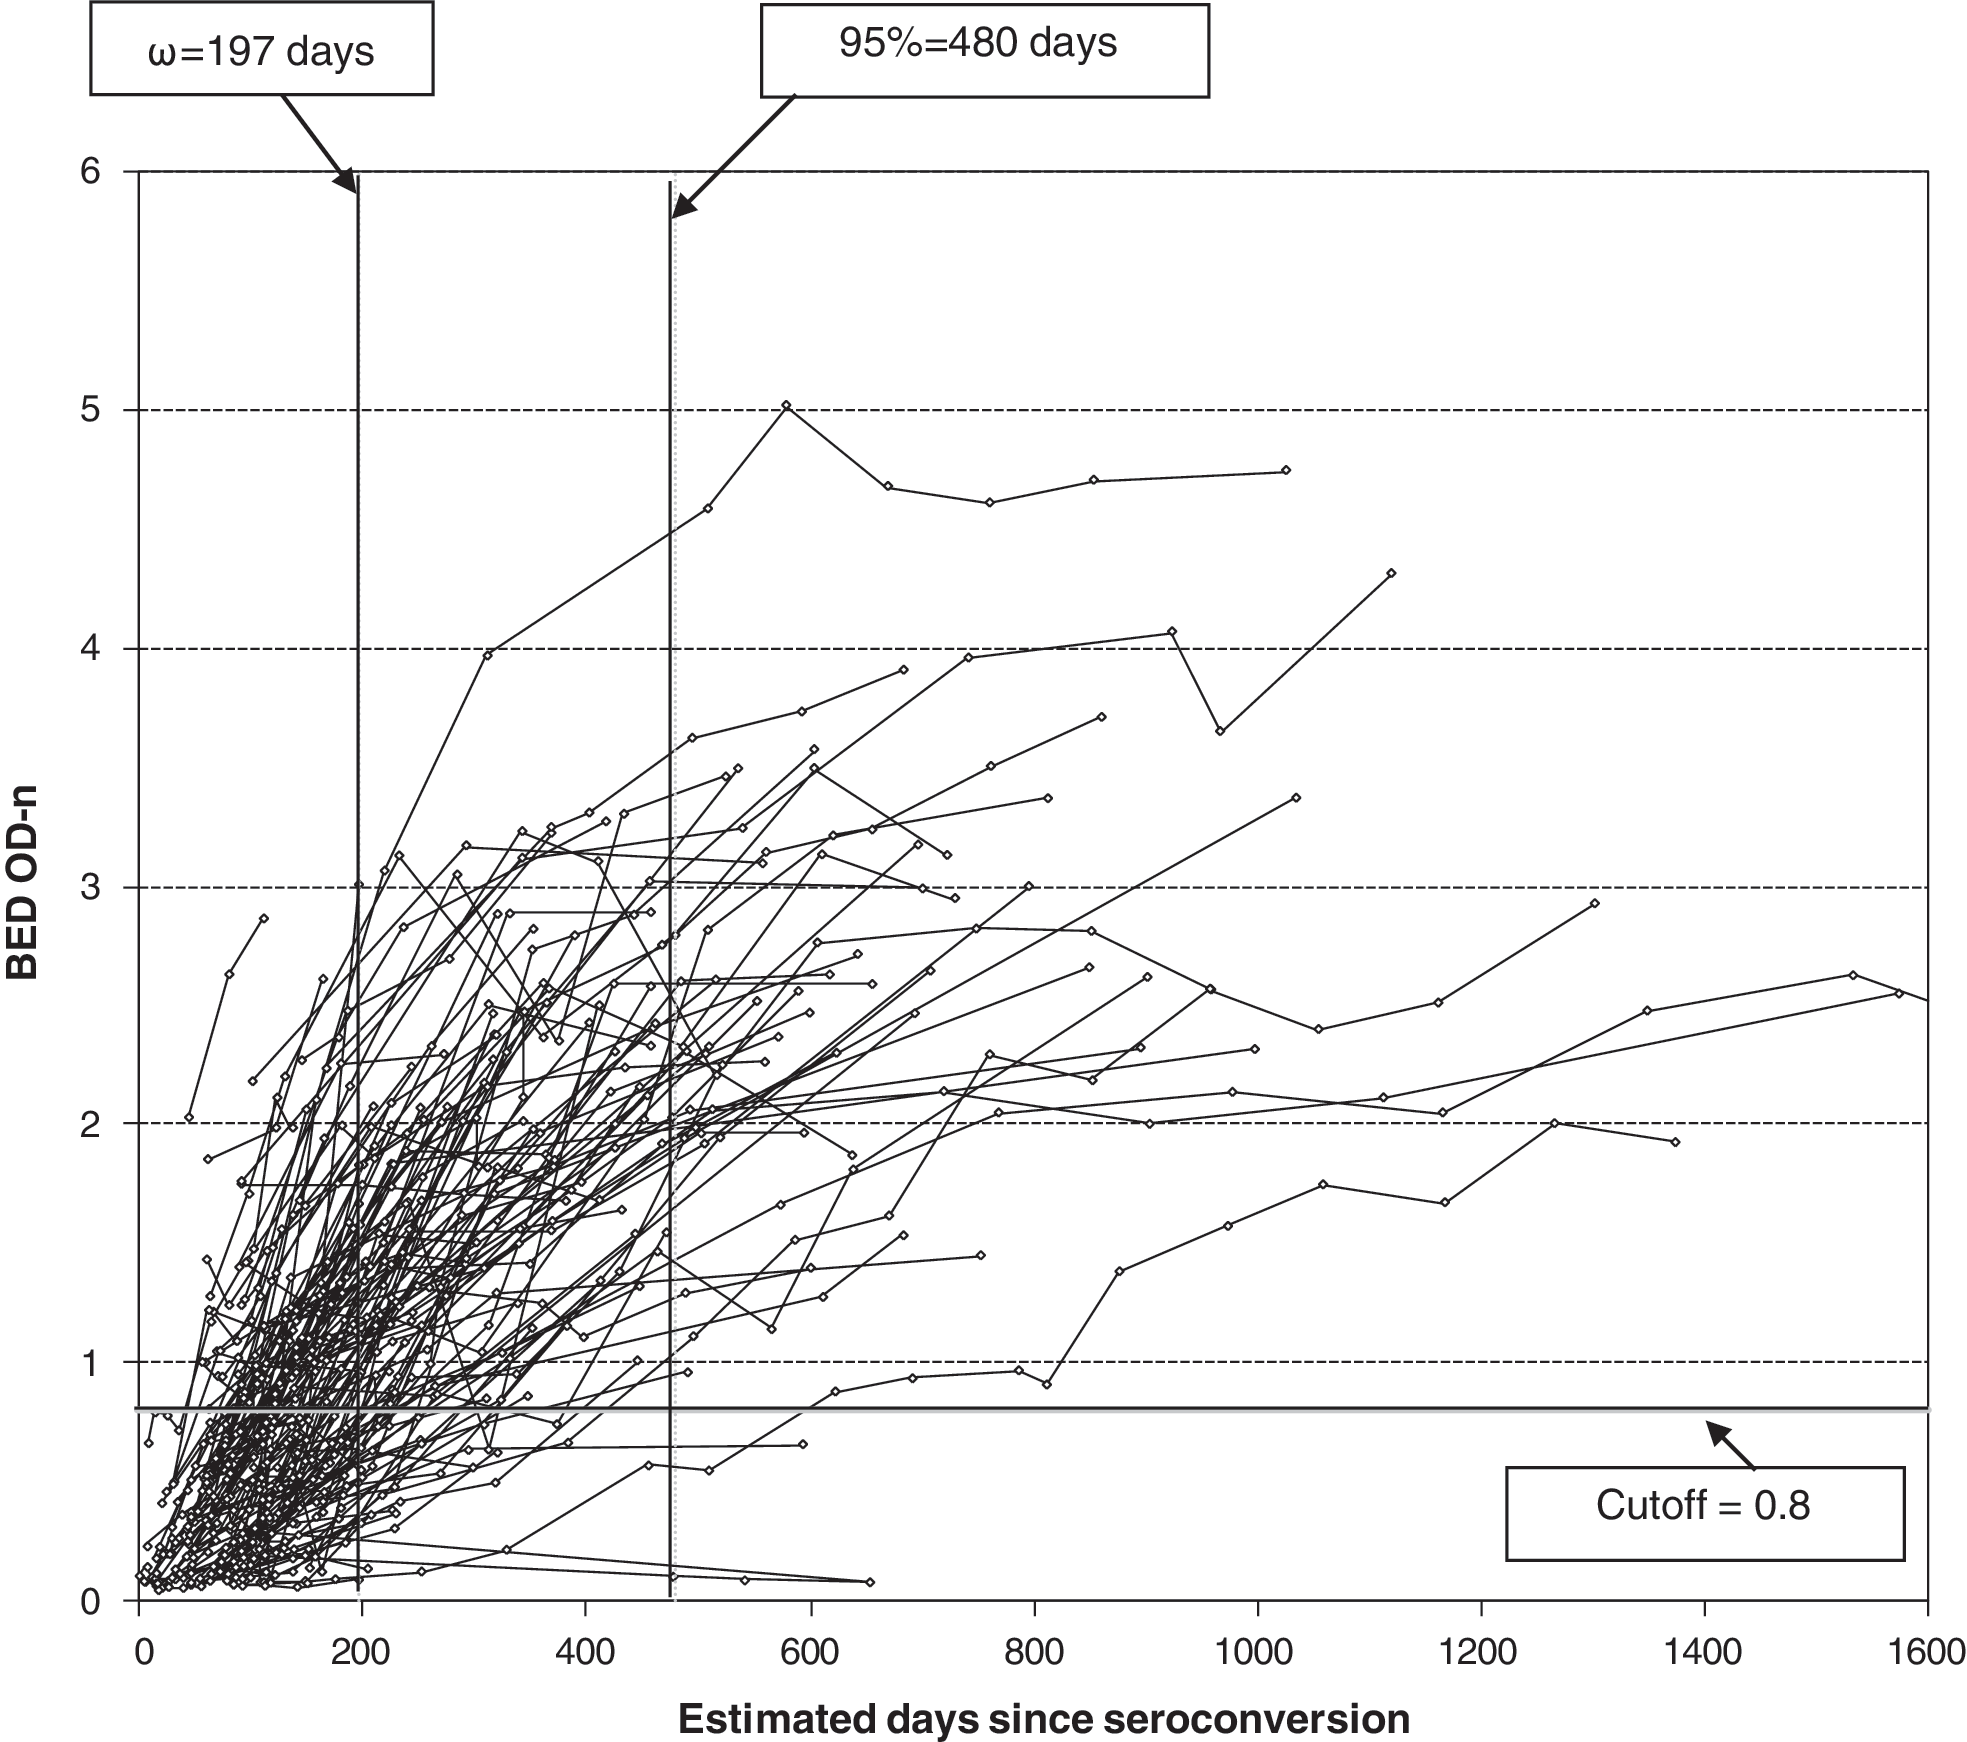
Development of HIV antibodies as detected by the BED-CEIA in relation to time since seroconversion (x-axis). Only a subset of randomly selected seroconverters (N = 220) with sequential specimens is shown for clarity. Cutoff (OD-n = 0.8) is shown as a horizontal line whereas mean recency period (ω) and inclusive period when 95% of people are classified as recent are shown as vertical lines.
The recency periods varied considerably among individuals (Fig. 3). The distribution of individual recency periods, estimated from a mixed effects regression model using longitudinal data from these 482 seroconverters, was not normally distributed, having a prolonged right tail (p < 0.01). Figure 3 demonstrates the probability distribution from estimates based on implementation of the survival method, but the shape of the distribution is similar using either method. The log-logistic distribution provided an adequate fit of the data, and was used to calculate ω1 and the probability that a seroconverter would require greater than twice ω1 to reach the 0.800 OD-n cutoff value. Using this method, ω1 was 176 days (95% CL 164, 188 days). The probability that a seroconverter would require greater than twice ω1 to reach the 0.8 OD-n cutoff was 6.4% (95% CL 4.6, 8.2). Using the log-logistic regression model to test for differences in ω1 between HIV-1 subtypes, there were no statistically significant differences (Table 2).

Frequency distribution of recency periods on the BED-CEIA from analysis of 756 individuals infected with different HIV-1 subtypes.
Estimated from multiple cohorts using linear mixed effects (LME) regression (ω1) and nonparametric survival methods (ω2).
Subset dataset includes data from all sources, but is restricted to subjects with ≥3 observations spanning ≥60 days and having a positive slope, and observations within 3 years of the last negative HIV test.
Based on use of nonparametric survival, and combining the same subset of data from 13 cohorts as that used in the linear mixed effects model, ω2 at the 0.800 OD-n cutoff was 162 days (95% CL 152, 172 days) (Table 2). Using the nonparametric survival method with all available data from 756 seroconverters from 17 cohorts, ω2 was 197 days (95% CL 173, 220 days). When we restricted analysis to individuals with a last negative to first positive interval of <180 days (which excluded a number of individuals, mainly from Africa), the ω2 was 169 days (95% CL 150, 188 days). Restriction to these data would exclude a considerable amount of data (33%), potentially sacrificing the accuracy of the precision. Based on the available data, the distribution of ω2 for HIV-1 subtypes A, D, and AG recombinants was significantly longer (p < 0.001), whereas the distribution for Thai subtype AE (p = 0.02) was significantly shorter, compared to U.S. subtype B (Table 2). The 0.800 OD-n threshold was reached by 70% of seroconverters within the mean ω2 of 197 days, and 95% reached the 0.800 threshold by 480 days. The probability that a seroconverter would require greater than twice ω2 to reach the 0.800 OD-n cutoff was 7.5% (95% CL 4.8, 10.2).
Discussion
The BED-CEIA was developed to detect recent HIV-1 infection for surveillance purposes. Although the assay has been commercially available for the last 3–4 years, the mean recency period ω of 153 days stated in the kit insert was based on our analysis of unpublished data using a limited number of cohorts. This article provides a comprehensive description of the derivation of ω for several individual cohorts and an overall ω that can be used in surveillance programs for incidence estimates.
We used two statistical approaches to determine ω for the BED. Using the nonparametric survival approach on the full data set gives an overall ω of 197 days, with some significant differences among subtypes. This is longer than the 153 days stated in the kit insert because of inclusion of additional cohorts and a difference in statistical methodology. However, the mean recency period for subtype B is 162 days, not very different from the value stated in the kit insert, and should be used for incidence estimates where subtype B is prevalent, including the United States. Since the BED assay is manufactured under the license from the Centers for Disease Control and Prevention, the kit inserts will be revised accordingly to reflect the new analysis. The existing data from countries with non-B subtypes can be reanalyzed using the new recency periods. It is likely that the elevated incidence observed in some populations, especially in Africa, can be due to the short mean recency period used in the calculation. The new mean recency period, in conjunction with appropriate adjustment for long-term specificity, 28,29 should further lower the incidence estimates and improve the accuracy of the estimates.
Though not statistically significant for subtype C relative to subtype B, the ω observed in African cohorts (Kenya, Zimbabwe, Ethiopia) was longer than those in non-African cohorts (United States, Thailand, Netherlands). Possible explanations are (1) the different performance of the assay in the subtypes prevalent in Africa, (2) the different biology of infections leading to different antibody kinetics, or (3) the specific host factors. Total IgG levels in HIV-positive African individuals (median ∼29 mg/ml) are almost twice those of their counterparts in the United States (median ∼15mg/ml) (B.S. Parekh, unpublished data), which could explain the longer duration of recency of the BED assay in these cohorts. Development of HIV-specific antibody is likely affected by the initial viral load (peak viremia), subsequently affecting the period of recency. Thus, early viral load differences among HIV-1 subtypes, as reported by Hu et al., 24 could result in some of the differences we have observed between different subtypes, including subtype B and AE from Thailand. Karita et al. 34 reported that individuals with a lower viral load were more likely to be misclassified as recent than those with a higher viral load. Hayashida et al. 35 and Novitsky et al. 36 recently reported that patients with low viral load can have slower antibody development and continue to be misclassified as recent infections by the BED and the less-sensitive assays, respectively.
Our analysis had important limitations. Although our dataset was large, and included individuals from 10 countries with diverse HIV subtypes, it may not be representative of all newly diagnosed infections in these countries. Selection biases may have impacted observed differences in recency periods by subtype. In addition, measures are assumed to be monotonically increasing from a state of recent infection to long-term infection. The reverse has been observed in late stages of AIDS or in patients receiving antiretrovial therapy (ART). However, our study was careful to not include patients receiving therapy.
It is important to distinguish the use of ω, the mean recency period, for the purpose of population incidence estimates, from that of an inclusive recency period of the assay that could be used to classify recent infections at the individual level. Because of wide individual variability in antibody evolution, only 70% of individuals will attain the OD-n cutoff for ω within the mean of 197 days (Fig. 3). The rest will take longer than 197 days to reach the OD-n cutoff. Because of a wide variation with a nonnormal distribution of individual recency periods, the inclusive interval that might be of use for individual diagnosis will be much longer than the mean recency period ω. Therefore, the traditional approach to calculate the sensitivity of detecting recent infection should not be applied here because the mean recency period is determined exclusively for incidence estimates, not to diagnose recent infection in an individual. This applies not only to the BED assay but to all methods that are designed and developed to estimate incidence. Our data suggest that 95% of individuals reached the 0.800 OD-n cutoff by 480 days, but because these data consist only of observations from persons with incident infections compared with the overall distribution of times since seroconversion in all infected persons, these results are not definitive.
Although the BED assay was developed with the goal of having similar recency periods in different subtypes, our results demonstrate differences among subtypes ranging from 127 days (Thai AE) to 236 days (subtypes A/D/AG in Africa). This may limit the application of the assay in populations with divergent subtypes and/or may require use of subtype-specific recency periods for the accurate estimation of incidence.
Antibody developmental kinetics will also be different among seroconverting people who start early treatment. Longitudinal specimens from such individuals should not be used to derive estimates of ω. Because ART suppresses viral load it affects antibody development and its persistence, hence affecting the results of the BED-CEIA. It is likely that other assays that rely on maturation of antibody development (e.g., antibody level or avidity) will also be affected by ART treatment. Therefore, specimens from individuals on ART should be excluded for the determination of the mean recency period. Similarly, Hayashida et al. 35 reported increased misclassification of longstanding infections as recent following ART treatment. With increased use of ART, the rate of misclassification is likely to increase over time as viral load is effectively suppressed resulting in lack of immune stimulation for continued antibody synthesis. These individuals should be excluded from cross-sectional sample sets for the determination of incidence estimates.
Footnotes
Acknowledgments
The authors would like to express deep appreciation to a number of collaborators who provided access to valuable specimens, with special thanks to Drs. Roel Countinho (Amsterdam cohort), Tsehaynesh Messele (Ethiopia cohort), Man Charurat (REACH cohort), John Nkengasong, and to the Multicenter AIDS Cohort Study (MACS). The finding and conclusions in this paper are those of the authors and do not necessarily represent the views of the Department of Health and Human Services or the Centers for Disease Control and Prevention.
Author Disclosure Statement
No competing financial interests exist.