
Abstract
Memory CD4 T cells are the primary targets of HIV-1 infection, which then subsequently spreads to other T lymphocyte subsets. Antiretroviral therapy (ART) alters the pattern of HIV-1 distribution. Blood samples were collected from ART-naïve or -experienced HIV-1 patients, and the memory and naïve subsets of CD4+ and CD8+ T lymphocytes, respectively, were isolated by cell sorting. DNA was extracted and the HIV-1 env C2/V3 region PCR amplified. Amplicons were cloned and sequenced, and genetic relatedness among different HIV-1 compartments was determined by the phylogenetic analysis of clonal sequences. The viral V3 sequence of HIV-1 in each compartment was analyzed by using webPSSM to determine CCR5 or CXCR4 coreceptor binding property of the virus. The direction of viral migration among involved compartments was determined by using the MacClade program. In ART-naïve patients, HIV-1 was generally confined to the memory CD4 T (mT4) cell compartment, even though in a few cases, naïve CD4 T (nT4) cells were also infected. When this occurred, the HIV-1 gene migrated from nT4 to mT4. In contrast, HIV-1 was detected in nT4 and mT4 as well as in the memory CD8 T (mT8) compartments of ART-experienced patients. However, no clear pattern of directional HIV-1 gene flow among the compartments could be determined because of the small sample size. All HIV-1–infected T cell compartments housed the virus that used either CCR5 or CXCR4 as the coreceptor.
Introduction
HIV-1
Materials and Methods
Human research materials and isolation of different T cell subsets
The study utilized, without any personal identifiers, unused portions of venous blood samples of HIV patients that had been sent to our reference laboratory for CD4T cell enumeration and viral load assessment. The protocol was therefore classified, following an expedited review, as “exempt” from further review requirements by the Ponce School of Medicine Institutional Review Board, FWA00000345. All test samples were obtained as EDTA-treated blood and were selected for inclusion in the study by convenience (e.g., sufficient blood volumes, medium-range CD4 T cell counts and no extensive hemolysis, etc.). Peripheral blood mononuclear cells (PBMC) were separated from blood by centrifugation in Accutubes containing Histopaq-1077 (Sigma-Aldrich, St. Louis, MO), according to the manufacturer's recommended protocol. Plasma was separated and stored for testing. The cells were washed twice with RPMI-1640 (Sigma-Aldrich) supplemented with10% fetal bovine serum (FCS) (Caisson, Sugar City, ID), and then once more with Dulbecco's phosphate buffered solution (PBS) (Sigma-Aldrich) containing 1% sodium-azide (Sigma-Aldrich) and 2% FCS. Cells were then suspended in 20 μl each of anti-CD3 PE-Cy7, -CD4 PerCP, -CD8 APC-Cy7, -CD45RA-FITC, and -CD45RO APC murine monoclonal antibody-conjugates (BD, San Jose, CA). After incubation for 20 min at room temperature in the dark, unbound antibodies were removed by washing twice with PBS plus 2% FCS. Cells were analyzed for each marker expression using a FACSAria flow cytometer and FACSDiva software (BD) and CD3+CD4+CD45RA+(naïve CD4-T: nT4), CD3+CD4+CD45RO+ (memory CD4-T: mT4), CD3+CD8+CD45RA+ (naïve CD8-T: nT8), and CD3+CD8+CD45RO+(memory CD8-T: mT8) cells were simultaneously isolated by cell sorting. An appropriate isotype control was used for each conjugate to identify accurately the cells that were positive for each marker. Purity of each sorted cellular population was >99% in all cell preparations. Any samples that failed to yield 1.0 x 10⁴ cells for more than one T cell subset were excluded from the analysis. The minimum number of cells required was empirically set to ensure a successful PCR amplification and cloning, which are described below.
DNA extraction and PCR amplification of HIV-1 env C2-V3 gene
Each purified T cell subset was counted and washed and DNA was extracted and purified using a QIAamp DNA Blood minikit (QIAGEN, Germantown, MD). HIV-1 RNA was similarly purified from the matching plasma by using the QIAGEN QIAamp RNA Blood minikit. Purified RNA (25 μl), serially diluted, 20,21 was RT-PCR-amplified for HIV-1 env C2–V3 gene sequences. Briefly, HIV-1 C2–V3 genes were RT-PCR amplified using Roche Titan One-Tube RT-PCR kits and ABI Gene Amp-9700 cyclers. The RT-PCR conditions were: reverse transcription at 60°C for 10 min, inactivation at 95°C for 10 min, followed by 35 cycles of (94°C for 30s, 60°C for 30s and 72° for 1:30 min) with the final extension at 72°C for 7 min. The first round primer pair (50 pmole each) used was: ED31F: 5’-CCTCAGTCATTACACAGGCCTGTCCAAAG-3’ and ED12R: 5’-AGTGCTTCCTGCTGCTCCCAAGAACCCAAG-3. The first round amplicons were re-amplified using the secondary primer pair (50 pmole); C2V3F: 5’-CTGTTAA ATGGCAGTCTAGC-3 and C2V3R: 5’-TGATGGGAGGGG CATACATT-3’.
Amplicons were visualized by UV in 1.5% agarose gel electrophoresis using ethidium bromide. The resulting amplicons represented the HIV-1 gene nucleotide sequence positions 7002 through 7217. (PCR amplification from the HIV-1 proviral DNA was similarly performed but without the initial RT step). Confirmed amplicons were further processed for cloning and sequencing.
Cloning and sequencing of C2V3 amplicons
Each confirmed amplicon was cloned using TOPO TA Cloning Kit PCR 2.1/4.0 Topo Vectors with One Shot Top 10 chemically competent E. coli (Invitrogen, Carlsbad, CA). Preparation and procedure were carried out according to the manufacturer's recommended protocol. Approximately 15 colonies were randomly picked from the plates of the lowest template concentrations that successfully yielded the amplicon; another 15 came from the plates that used x100 higher template concentration. The insert verification was performed by colony PCR for the C2–V3 sequence. A Fast Plasmid® Mini (Eppendorf, Westbury, NY) and a QIAprep® Spin miniprep kit (QIAGEN) were interchangeably used for the purification of the specific plasmids, according to the respective manufacturers' recommended protocols. The plasmid preparations were purified by the PCR purification EXO-SAP reaction, consisting of a mixture of E. coli exonuclease I (Epicentre®, Madison, WI) and shrimp alkaline phosphatase (Roche Molecular System, Indianapolis, IN) followed by treatment with a Big Dye® Terminator™ v3.1 Cycle sequencing Kit (Applied Biosystems, Foster City, CA). Sequencing reaction was carried out using 3.2 pmol M13 primers (Integrated DNA Technologies, Coralville, IA) M13F 5’-GTAAAACGACGGCCAG-3’ and M13R 5’-CAGGAAACAGCTATGAC-3’. DNA sequencing was performed using an ABI 3730 automated DNA sequencer with 48 capillaries.
Phylogenetic analysis and HIV-1 gene flow between T cell subcompartments
HIV-1 C2-V3 sequences were imported to SeqScape® (v2.5) software (Applied Biosystems) and aligned by using the HXB2 sequence as the reference.
22
Aligned sequences were exported in the FASTA format to a BioEdit Sequence Alignment Editor (v7.0.5.2) (
Phylogenetic relationships among different HIV-1 compartments were analyzed by using a neighbor-joining algorithm, and the intra- and inter-compartmental genetic distances were calculated by the genetic distance program of MEGA (v 3.1) software. The Tamura–Nei nucleotide substitutions model was used to calculate evolutionary distances. Compartmentalization of HIV-1 in each T cell subset was tested by the Student's t-test, as previously described by Philpott et al.,
24
and p < 0.05 was used as the indication of HIV-1 compartmentalization. The tree was constructed, after 10,000 bootstrapping, with the pairwise deletions and gamma distribution options. The Bayesian analysis (posterior probabilities distribution of trees) needed for gene flow analysis was created by using the BEAST package of software (v.1.5.4) (
Nucleotide sequence accession numbers
All the sequences used in this study have been deposited in GenBank under accession numbers HQ115756 through 116168.
Results
T cell subset counts and viral loads of the samples utilized
Twenty-one and twelve blood samples from therapy-experienced and -naïve patients, respectively, met our screening criteria of having a sufficient number of each T cell subset and yielding HIV-1 env C2V3 PCR amplicons for one or more of T cell subsets (Table 1). For each sample, the number of cells obtained from each T cell subset (by cell sorting) and the plasma viral load are provided. In total, 31/79 isolated T cell compartments used for PCR amplification were positive for HIV-1 proviral C2–V3 gene. As anticipated in therapy-experienced patients, the CD45RO positive (memory) CD4 T cell (mT4) compartment was most frequently positive (19/21) for HIV-1 proviral DNA, but 6/17 CD45RA positive (naïve) CD4 T (nT4), 5/21 memory CD8 (mT8), and 1/20 naïve CD8 (nT8) compartments were also positive for HIV-1 proviral DNA (compartments that positively amplified are identified by shading). A required number of cells (i.e., 1 x l04) were not available (NA) for four nT4 and one nT8 compartments. Only one sample (#31) was positive in three compartments (including mT4, nT4, and mT8). In the table, T cell subcompartments that housed CXCR4- and CCR5-binding HIV-1 are designated as (X4) and (R5), respectively. It should be noted that three out of four samples that harbored the CXCR4-binding HIV-1 (i.e., samples 13, 14, 26, and 27) had either nondetectable or <48 HIV-1 RNA copies/ml plasma viral load. Only one sample, #13, had a reasonably high plasma viral load of 27,094 HIV-1 RNA copies/ml.
CD4 or CD8 T cells were further separated by cell-sorting as CD45RA (naïve) and CD45RO (memory) subsets. Each subset was expressed as CD4RA, CD4RO, CD8RA, and CD8RO.
N.A., not available; a sufficient number of cells could not be recovered after cell-sorting.
The 2.2 E4 designation stands for 2.2 × 10⁴.
In contrast, 14/48 compartments in therapy-naïve patients were positively amplified for HIV-1 proviral DNA, but the infection was largely confined to the mT4 subset. Only 2/12 therapy-naïve samples that were amplified displayed the presence of HIV-1 in mT4 and nT4 compartments; these were also the only two samples containing X4 virus. HIV-1 was not detected either in mT8 or nT8 among the therapy naïve samples.
Phylogenetic relationship among the viral lineages in different T cell subsets
A MEGA neighbor-joining tree was drawn for the HIV-1 C2V3 genetic clones of the 11 samples from therapy-experienced patients that yielded at least two positive T cell subsets (Fig. 1). It should be noted that the virus in each T cell subcompartment formed a separate cluster apart from the virus in the other T cell compartments, except in sample #14. HIV-1 was amplified in the mT4 (open triangles) and nT4 (open circles) compartments of six samples (#6, 10, 14, 21, 25, and 30) and in mT4 (open triangles) and mT8 (closed triangles) in 4 samples (#16, 18, 22, and 27). One sample (#31) was positive in three compartments, including nT4, mT4, and mT8. Figure 2 shows individual neighbor joining trees of four examples (samples #6, 16, 22, and 31) with respective evolutionary distances calculated by Tamura–Nei nucleotide substitutions and bootstrapping values. Another tree was drawn for the twelve samples from therapy-naïve patients (Fig. 3), all of which samples, upon PCR amplification, showed the presence of HIV in mT4. Two (#18, 21) were also positive in nT4, but no CD8 T cell compartment in any of the samples was HIV-1 positive.
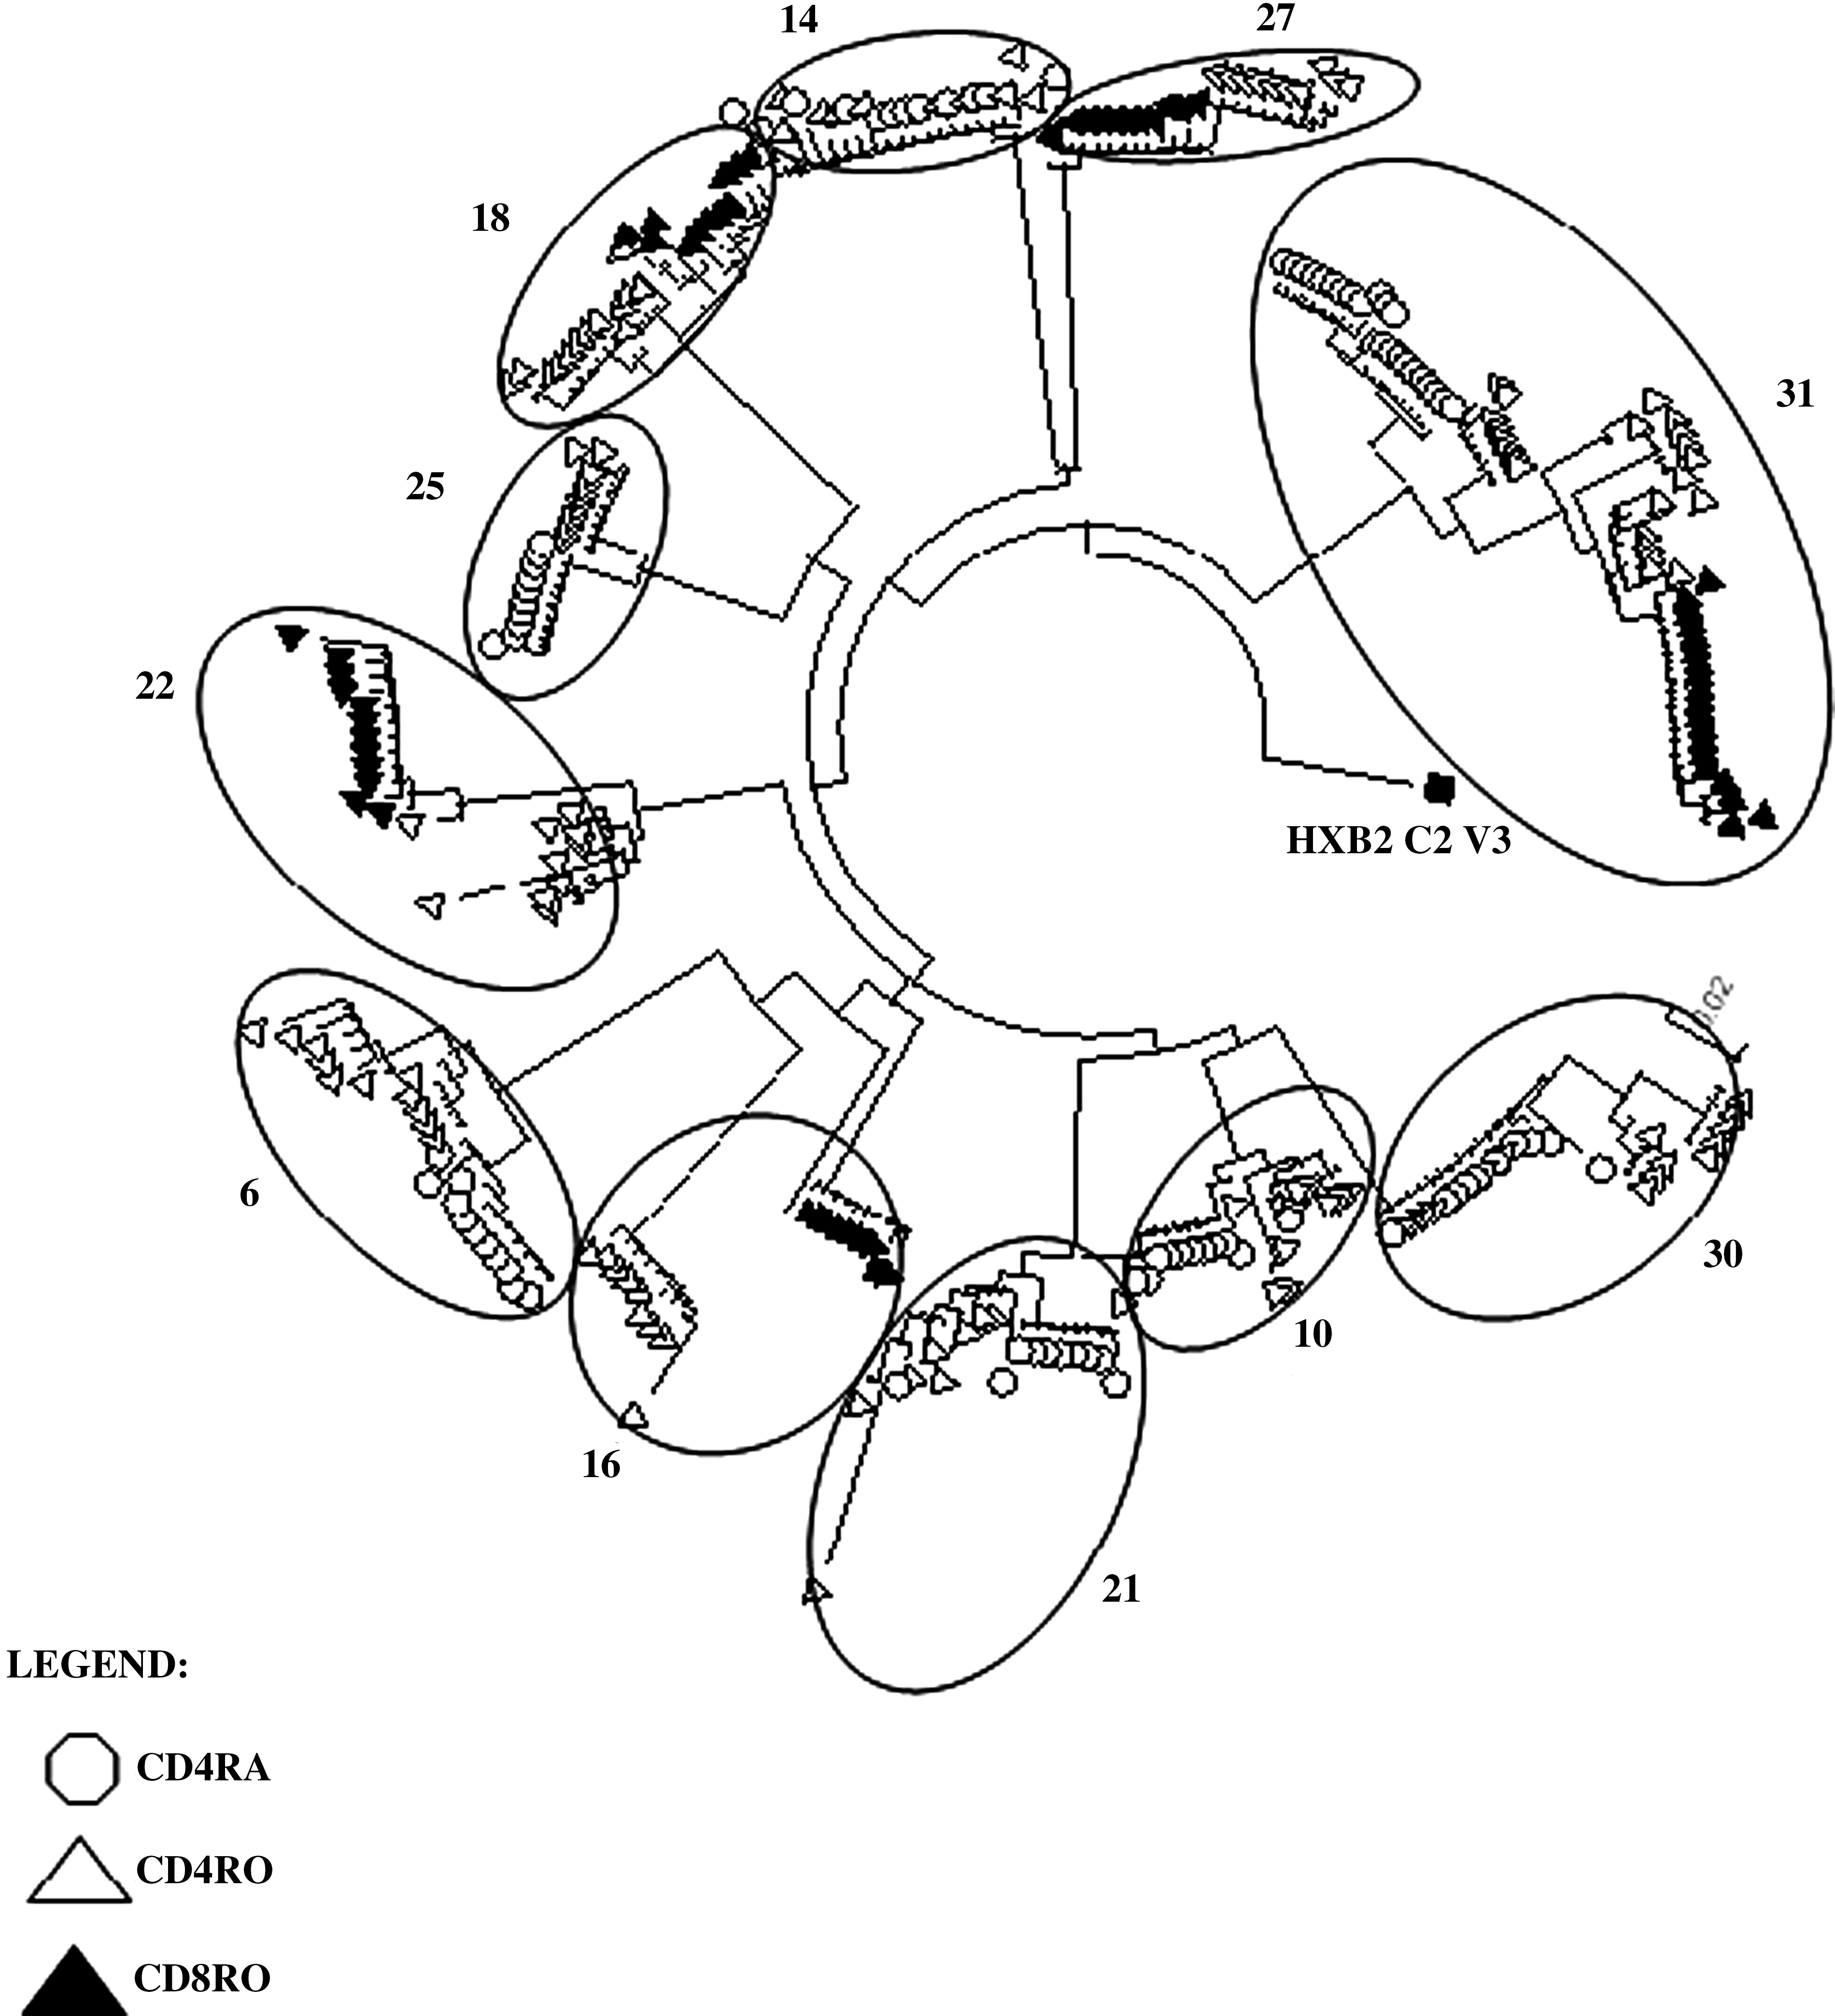
Neighbor-joining tree (MEGA) of HIV-1 env C2-V3 genetic clones isolated from the purified T cell subsets of eleven ART-experienced HIV-1 patients. For each ART-experienced HIV-1 infected patient, peripheral blood mononuclear cells were isolated by centrifugation on a Ficoll-gradient and naïve and memory subsets of CD4 and CD8 T cells, respectively, were isolated by cell sorting using a FACSAria. After cell lysis, DNA was purified and amplified for HIV-1 env C2–V3 proviral gene sequence. The amplicons were cloned and approximately 35 genetic clones were picked and sequenced for each compartment. Ten clonal sequences were randomly chosen for each compartment and a MEGA neighbor joining tree was created (10,000 bootstrapping) to demonstrate the genetic relationship among HIV-1 infecting different T cell subsets.
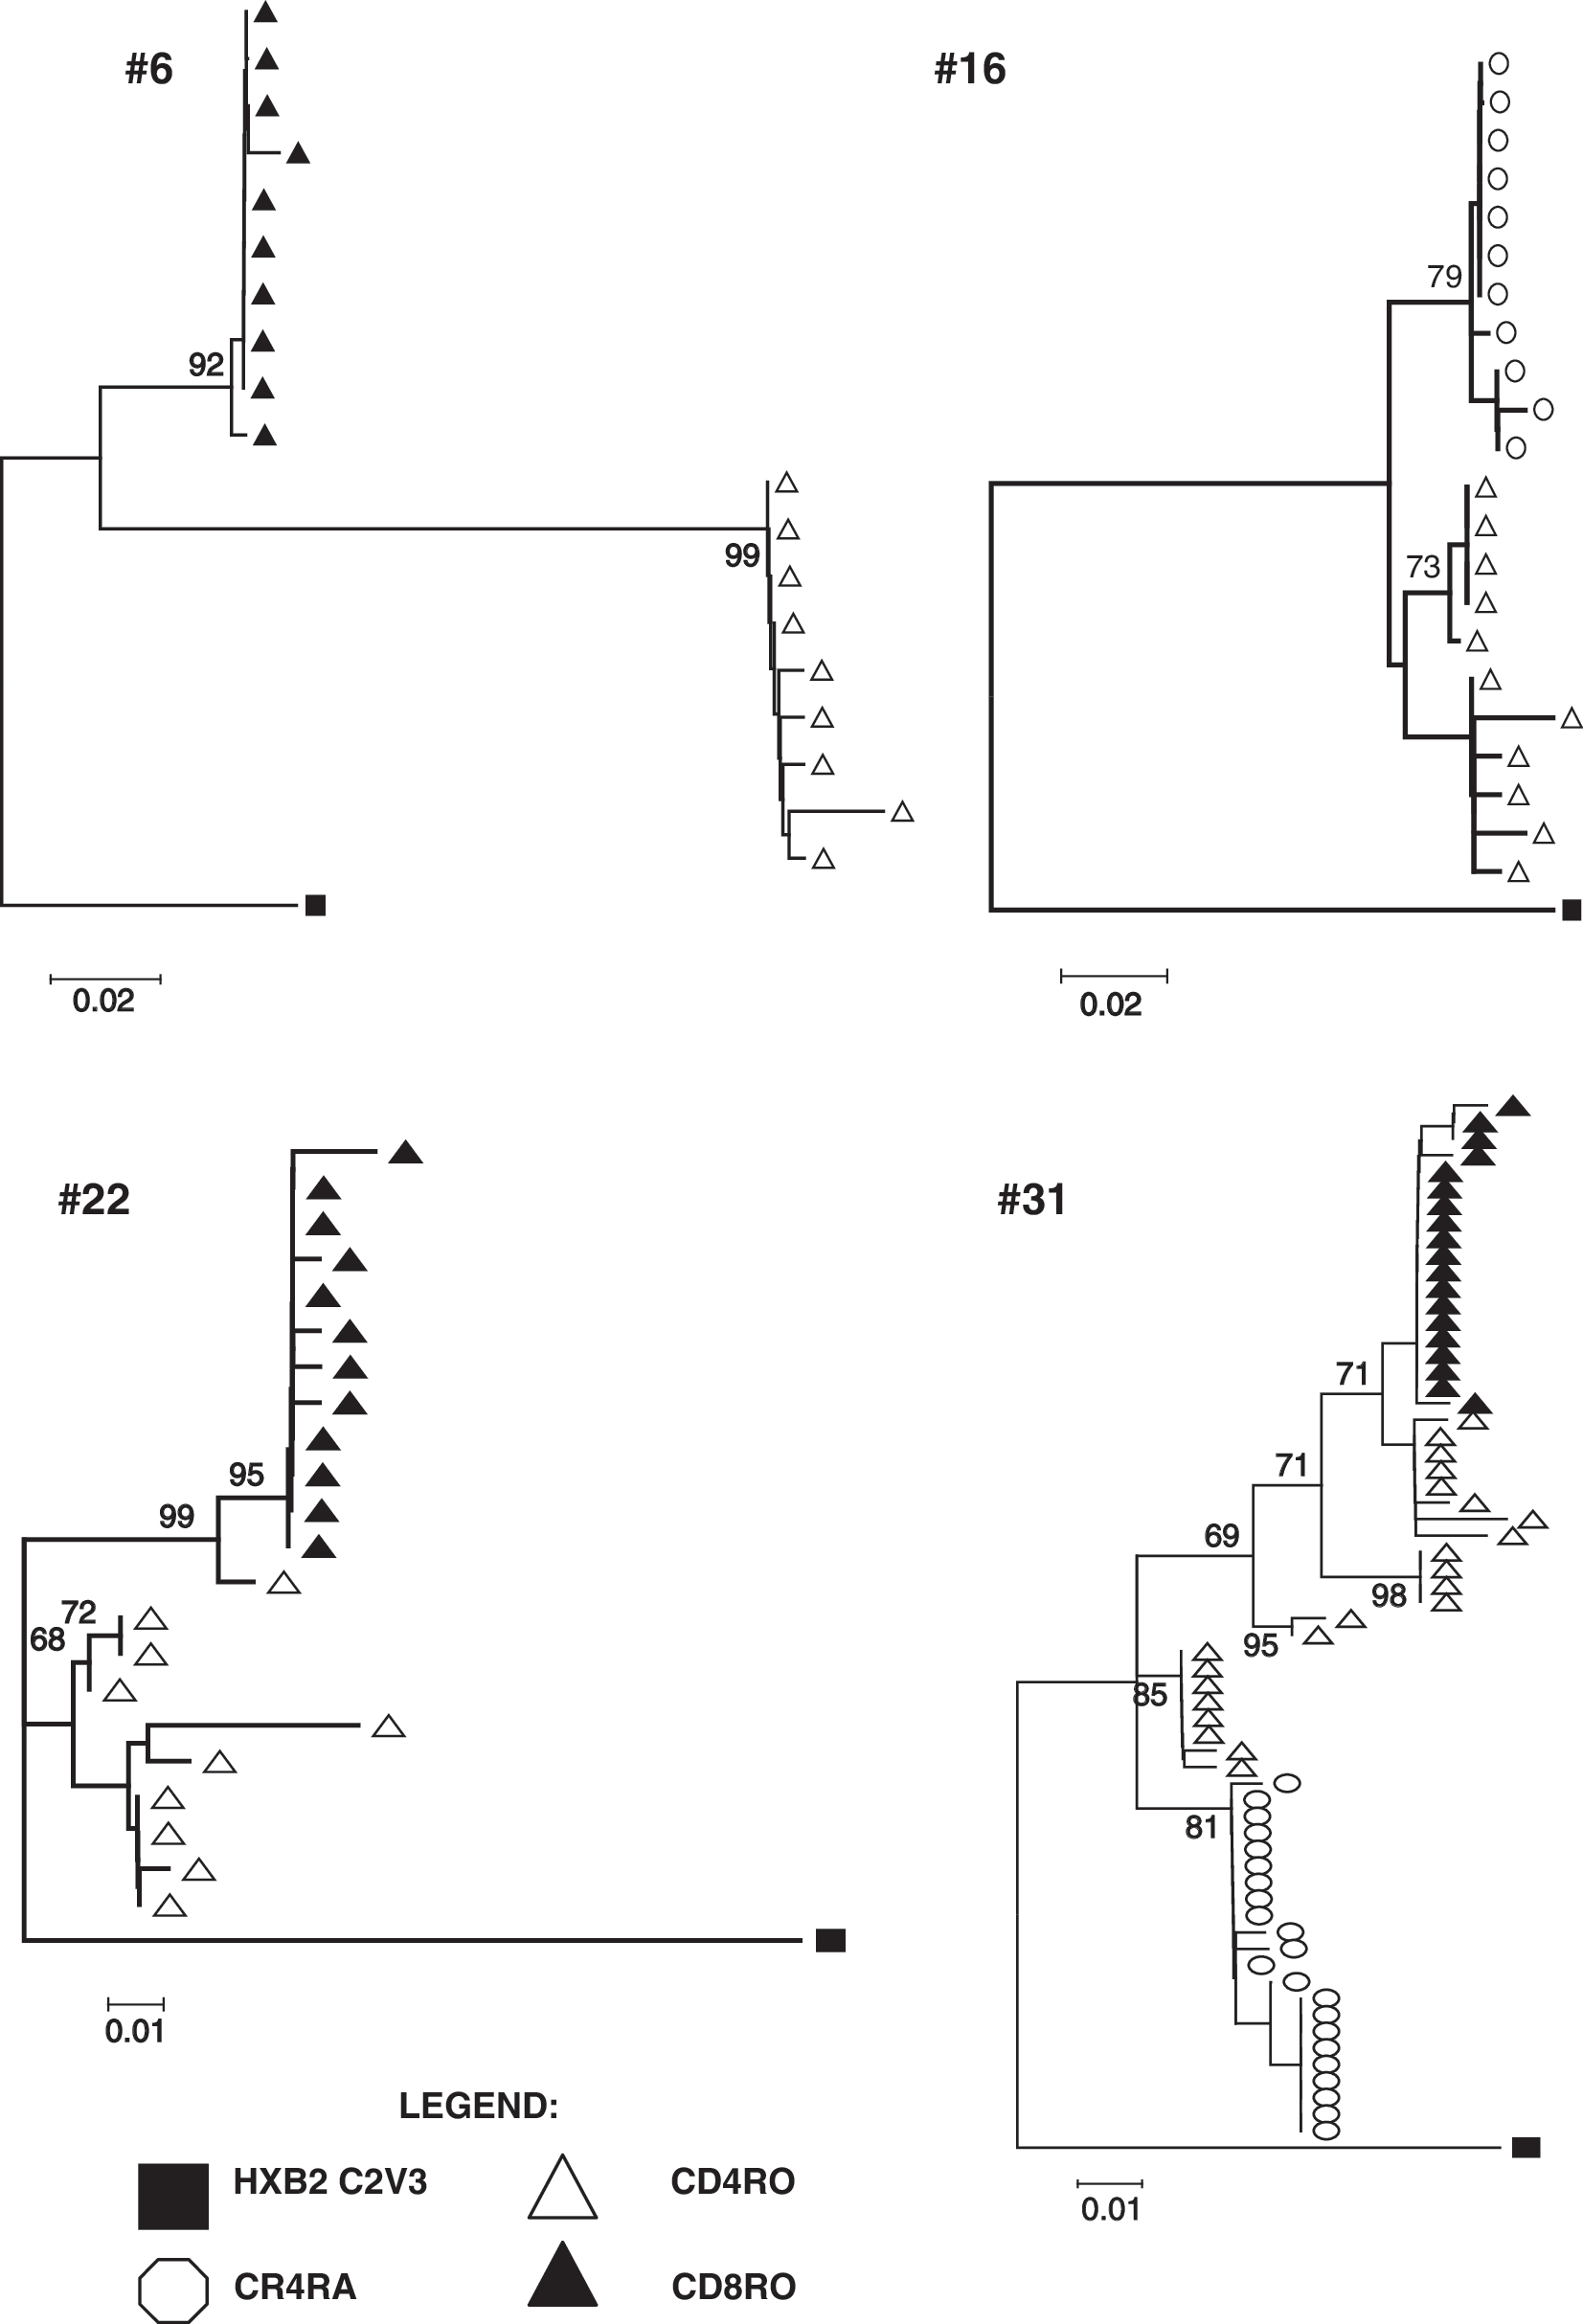
Individual neighbor joining trees for four examples; samples #6, 16, 22, and 31. Individual NJ trees for samples #6, 16, 22, and 31 are drawn using MEGA program to a scale and bootstrapping values of the analyses are shown in each figure.
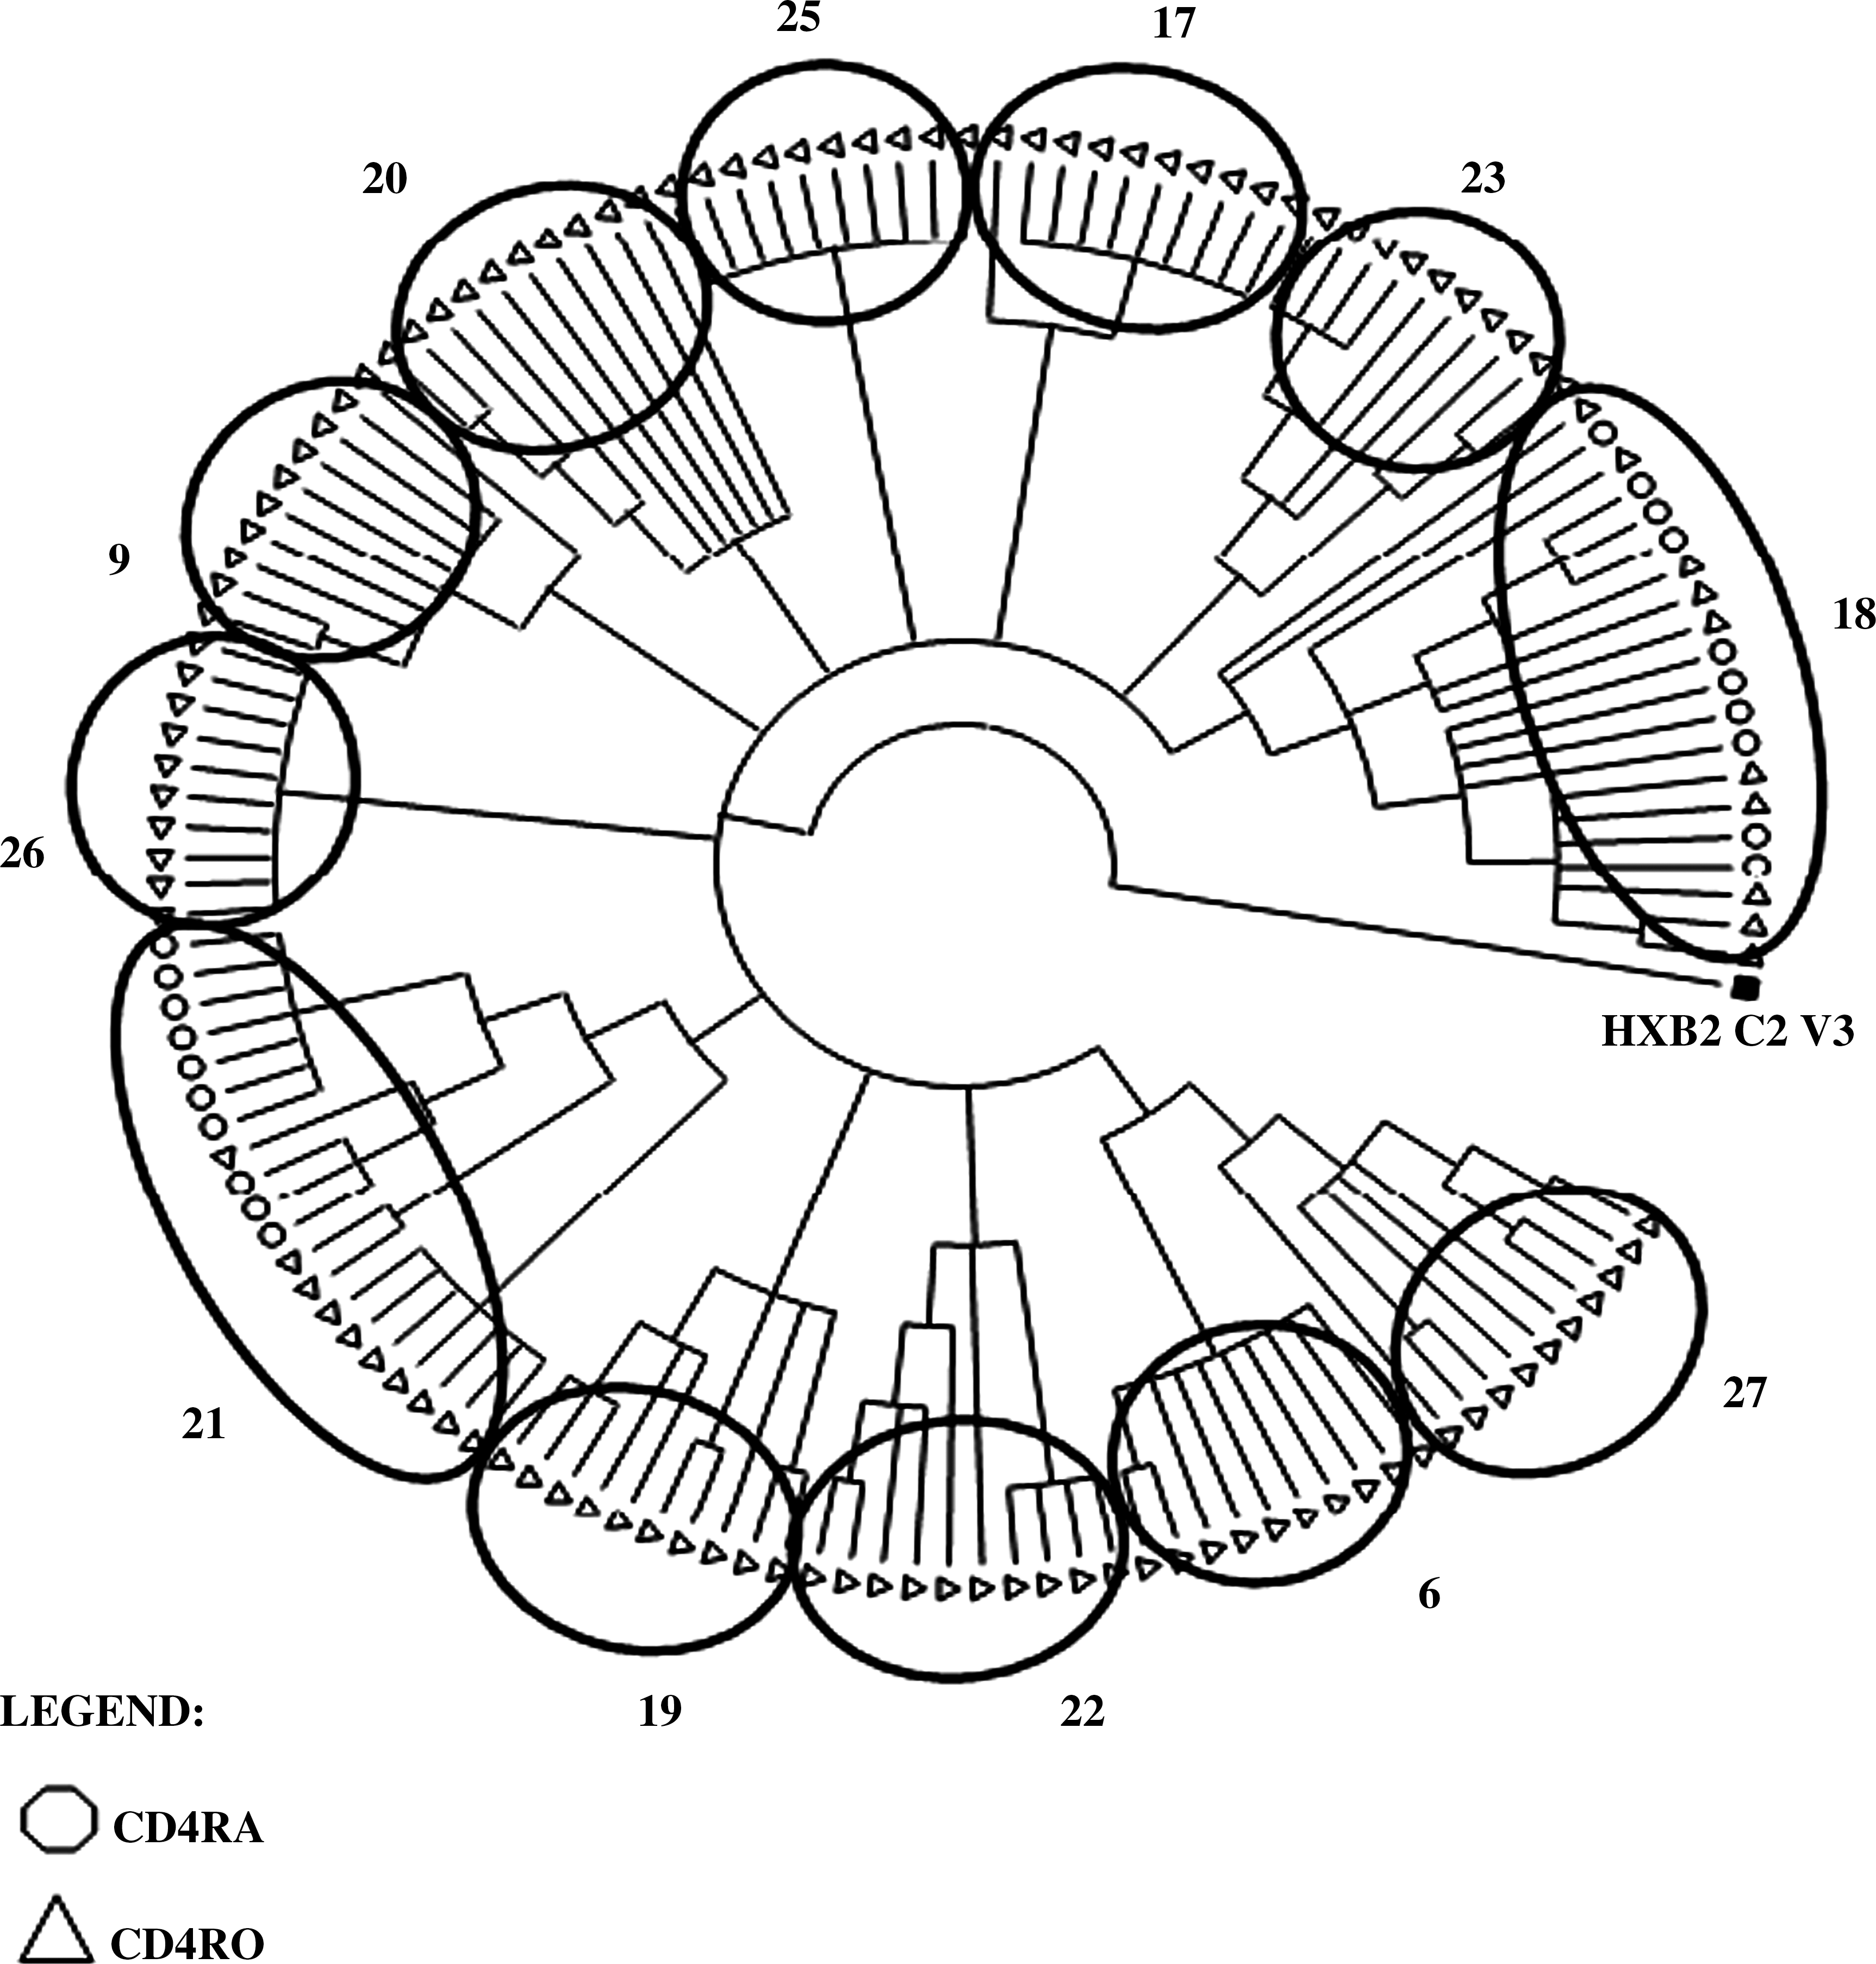
Neighbor-joining tree (MEGA) of HIV-1 env C2-V3 genetic clones isolated from the purified T cell subsets of twelve ART-naïve HIV-1 patients. For each ART-naive HIV-1 patient, C2-V3 genetic clones were isolated as described in the Figure 1 legend. Genetic relatedness among virus infecting different T cell subsets was assessed by using MEGA program, also as described in the legend to Fig. 1.
Divergence of viral sequences within each compartment and genetic distances between compartments were calculated by using the MEGA program, and the results are summarized in Table 2. Significant separation of the compartments is indicated by bold face of p values calculated by the Student's t-test. Only two samples, #21 (experienced) and 18SD (naïve), were judged to be intermingled, but in all other samples, HIV-1 in different T cell subsets were clearly distinct from each other as also visually evident. Out of six samples from therapy-experienced patients, whose mT4 and nT4 were HIV-1 positive (Fig. 1), the two T cell compartments in samples 6, 10, 14, and 25 had the virus, which was quite homogeneous with the intra- and inter-compartmental genetic distances of 0.1∼1.8% and 0.7∼3.2%, respectively. The virus in the other two samples (21 and 30) was somewhat more diverse, with the respective genetic distances of 0.3%∼4.9% and 2.4∼5.3% (p = 0.12 and 0.48 for intra- and inter-compartmental divergence). Sample 35, in which three compartments (mT4, nT4, and mT8) were HIV-1 positive, showed a similar pattern, with the intra- and inter-compartmental genetic distances ranging 0.3∼3.5% and 2.8∼3.5%, respectively. Overall, intra- or inter-compartmental genetic distances were not very much different between the therapy-experienced and -naïve groups of patients (p = 0.94 and 0.046, respectively).
Intra- and inter-compartmental genetic distances were calculated using the MEGA program.
Those compartments that harbored X4 virus are identified with
*The significance of the separation between the compartments was determined by Student's t-test (p < 0.05).
Of the four samples from therapy-experienced patients in which both mT4 and mT8 were positive for HIV-1 (Fig. 1), two (18 and 27) had intra- and inter-compartmental distances of 0.3∼1.7% and 0.7∼1.3%, respectively, in contrast to the other two (16 and 22) that showed greater inter-compartmental distances (5.8%∼14.1%) though the differences were not statistically significant (p = 0.29 and 0.60 for intra- and inter-compartmental distances). Sample 31, which was positive in three compartments, seems also to fit the former pattern. Coreceptor binding characteristics of the virus were determined in 44 compartments and included 12 X4 and 32 R5 HIV-1 strains (Table 1). Those compartments with X4 virus seemed to remain more homogeneous than those with R5 virus (intra-compartmental genetic distances of 0.4% vs. 1.6%, respectively) in both therapy-experienced (p < 0.0001) and -naïve patients (p = 0.032).
Directional HIV-1 gene flow among different T cell subsets
A Bayesian consensus tree was created in each case after 3 million generations of MCMC analysis, at which point all effective sample size parameters attained the >100 level as recommended.
26
–29
HIV-1 gene flows between the compartments, as assessed by using the MacClade program, are summarized (Table 3) for ART-experienced (top) and -naïve (bottom) patients. Overall, there seemed to be less flow among the compartments in ART-experienced than in -naïve patients, though the significance of this could not be discerned because of the small sample sizes. In ART-experienced patients, for example, HIV-1 gene flows were assessed between nT4 and mT4 in six samples (#6, 10, 14, 21, 30, and 31) and between mT4 and mT8 in four samples (#16, 22, 27, and 31). Even though a significant (>1.0) gene flow was indicated from nT4 to mT4 in case #14 (5.9), gene flows were significant in the reverse direction in three cases (#10, 21, and 30). No significant flow existed between mT8 and either CD4 T cell subset. In contrast, in two ART-naïve cases (#DR18 and DR21), HIV-1 flow seemed to be greater from nT4 to mT4 (2.4 and 16.5 vs. 1.4 and 3.4, respectively), though the statistical significance could not be deduced because of the sample size (n = 2). Figures 4 and 5a/b show consensus trees of HIV-1 clone sequences of the involved compartments from a single ART-experienced case #31 (Fig. 4) and two ART-naïve cases (Fig. 5a and b), respectively. In all analyses, 3,000,000 re-samplings achieved the effective sample size posterior probability score of >100, as calculated by the program Tracer (v 1.5) (

BEAST consensus tree and bubblegram (MacClade) of HIV-1 env C2-V3 clonal sequences isolated from three T cell compartments of patient #31. A Bayesian consensus tree (top) was created for the HIV-1 C2-V3 clones from three different T cell subsets by using BEAST program after 3 x 10⁶ resamplings. The clones from nT4, mT4, and mT8 compartments are identified by solid black, checked block, and shaded blocks, respectively. Directional gene flows of HIV-1 among the infected T cell subsets were determined by the MacClade program. Numbers in the bubbles represent the directional migration rates and those over 1.0 are considered to be significant positive flow.
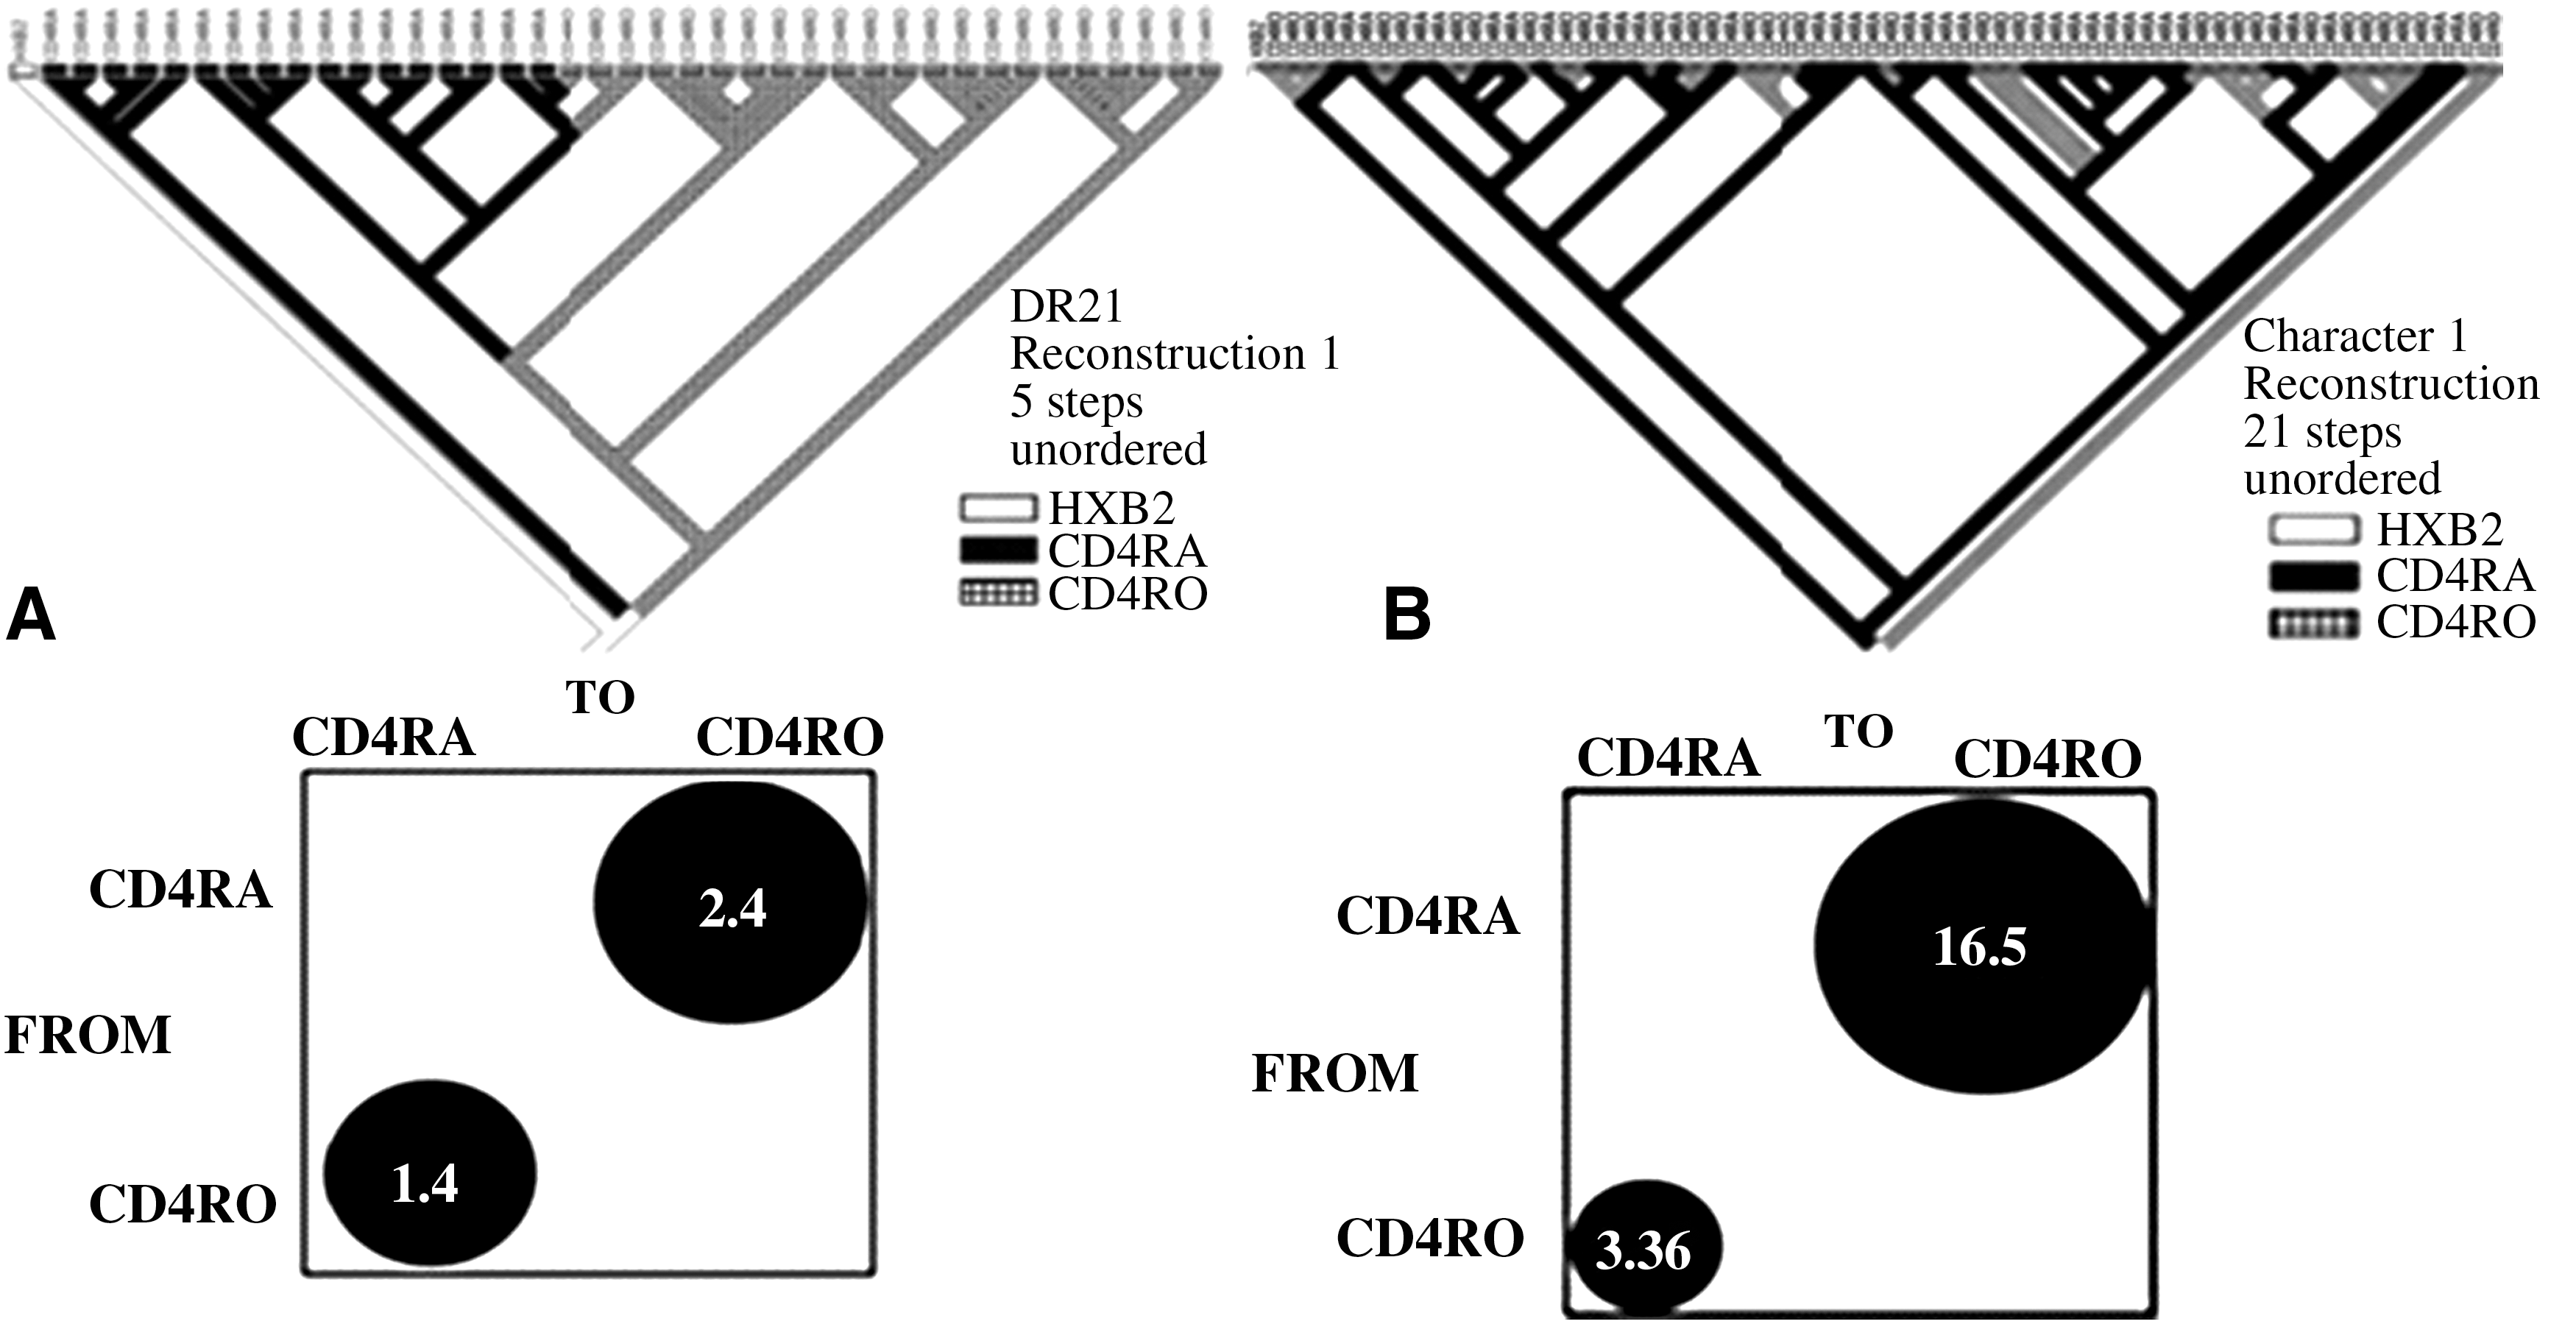
BEAST consensus trees and bubblegrams (MacClade) of HIV-1 env C2-V3 clonal sequences isolated from the nT4 and mT4 compartments of ART-naïve patients DR18
Discussion
The memory CD4 T cell (mT4) subset has long been identified as the major target of HIV-1 infection. 10 –13 Indeed, in 33 patients studied, 31 out of 45 (69%) HIV-1-positive compartments were mT4, and among therapy-naïve samples the prevalence rose to 86% (12 of 14). However, other T cell compartments were also HIV-1 infected, particularly in therapy-experienced patients. In total, 31 T cell compartments were HIV-1 positive in 21 therapy-experienced patients (1.48 compartments per patient) as opposed to 14 compartments in 12 therapy-naïve patients (1.17 compartments per patient). It may be argued that the slightly higher number of HIV-1-infected T cell compartments in the former group (p = 0.170; Fisher's exact test) probably reflected longer infection times (older infections) than that found in the latter. While this could not be accurately assessed, the similarity of intra- and inter-compartmental divergence rates in both groups tends to argue against the reasoning. Furthermore, the number of HIV-1-positive T cell compartments was not directly associated with the CD4 T cell counts in the compartments of either group. Because the viral loads of the majority of the participants were unknown, it was not possible to determine the possible influence of viral loads on the number of compartments infected. However, as the presence of provirus, particularly in memory subsets, would not require infection by current viral replication, it is unlikely that a strong correlation would exist between a single viral load measurement and compartmental distribution.
In therapy-naïve patients, no CD8 T cell compartment was HIV-1 infected. The numbers of CD8 cells in naïve samples were uniformly higher, indicating that the absence of infection was not due to lack of the target cells. The virus could be detected in five mT8 and one nT8 compartment in the therapy-experienced patients (Table 1). Of the five mT8-positive samples (#16, 18, 22, 27, and 31), which were also HIV positive in either mT4 or nT4 (or both in #31), three (#16, 18 & 22) had R5 virus exclusively, while the other two had X4 in at least one compartment. Interestingly, sample #31 harbored R5 virus in mT4 but X4 in the nT4 and mT8 compartments. Sample #13, the only sample that was positive in the nT8 compartment, also harbored X4 virus. The ratio of compartments infected by X4 vs. R5 virus was 8/23 (0.348) in the ART-experienced group as compared to 4 /10 (0.400) in the ART-naïve group (p = 0.558). Since X4 virus generally appears at later stages of HIV-1 infection, a similar X4/R5 ratio may also support our assumption that the length of infection was not significantly different between the two groups. A previous study demonstrated that nT4 cells were primarily infected by syncytium-inducing (i.e., X4) virus 13 . Our present study suggests that this may only apply to therapy-naïve cases where both of the HIV-positive nT4 compartments harbored X4 virus. In contrast, only two out of six HIV-1–positive nT4 compartments of the ART-experienced patients harbored X4 virus. There are a few previous studies that monitored the proviral DNA changes of the coreceptor requirements during antiretroviral therapies. 32 However, none of them to our knowledge examined the differences among the HIV-1 compartments in different T cell subsets. While a previous report 13 characterized the infection of the nT4 compartment by X4 virus as being directly associated with the decline of CD4 T cell count, it should also be noted that both of our therapy-naïve patients who harbored X4 virus in the nT4 compartment had CD 4 T cell counts of more than 1,000. At present, we have no reasonable explanation for this difference.
Our attempt to determine the direction of viral gene flow among the T cell subcompartments did not yield conclusive results, largely due to the small number of samples that were HIV-1 positive in more than one compartment. Sample #31, which was positive in 3 T cell compartments including nT4, mT4, and mT8, requires a more careful analysis. While all of the other samples contained either X4 or R5 virus exclusively in any of their compartments, mT4 harbored R5 virus, while two other (nT4 and mT8) compartments harbored X4 virus. The HIV-1 infected mT8 compartment was previously suggested to represent “prothymic” CD4+CD8+ T cells that were infected by CD4-binding virus, which then further differentiated as CD4-CD8+ T cells. 16 Alternatively, the subset may represent activated, cytotoxic CD8 T cells that were HIV-1 infected. A number of studies have demonstrated that in vitro costimulation of peripheral CD8 T cells with anti-CD3 and anti-CD28 monoclonal antibodies induced the expression of CD4 markers. 34 –37 When infected by HIV-1 through the newly expressed CD4 receptor, 38 the receptor becomes again downregulated as the viral replication begins. 39 –41 . Such cells may be phenotypically identical to HIV-1–positive mT8 described above. It is interesting to note that inter-compartmental genetic distances were seemingly smaller when two T cell compartments were infected by X4 virus (e.g., samples #27), which involved mT4 and mT8, and #14, in which nT4 and mT4 were infected by X4 virus. In comparison, when more than one T cell compartment was infected by R5 virus, inter-compartmental genetic distances were significantly larger. Sample #31, in which X4 virus was identified in nT4 and mT8, while R5 virus was associated with the mT4 compartment, seemed to follow the pattern associated with R5 virus infection. Obviously, this observation needs to be further investigated with a larger number of samples. It should, however, be added that intra-compartmental divergence rates were also smaller when X4 virus was involved than when the involved compartments were infected by R5 virus.
The present findings obviously have several limitations. First of all, the PCR detection of HIV-1 cDNA in any of the isolated T cell compartments was limited by our current technology. It is not possible to rule out those other T cell compartments, which we failed to amplify, that still contained a very low copy number of HIV-1 cDNA. This may be particularly important in samples from ART-naïve patients. In the present study, two out of ten ART-naïve samples were HIV-1 positive in two compartments. It is therefore possible that HIV-1 infection in more than one compartment may occur in ART-naïve patients more often than our current data indicate. However, it is safe to suggest that the HIV-1 viral burden in any T cell compartments other than mT4 is very light in ART-naïve patients. Our current technique is capable of amplifying and then sequencing 2 cDNA copies of the HIV-1 C2-V3 gene per reaction mixture. We will attempt to further concentrate the possible HIV cDNA template or, alternatively, to increase the number of sorted T cell subset in our future experiments. Additionally, PCR amplification followed by cloning that was used in our present study may be technically biased for selecting the majority viral populations. Consequently, the diversity estimated for each compartment may be significantly underestimated as previous discussed by Liu et al. 42 We tried to partially correct this bias by using a serial dilution of each template and picking amplicons at the limiting dilution and at x100 highest concentrationfor cloning. 20,21 However, because of the small number of clones used for analysis, such biases may still remain.
Even though our attempts to determine the direction of viral gene flow among different T cell subsets did not yield conclusive evidence, this type of analysis is important for determining how HIV-1 migrates among different target T cell populations. Even though a consistent directional flow of the virus could not be proven, there was an indication of strong gene flow from nT4 to mT4 in case #14 (5.9), while reverse directional flows (i.e., from mT4 to nT4) of 2.0 (case #10) and 3.0 (case #21) were also detected. Viral flows between mT4 and mT8 were negligible in all cases involved. We are currently utilizing the presence of drug resistance-associated and synonymous mutations in the viral pol gene as the additional determinants of the directional viral flow among T cell subsets in ART-experienced patients, the results of which, however, will be described elsewhere.
Footnotes
Acknowledgments
The present study was supported in part by RCMI infrastructure Grant G12RR003050 and CCHD Grant U54 RR019507, both of which were awarded by the NIH-NCRR. Thanks go to the RCMI Publications Office, to Mr. Bob Ritchie in particular, for editing this manuscript.
Author Disclosure Statement
No competing financial interests exist.