
Abstract
We characterized lipid and lipoprotein changes associated with a lopinavir/ritonavir-containing regimen. We enrolled previously antiretroviral-naive patients participating in the Swiss HIV Cohort Study. Fasting blood samples (baseline) were retrieved retrospectively from stored frozen plasma and posttreatment (follow-up) samples were collected prospectively at two separate visits. Lipids and lipoproteins were analyzed at a single reference laboratory. Sixty-five patients had two posttreatment lipid profile measurements and nine had only one. Most of the measured lipids and lipoprotein plasma concentrations increased on lopinavir/ritonavir-based treatment. The percentage of patients with hypertriglyceridemia (TG >150 mg/dl) increased from 28/74 (38%) at baseline to 37/65 (57%) at the second follow-up. We did not find any correlation between lopinavir plasma levels and the concentration of triglycerides. There was weak evidence of an increase in small dense LDL-apoB during the first year of treatment but not beyond 1 year (odds ratio 4.5, 90% CI 0.7 to 29 and 0.9, 90% CI 0.5 to 1.5, respectively). However, 69% of our patients still had undetectable small dense LDL-apoB levels while on treatment. LDL-cholesterol increased by a mean of 17 mg/dl (90% CI −3 to 37) during the first year of treatment, but mean values remained below the cut-off for therapeutic intervention. Despite an increase in the majority of measured lipids and lipoproteins particularly in the first year after initiation, we could not detect an obvious increase of cardiovascular risk resulting from the observed lipid changes.
Introduction
L
Most previous studies of lipid abnormalities in patients treated with a LPV/r-based cART have some limitations: either cART-experienced patients were also recruited, 4,16 –21 measurements were made irrespective of fasting status, 2 or not all relevant lipid and lipoproteins were measured. 3,22 –24
The aim of our study was a detailed assessment of lipids and lipoproteins in fasting cART-naive patients before and twice during an LPV/r-based therapy. In particular, we investigated risk factors associated with development of hypertriglyceridemia and the possible association between TG and slightly triglyceride-enriched VLDL, sdLDL, and LPV plasma levels.
Materials and Methods
Study design and population
The Swiss HIV Cohort Study (SHCS) is a prospective multicentric cohort study that enrolled more than 15,600 HIV-infected persons aged 16 years or older at seven outpatient clinics or specialized private practices (
Laboratory parameters
Citrate plasma was obtained by centrifugation of blood for 20 min at 1500 × g and deep-frozen at −80°C until analysis. VLDL were separated by ultracentrifugation (Airfuge, Beckman Coulter, Krefeld, Germany) at a density of 1.006 g/ml (4 h, 20°C, 95,000 rpm) using an A-95 rotor with 8 × 20-mm Ultra-Clear tubes. LDL-cholesterol (LDL-C) was determined after removal of VLDL in the resulting infranatant by subtracting HDL-cholesterol (HDL-C) from TC concentration. TC, HDL-C, and TG in plasma and lipoprotein fractions were determined with commercially available enzymatic assays (Synchron CX5, Beckman Coulter, Krefeld, Germany), apolipoprotein B (apoB) and lipoprotein (a) [Lp(a)] by turbimetry using the same equipment. The antibody against Lp(a) used for the assay was purchased from Technoclone, Vienna, Austria, and antibodies against apoB from Beckman Coulter, Krefeld, Germany. sdLDL-apoB was determined after ultracentrifugation at a density >1.044 g/ml in the resulting infranatant. All procedures and methods were checked for their compatibility with citrate plasma. The obtained values were corrected according to the dilution of blood with sodium citrate. All determinations were performed in a central laboratory. The presence of slightly triglyceride-enriched VLDL was detected by a VLDL-triglyceride/VLDL-apoB ratio between 6 and 8. A ratio below 6 defined normally composed VLDL, while a ratio >8.0 defined triglyceride-rich VLDL. A concentration >13.5 mg/dl of sdLDL-apoB was regarded as abnormally high, while the detection limit was 5.3 mg/dl. Lipid and lipoprotein values were defined according to the thresholds established by the U.S. NCEP. CD4 T lymphocytes were quantified by flow cytometry. The plasma HIV-1 RNA level was measured by a PCR assay (Amplicor HIV monitor; Roche Diagnostic System; limit of detection <50 copies/ml). LPV concentrations were measured in plasma extracted before the morning dose (C through), using a validated high-performance liquid chromatography (HPLC) method.
Statistical analysis
A paired t-test is appropriate if there is a constant difference between baseline and follow-up measurements on the same patient. We fit models that assume that this difference (between baseline and follow-up) was not constant but varied with time on LPV/r. In our models, time on LPV/r was represented by a linear spline 25 and this allows us to estimate the rate of change (per year) during the first year after starting and beyond 1 year. We give 90% confidence intervals for these estimates in order to focus on the clinical implications of the range of values in the interval. 26 Because most patients contributed two sets of data to each model (most have two follow-up measurements), we estimated intervals using robust standard errors calculated using generalized estimating equations (and assuming an independent working correlation 27 ). We also adjusted estimates for a set of prespecified covariates (gender, smoking status, and baseline age, BMI, CD4 counts per 100, and log10 viral RNA) in order to estimate the rate of change for a “reference patient”—a male smoker with other covariates set at typical values (40 years, 25 kg/m2, 200 cells/μl, 5 log10 copies/ml; see Table 1).
For most lipid parameters, the outcome was the difference between baseline and follow-up measurements with models fit by linear regression. However, for two parameters, models were fit using logistic regression. For sdLDL-apoB, more than half of the values were below the limit of detection; therefore the response for this parameter was whether the follow-up measurement was known to be higher than at baseline. For the ratio of VLDL-TG to VLDL-apoB, the response was whether the follow-up measurement was more atherogenic than at baseline, with the absolute difference between the observed ratio and 7.0 used as a measure of atherogenic risk. We also tested a limited number of prespecified hypotheses about associations between increases in TG and changes in other parameters. These were tested by replacing time on LPV/r in our models with the level of another parameter and we illustrate these associations using graphs. We used Intercooled Stata Version 9.2 for analyses and R 2.5.1 for graphics.
Results
Population and treatment outcome
We identified 84 patients initiating an LPV/r-based therapy. Ten of these patients were excluded due to previous use of NRTIs or NNRTIs. Sixty-five (88%) patients had their lipid profiles measured prospectively at two consecutive SHCS visits, while nine (12%) had only one follow-up measurement (due to a change of antiretroviral therapy). The median time between start of LPV/r and the first follow-up was 15 months (range 1–51 months), while the median time between the first and the second follow-up was 6 months (range 1–13 months), resulting in a median time between start of LPV/r and the second follow-up of 22 months (range 5–58 months). Baseline characteristics of patients are shown in Table 1.
LPV/r-based therapy led to a reduction of median viral load from 5.1 (range 1.7–7.8) to 1.7 (range 1.7–3.3) log10 copies/ml at follow-up 1 and 2. Of note, 66 (89%) patients at follow-up 1 and 62 (95%) at follow-up 2 had an undetectable HIV-1 RNA (<50 copies/ml). Meanwhile, median CD4 cell count increased from 179 (range 2–675) at baseline to 363 (range 51–915) and 411 (range 32–827) at follow-up 1 and 2, respectively (Table 2).
All values are given as median and range.
Lipids and lipoproteins
Lipid and lipoprotein values before and changes after the initiation of an LPV/r-based cART are summarized in Table 3.
Change was modeled as two slopes, during the first year and beyond the first year, and estimates were adjusted for six covariates (gender, smoking status, and baseline age, body mass index (BMI), CD4 counts per 100, and log10 HIV-1 RNA).
All values are mg/dl (except ratios and proportions).
Since most patients were below the detection limit, we report the percentage of patients with a detectable level at baseline and adjusted odds ratio for whether follow-up measurements were known to be higher than at baseline.
Here we report the percentage of patients with an atherogenic VLDL-triglycerides/VLDL-apoB ratio at baseline and estimate the adjusted odds ratio of having a more atherogenic ratio over time on treatment, with the absolute difference between the observed ratio and 7.0 used as a measure of atherogenic risk.
At baseline the mean values of TC, HDL-C, LDL-C, and TG were 113 (SD 30) mg/dl, 28 (SD 8) mg/dl, 61 (SD 21) mg/dl, and 141 (SD 74) mg/dl, respectively. LDL-C ≥130 mg/dl (a threshold regarded as significantly atherogenic according to U.S. NCEP guidelines) was present in 1/74 patients (1%). Low HDL-C levels (<40 mg/dl) were found in 69/74 patients (93%). Moreover, 28/74 patients (38%) had TG >150 mg/dl. Atherogenic slightly triglyceride-enriched VLDLs (defined by a VLDL-TG to VLDL-apoB ratio between 6 and 8) were present in 13/74 patients (18%). sdLDL-apoB values were below the detection limit in 66/74 patients (89%) and 1/74 patients (1%) had elevated concentrations (>13.5 mg/dl). Elevated levels of Lp(a) (>30 mg/dl) were present in 11/74 patients (15%).
After initiation of LPV/r-based cART, TG had a mean increase of 110 mg/dl (90% CI 15–210) during the first year of treatment followed by little change beyond 1 year of treatment (a decrease of 7 mg/dl, 90% CI −42 to 28, Fig. 1A). The percentage of patients with hypertriglyceridemia (TG >150 mg/dl) increased from 28/74 (38%) at baseline to 38/74 (51%) and 37/65 (57%) at follow-up 1 and 2, respectively. We also tested a prespecified hypothesis that hypertriglyceridemia on treatment represents a worsening of a preexisting condition by adding an interaction term to our model between TG at baseline and time on treatment. This interaction term was estimated to be negative implying that higher baseline values of TG show smaller increases over time than lower baseline values of TG (Fig. 1B). Moreover, we found a small decrease in TG for patients with higher HDL-C levels (−5.5 mg/dl in TG, 90% CI −8.8 to −2.1, for each mg/dl increase in HDL-C, see also Fig. 2A). There was no obvious increase in the atherogenicity of the VLDL-TG to VLDL-apoB ratio in either the first or subsequent years (odds ratio 0.6, 90% CI 0.2 to 2.6, and 1.1, 90% CI 0.7 to 1.8, respectively). Consistent with these estimates, the percentage of patients with an atherogenic ratio of VLDL-TG to VLDL-apoB was relatively constant with 13/74 (18%) patients at baseline and 14/74 (19%) and 13/65 (20%) patients at follow-up 1 and 2, respectively. Moreover, we observed a roughly linear relationship between the TG and VLDL-TG/VLDL-apoB ratio (Fig. 2B).
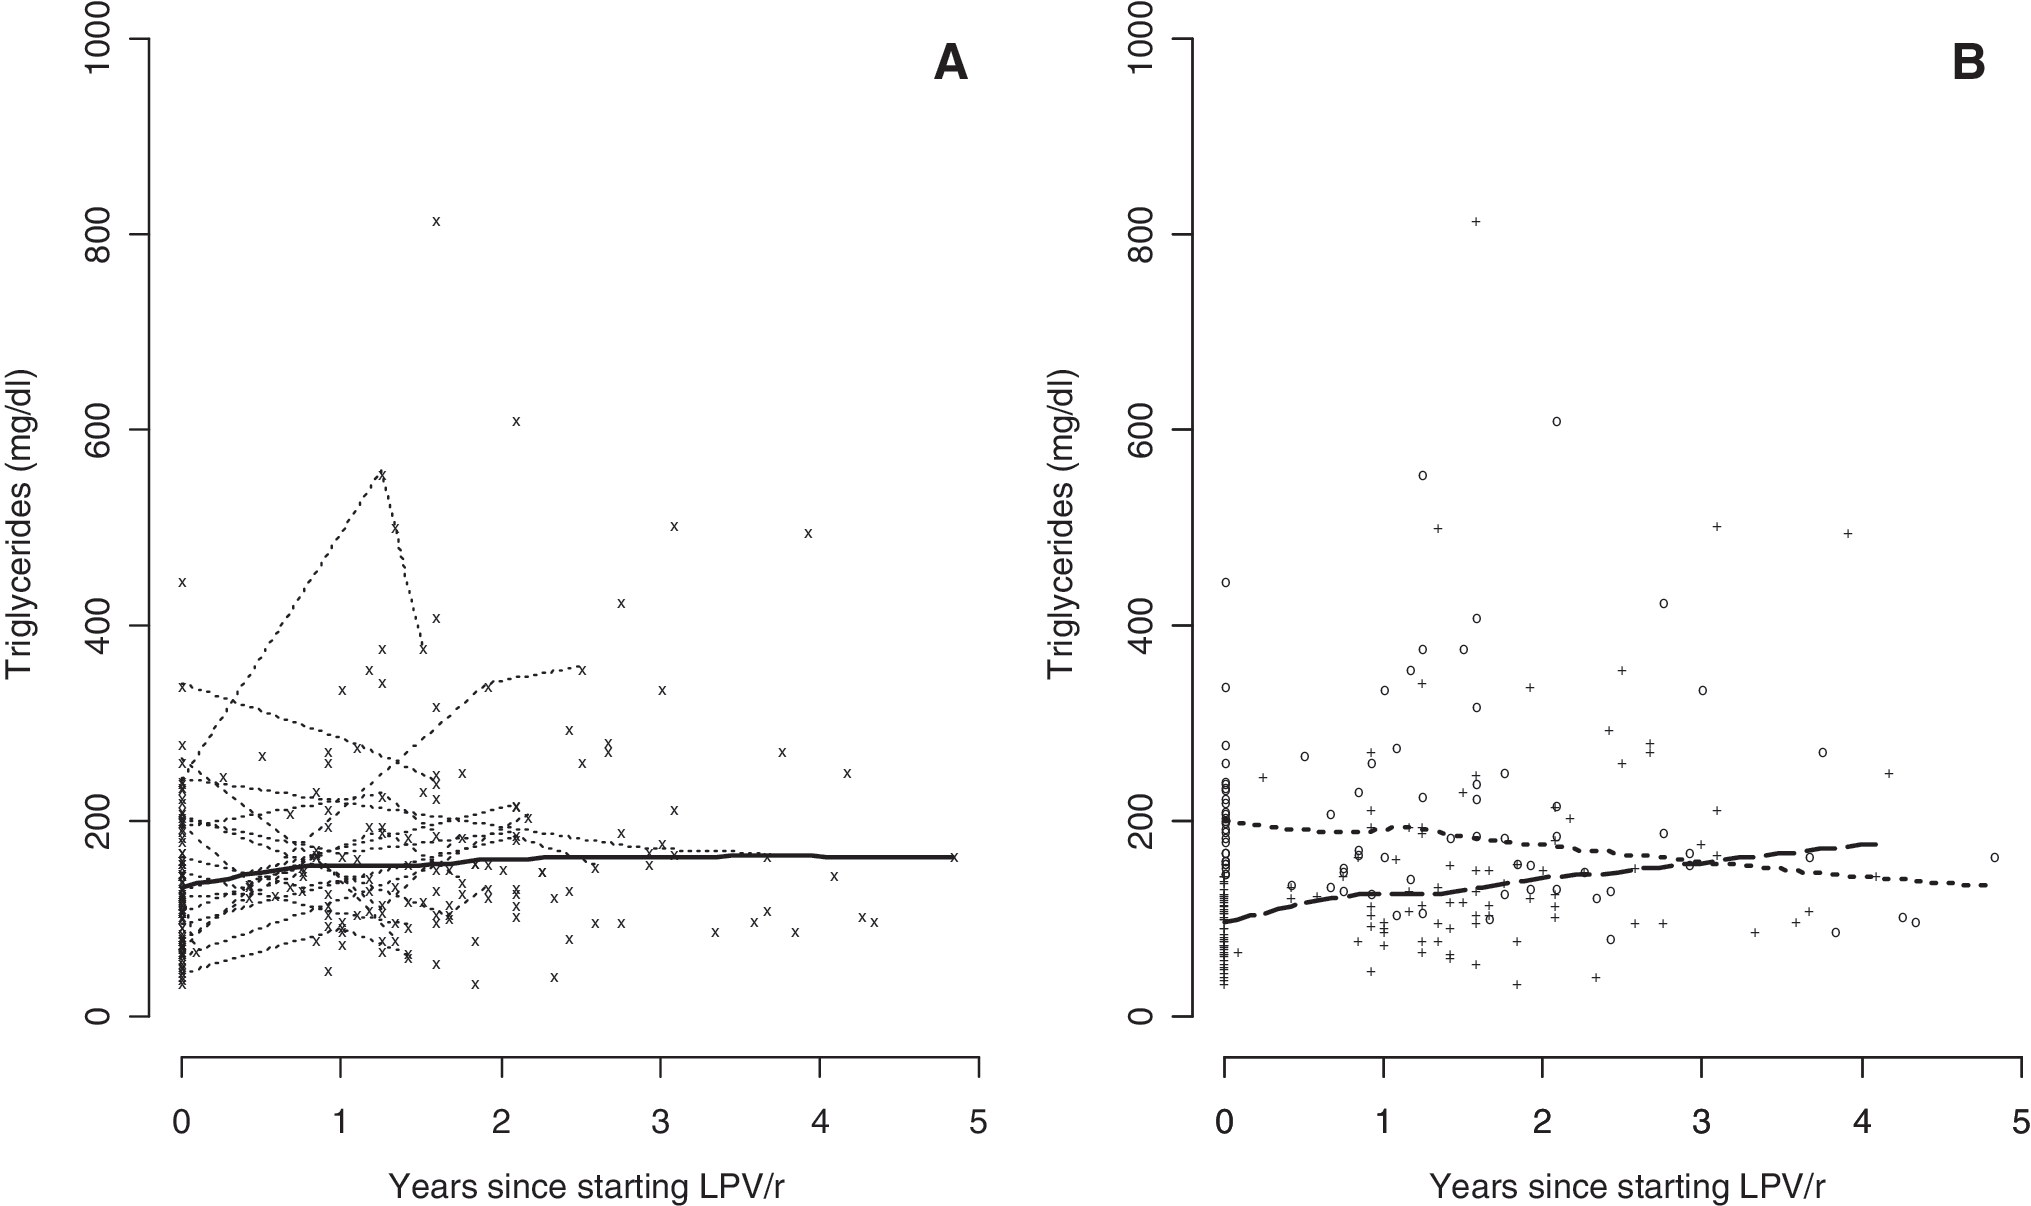
Triglyceride levels over time for 74 patients treated with an LPV/r-containing regimen.
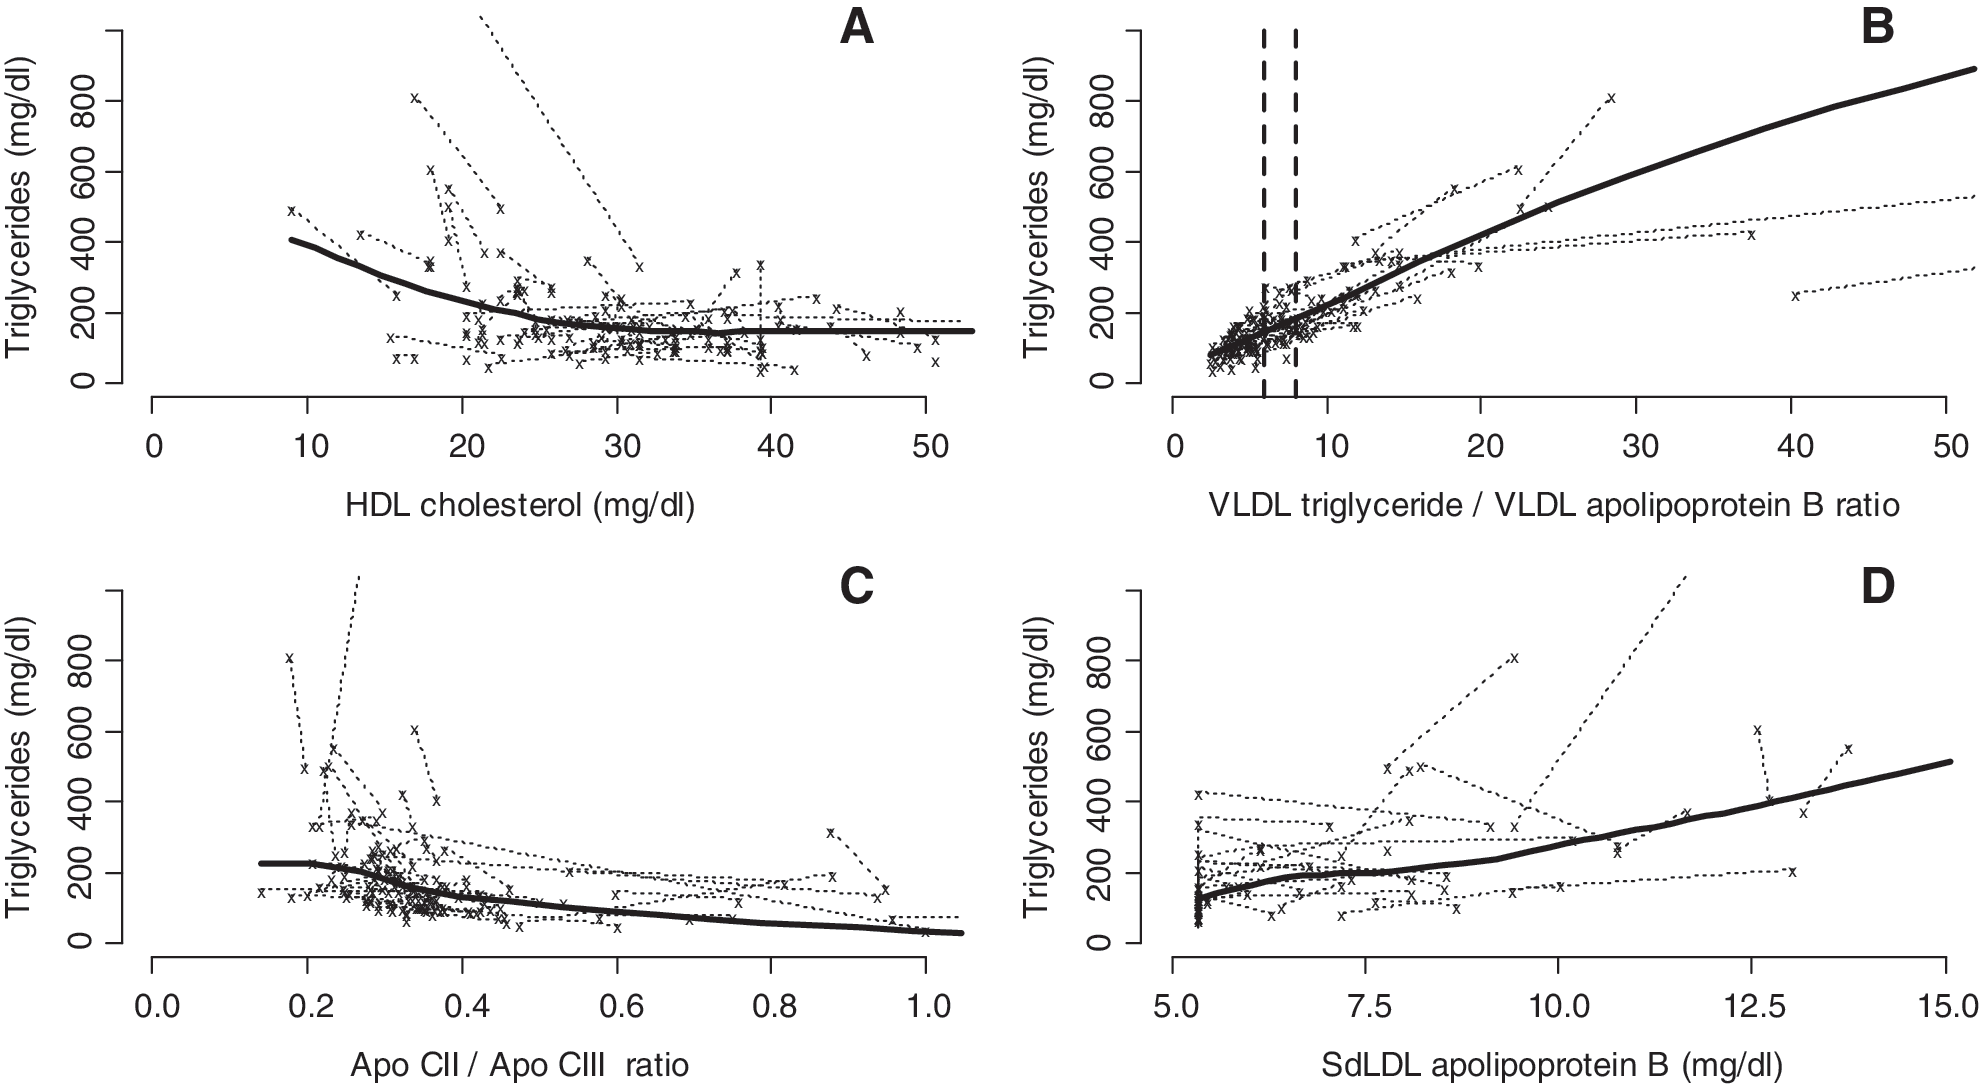
Triglyceride versus other lipid levels for 74 patients on an LPV/r-containing regimen.
The apoCII to apoCIII ratio declined by a mean 0.22 (90% CI −0.39 to −0.05) during the first year of treatment and remained stable thereafter. The decline of this ratio was driven by a sizable increase in apoCIII during the first year of treatment (7.5 mg/dl, 90% CI 4.1 to 11). There was weak evidence of a small decrease in TG for patients with higher apoCII to apoCIII ratios (−25 mg/dl, 90% CI −62 to 12 change in TG per unit change in the apoCII to apoCIII ratio; see also Fig. 2C). There was weak evidence of an increase in sdLDL-apoB during the first year of treatment but not beyond 1 year (odds ratios 4.5, 90% CI 0.7 to 29, and 0.9, 90% CI 0.5 to 1.5). Consistent with these estimates, 66/74 patients (89%) had a concentration of sdLDL-apoB below the detection limit at baseline compared with 51/74 (69%) patients and 45/65 (69%) patients at follow-up 1 and 2, respectively. Accordingly, few follow-up measurements (40/139) showed an increase in the level of sdLDL-apoB; most of them (99/139) showed no discernible change or a decrease. However, in patients with detectable sdLDL-apoB at follow-up, we found a higher increase in TG from baseline to follow-up compared to patients with sdLDL-apoB below the detection limit at follow-up (by 144 mg/dl 90% CI 83 to 205, see also Fig. 2D). Highly atherogenic concentrations of sdLDL-apoB (>13.5 mg/dl) were found in 2/74 (3%) and 0/65 patients at follow-up 1 and 2, respectively, compared to 1/74 (1%) at baseline.
TC had a mean increase of 45 mg/dl (90% CI 20 to 71) during the first year of treatment followed by little change beyond 1 year of treatment (a mean decrease of 3.1 mg/dl, 90% CI −10 to 4.3).
LDL-C had a mean increase of 17 mg/dl (90% CI −3 to 37) during the first year of treatment followed by little change beyond 1 year of treatment (a mean increase of 0.3 mg/dl, 90% CI −5.1 to 5.6). LDL-C ≥130 mg/dl was found in 2/74 (3%) and 1/65 patients (2%) at follow-up 1 and 2, respectively, compared with 1/74 (1%) at baseline.
HDL-C had a mean increase of 6.7 mg/dl (90% CI 0.3 to 13) during the first year of treatment followed by little change beyond 1 year of treatment (a mean decrease of 0.7 mg/dl, 95% CI −2.9 to 1.5). The number of patients with HDL-C >40 mg/dl increased from 5/74 (7%) at baseline to 9/74 (12%) and 7/65 (11%) at follow-up 1 and 2, respectively.
Lp(a) had a mean increase of 3.2 mg/dl (95% CI −5.7 to 12) during the first year of treatment followed by little change beyond 1 year of treatment (a mean decrease of 0.7 mg/dl, 90% CI −2.4 to 1.0). Elevated plasma levels of Lp(a) (>30 mg/dl) were found in 13/74 (18%) and 11/65 patients (17%) at follow-up 1 and 2, respectively, compared to 11/74 patients (15%) at baseline.
Lopinavir plasma level and triglycerides
During the study period nine patients had only one measurement of LPV through plasma concentration, while 65 had two. The mean through plasma concentrations of LPV were 5.9 (SD 3) μg/ml and 6.2 (SD 4) μg/ml at the first and the second follow-up, respectively. We did not observe any obvious increase in TG with increasing plasma levels of LPV (0.1 mg/dl increase in TG, 90% CI −7.7 to 7.9, Fig. 3).

Lopinavir plasma levels and triglyceride for 74 patients treated with an LPV/r-containing regimen. A nonparametric average response curve is shown (calculated using the default LOESS function in R 2.5.1) and the two values per patient are connected for each patient.
Discussion
HIV infection has itself a profound impact on lipid and lipoprotein metabolism that is further influenced by antiretroviral drugs. In a population of 74 previously treatment-naive HIV-infected patients we found that most of the lipid and lipoprotein plasma levels increased after initiation of an LPV/r-based cART. When time on treatment was considered most of these increases tended to occur during the first year of cART and reached a plateau in the following years, as in previous reports. 3,5,19
As expected in a fairly advanced and untreated HIV population, 10,28 TGs were already elevated at baseline in more than one-third of our patients, with a further increase of the percentage of patients with hypertriglyceridemia (TG >150 mg/dl) at follow-up. Triglycerides markedly increased only during the first year of an LPV/r-based cART. However, higher baseline values of TG were followed by a lower increase over time. In other words the odds of having elevated triglycerides on LPV/r therapy was lower in those patients who already had elevated triglycerides at baseline. This result is in contrast with data from other publications, 3 –5,19 but is consistent with the results of a previous SHCS study involving patients on a PI other than LPV/r. 7
We could not confirm a correlation between increase in TG and higher LPV plasma concentration as reported in some, 18,24,29 but not all studies. 21,30
Hypertriglyceridemia is characterized either by a normal number of large, triglyceride-rich VLDLs or an increased number of small VLDLs that are relatively poor in TG and rich in cholesterol (slightly triglyceride-enriched VLDL). The latter particles carry a strongly increased risk of coronary heart disease as shown in patients with familial combined hyperlipidemia. As one VLDL contains one molecule of apoB, the ratio of VLDL-TG to VLDL-apoB can be used to determine VLDL composition 31 –33 and to better estimate atherogenicity in patients with hypertriglyceridemia. In this study, there was no obvious increase in the atherogenicity of the VLDL-TG to VLDL-apoB ratio in either the first or subsequent years of treatment. The percentage of patients with atherogenic slightly triglyceride-enriched VLDL did not change appreciably after initiation of LPV/r-based cART. Moreover, we found a positive correlation between the increase in TG and a higher VLDL-TG to VLDL-apoB ratio. This suggests that in HIV-positive patients treated with antiretroviral therapy there is a predominance of large, triglyceride-rich VLDL, similarly to the VLDL pattern seen in familial hypertriglyceridemia associated with a low cardiovascular risk. 31
We observed an important increase in apoC3 concentration and a concomitant decrease of the apoC2 to apoC3 ratio after the initiation of a LPV/r-based cART, in agreement with previous studies. 16,17,34 Since apoC2 stimulates the catabolism of VLDL via lipoprotein lipase, while apoC3 inhibits this pathway, our data support the hypothesis of a decreased activation of lipoprotein lipase as a key factor in the observed increase of TG. 16,17,35 Moreover, genetic variants of apoC3 have been found to be associated with extreme hypertriglyceridemia in patients treated with ritonavir-boosted PIs, introducing genetic variability as an additional factor in the pathogenesis of cART-associated hypertriglyceridemia. 11
sdLDL-apoB, an emerging atherogenetic risk factor, 15 is thought to mediate the cardiovascular risk of certain hypertriglyceridemias. 36,37 Atherogenicity of sdLDL-apoB is due to a great capacity to infiltrate the arterial wall, a reduced affinity for the LDL receptors, and an increased susceptibility to ex vivo oxidation. 38 Although most of our population had undetectable values of sdLDL-apoB (below 5.3 mg/dl) before and after initiation of an LPV/r-based cART, patients with detectable sdLDL-apoB had, on average, a higher increase in TG from baseline to follow-up. Yet highly atherogenic concentrations of sdLDL-apoB were found only in a small proportion of subjects before and after an LPV/r-based cART. 39,40 Other studies reporting on elevated sdLDL-apoB before and after starting a cART with LPV/r may be influenced by a previous treatment, since they were conducted on patients who switched to a new regimen because of virologic failure or drug intolerance. 16,17
The majority of our study population had low TC and LDL-C mean values before starting antiretroviral treatment. Although both TC and LDL-C increased in the first year after the initiation of LPV/r, the mean follow-up values remained far below the recommended therapeutic goal for LDL-C according to the U.S. NCEP guidelines. Moreover, after the initiation of an LPV/r-based cART only <3% of our population had LDL-C values regarded as significantly atherogenic (≥130 mg/dl).
We found a minimal increase of HDL-C in the first year after initiation of an LPV/r-based cART. Nevertheless, the percentage of patients with protective HDL-C values (>40 mg/dl) increased from 7% at baseline to 12% on cART.
Lp(a), another emerging atherogenetic risk factor, 15 tended to increase in the first year after the initiation of LPV/r. However, the percentage of patients with elevated values associated with premature development of atherosclerosis (>30 mg/dl) did not increase on LPV/r-based cART.
The well-characterized population of cART-naive HIV-infected patients enabled us to obtain an extensive assessment of lipids and lipoproteins before and after the initiation of an LPV/r-based cART. Laboratory samples were collected in a fasting status and analyzed in a single reference laboratory. However, the size of our population was relatively small, although larger than the majority of previous studies that have reported on this topic. The different NRTIs used in combination with LPV/r could have influenced the lipid profile, as it has been shown for zidovudine and stavudine. 41 Finally, the use of frozen plasma samples prevented standardization of the intervals between baseline and follow-up assessment of lipid and lipoproteins. However, our models allowed for variation in the timing of assessments. Similarly, we were not able to measure additional laboratory parameters, i.e., lipoprotein lipase and hepatic lipase, that could have been valuable to clarify some of the pathogenic pathways.
In conclusion, the majority of the measured lipids and lipoproteins were shown to increase on an LPV/r-based cART. We could not demonstrate a significant change in the percentage of patients with atherogenic plasma levels of lipoproteins commonly associated with hypertriglyceridemia, such as slightly triglyceride-enriched VLDL and sdLDL-apoB. However, the risk of cardiovascular events in our population remains a concern mainly due to the high percentage of patients with low HDL, 42 frequent smoking, 43 and inflammatory factors associated with HIV infection. 44
Footnotes
Acknowledgments
We thank all involved physicians, study nurses, and most importantly participants of the SHCS. This study has been financed in the framework of the Swiss HIV Cohort Study, supported by the Swiss National Science Foundation, and by an unrestricted grant from Abbott Laboratories.
The members of the Swiss HIV Cohort Study are Barth J, Battegay M, Bernasconi E, Böni J, Bucher HC, Bürgisser P, Burton- Jeangros C, CalmyA, Cavassini M, Dubs R, Egger M, Elzi L, Fehr J, Fischer M, Flepp M, Francioli P (President of the SHCS), Furrer H (Chairman of the Clinical and Laboratory Committee), Fux CA, Gorgievski M, Günthard H (Chairman of the Scientific Board), Hasse B, Hirsch HH, Hirschel B, Hösli I, Kahlert C, Kaiser L, Keiser O, Kind C, Klimkait T, Kovari H, Ledergerger B, Marinetti G, Martinez de Tejada B, Müller N, Nadal D, Pantalco G, Rauch A, Regenass S, Richenbach M (Head of Data Center), Rudin C (Chairman of the Mother & Child Substudy), Schmid P, Schultze D, Schöni-Affolter F, Schüpbach J, Speck R, Taffé P, Tolenti A, Trkola A, Vernazza P, von Wyl V, Weber R, Yerly S.
Author Disclosure Statement
No competing financial interests exist.