
Abstract
To monitor the mitochondrial transmembrane potential (ΔΨm), peripheral blood mononuclear cells (PBMCs) from 18 HIV-uninfected individuals completing a 4-week course of HIV postexposure prophylaxis (PEP) with emtricitabine/tenofovir and lopinavir/ritonavir were analyzed. ΔΨm was assessed by FACS analysis after staining with JC-1 using a mixed effects regression analysis. Apoptosis was determined by Annexin-V-FITC and propidium iodide staining. ΔΨm decreased significantly during HIV-PEP (p=0.0015 for the linear term, p=0.0039 for the quadratic term of days on PEP) and normalized several weeks after stopping antiretrovirals. The apoptosis rates did not change significantly (p=0.42). Even newer drugs such as tenofovir and emtricitabine may cause side effects due to mitochondrial dysfunction.
M
Eighteen HIV-uninfected individuals completing a 4-week course of HIV-PEP consisting of tenofovir/emtricitabine and lopinavir/ritonavir were enrolled in the study. Nine HIV-uninfected individuals not receiving PEP matched to age were enrolled as a comparison group. The Ludwig-Maximilians University ethics committee approved the protocol. Written informed consent was obtained from all participating individuals prior to inclusion in the study. Individuals with known underlying diseases, and subjects receiving any medication other than the PEP regimen were excluded from the study in order to eliminate other potential causes of mitochondrial dysfunction.
Citrate blood was drawn at the start of PEP (baseline, visit 1), about 2 weeks after starting PEP (visit 2), at the end of the 4-week PEP course (visit 3), and about 2 months after finishing PEP (visit 4), if the subject was available. In addition to ΔΨm and apoptosis rate in peripheral blood mononuclear cells (PBMCs), routine blood tests were performed on the same days to rule out side effects of PEP and other severe underlying diseases with a potential influence on the ΔΨm of PBMCs, such as hypercholesterolemia, diabetes mellitus, or acute infections. Additionally, all individuals were asked to report symptoms occurring during PEP. The individuals from the comparison group without PEP underwent only one blood draw.
Isolation of PBMCs was performed immediately after collecting citrate blood using a Ficoll gradient. ΔΨm was detected by staining isolated PBMCs with JC-1 (Invitrogen, Darmstadt, Germany) and analyzed using flow cytometry (BD FACScan, Becton Dickinson, Heidelberg, Germany) as previously described. 9 JC-1 was used for its sensitivity, specificity, and reliability for the assessment of ΔΨm. 11,12 For each sample 1×10⁶ cells were stained with 10 μg/ml JC-1 and incubated for 15 min at 37°C and 5% CO2. Cells were then washed three times and resuspended in 400 μl phosphate-buffered saline (PBS). For positive controls, PBMCs in identically treated and stained patient specimens were treated with carbonyl cyanide p-(trifluoromethoxy)phenylhydrazone (FCCP) for 1 min right before FACS analysis, causing a decrease in ΔΨm. 13 With a decrease of ΔΨm, JC-1 shifts its fluorescence signals from red (590 nm, aggregates of the molecule) to green (527 nm, monomeric form). The red fluorescence signal is detected in channel FL-2 and the green fluorescence signal is detected in channel FL-1. 12 High ΔΨm results in a high FL-2 signal and a low FL-1 signal and therefore a high FL-2/FL-1 ratio. 9 As ΔΨm decreases the FL-2/FL-1 ratio decreases. 9 Transformation of log data from the fluorescence channels was calculated automatically using CellQuest v. 3.1 software (Becton Dickinson, Heidelberg, Germany). Apoptotic cells were detected by staining 2×10⁵ PBMCs with 10 μl Annexin-V-FITC and 10 μl propidium iodide (PI) and immediate analysis using flow cytometry as described elsewhere. 9,14 Unstained cells were counted as negative controls. For each sample 50,000 cells were counted.
For the analysis of ΔΨm over time, the FL-2/FL-1 ratio was calculated. Additionally, the percentage of cells with lower FL-2 fluorescence indicating decreased ΔΨm was calculated using FL-2 histograms according to a predefined protocol. Statistical analysis was performed by a repeated measures mixed effects regression model using SAS 9.2 (SAS, Heidelberg, Germany). For the main analysis of ΔΨm during PEP, ΔΨm as the continuous dependent variable was modeled as effect of time on PEP, measured in days. Both the linear and the quadratic term of days on PEP were included in the model as continuous variables. The quadratic term was included with the assumption of an asymptotic decrease of ΔΨm toward a lower plateau level, which was confirmed by goodness of fit analysis of the model. Confounding by gender and age was ruled out. Results were considered statistically significant at p<0.05.
The median age in the study group receiving PEP was 34.5 years (range 24–51 years), including 15 males (83%) and three females (17%). In the control group not receiving PEP, the median age was 37 years (range 23–48 years), including six males (67%) and three females (33%). All participants were of European ancestry. Self-reported adherence in the PEP group was 100%. All subjects were initially tested negative and remained negative for HIV, hepatitis B, and hepatitis C infections.
The median ΔΨm (as FL-2/FL-1) in the comparison group was 10.93. At baseline (visit 1) in the PEP group, the median ΔΨm was 9.38, which was not significantly different from the comparison group (p=0.194). ΔΨm decreased to 7.86 at visit 2 and 7.55 at visit 3 (Fig. 1). Using a repeated measures mixed model analysis with auto regressive covariance matrix including both linear (estimate=–0.1786, p=0.0015) and quadratic (estimate=0.003717, p=0.0039) terms of days on PEP, the decrease of ΔΨm during about 4 weeks of PEP was statistically significant. At visit 4 (about 2 months after finishing PEP) ΔΨm was normalized at 9.01 (Fig. 1). Comparison of the ΔΨm measurements at the end of PEP (visit 3) and ≥8 weeks later at visit 4, again using a mixed model approach (visit 3 and visit 4 as categorical time points, unstructured covariance matrix), demonstrated a statistical trend for the increase of ΔΨm (p=0.09). The complementary analysis of the proportion of cells with reduced ΔΨm yielded equivalent results (Fig. 2). Again using a repeated measures mixed model analysis including both linear (estimate=0.8664, p=0.0009) and quadratic (estimate=–0.01597, p=0.018) terms of days on PEP, the increase in proportion of cells with reduced ΔΨm during 4 weeks of PEP was statistically significant. There was also a significant decrease in the proportion of cells with reduced ΔΨm after finishing PEP between visits 3 and 4 (p=0.047).
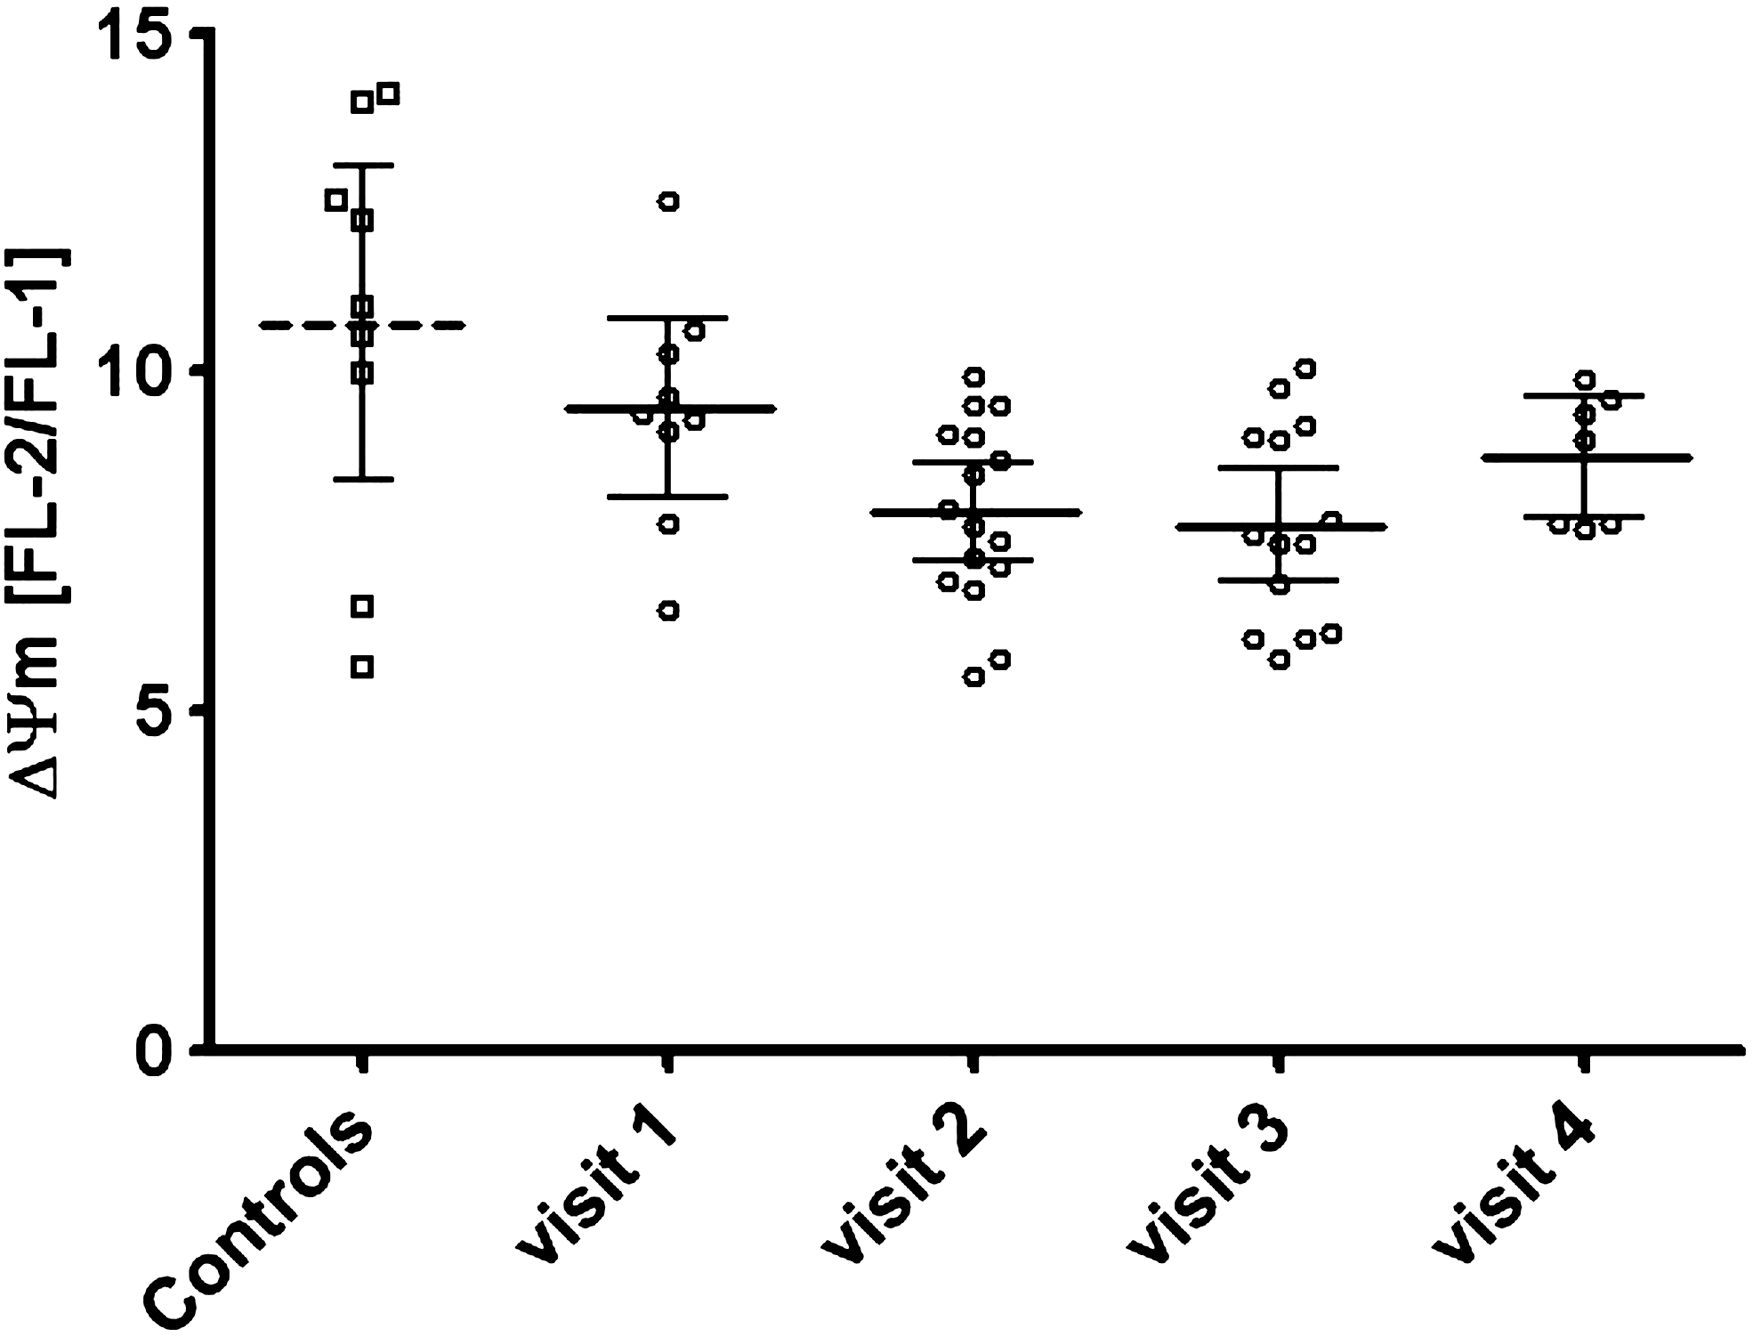
Mitochondrial transmembrane potential (ΔΨm) as FL-2/FL-1 ratio over time.
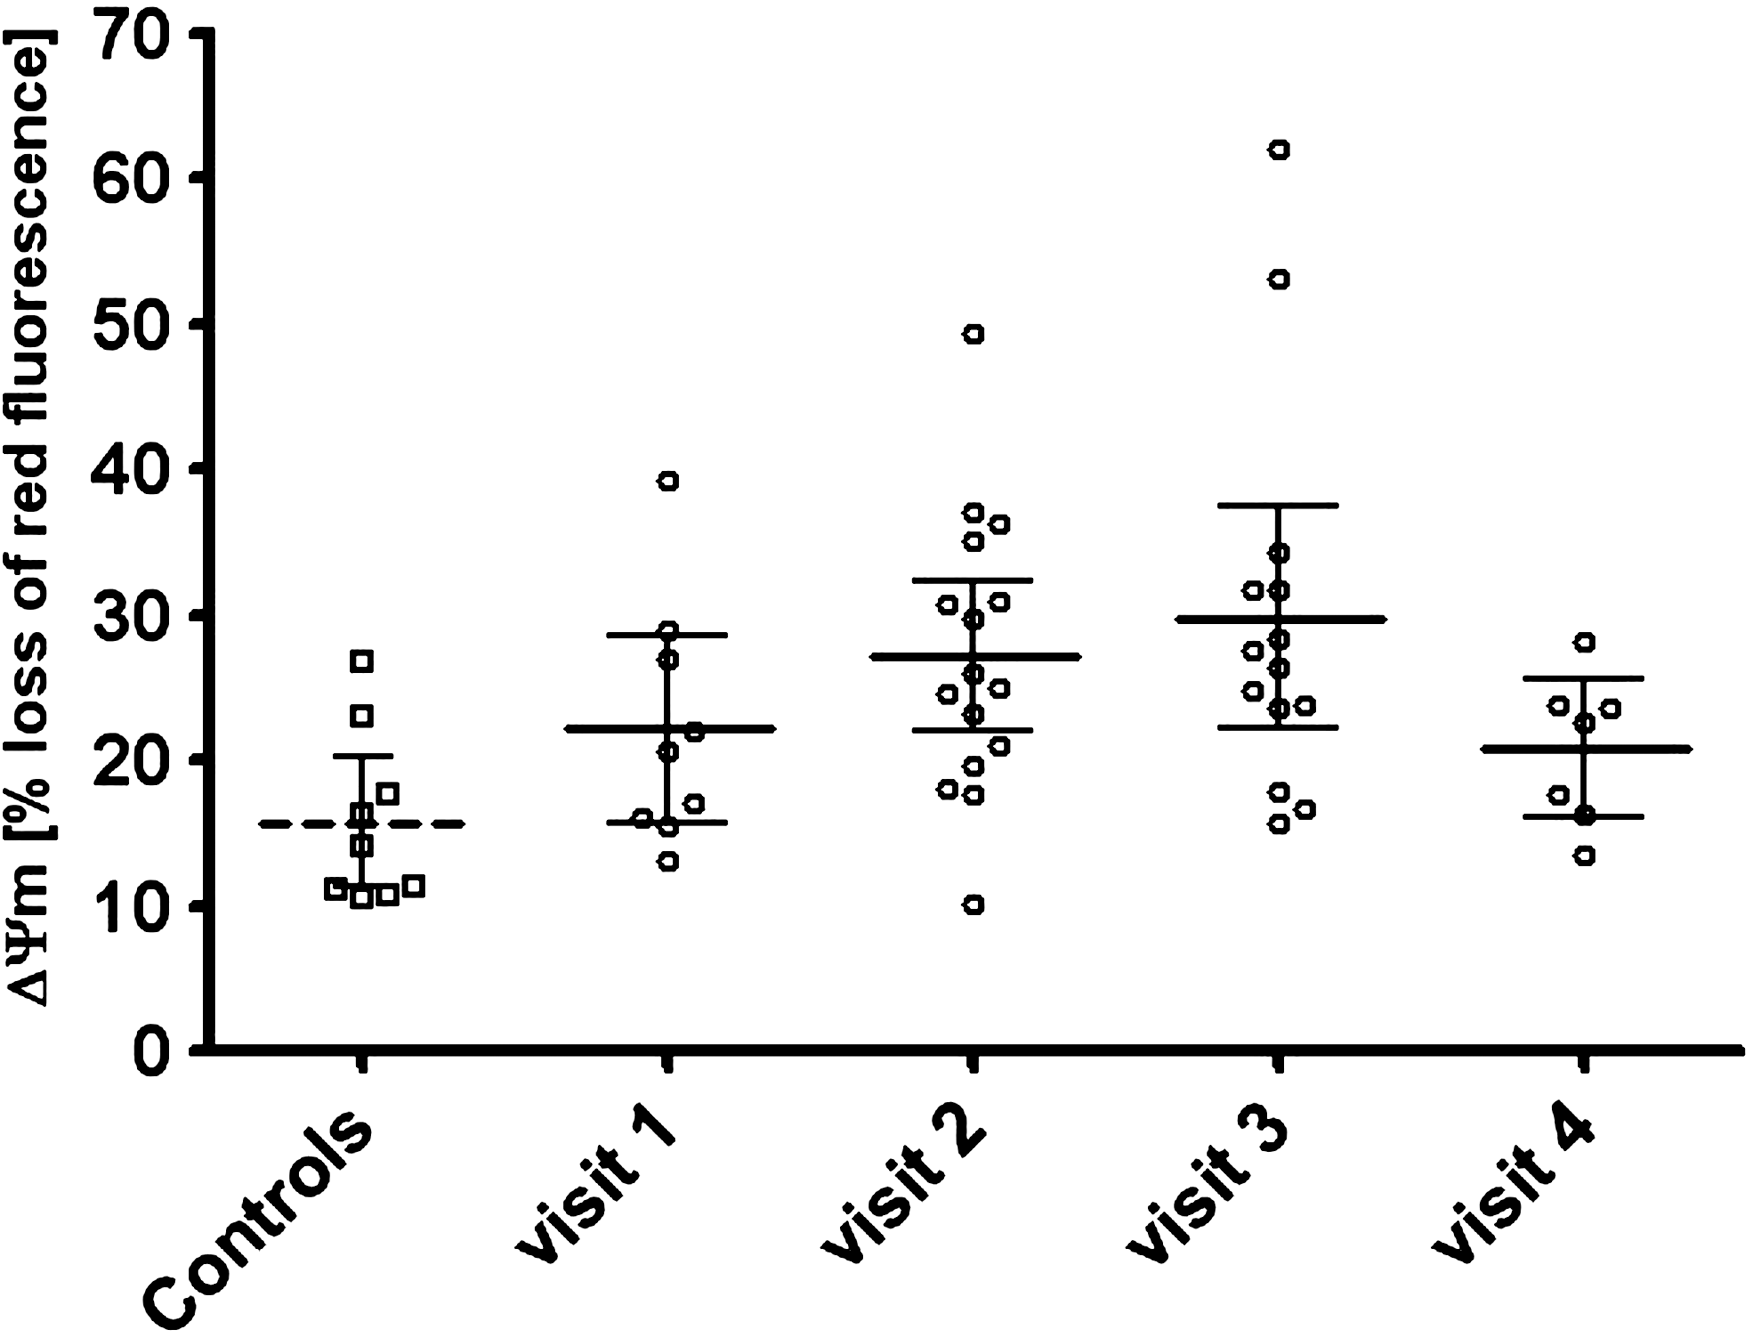
ΔΨm as percentage of cells with decrease of red fluorescence in channel FL-2 over time.
The apoptosis rate in PBMCs of individuals without PEP was 3.93%. In the group receiving PEP, the median at visit 1 was 3.83%, during PEP it was 4.45% at visit 2 and 3.47% at visit 3; after PEP it was 4.87% at visit 4 (Fig. 3). The apoptosis rate in PBMCs did not change significantly over the 4-week course of PEP (p=0.42 for the change during PEP) and was similar to the apoptosis rate in the individuals not receiving PEP.

Apoptosis rate over time.
Eleven subjects developed diarrhea, one of them severe; three experienced fatigue and two nausea; two complained of meteorism and one of headaches. Serum cholesterol, low-density lipoprotein (LDL) and phosphate levels were normal at baseline, however, an elevation of these values over the 4-week course of PEP could be seen in some patients; five individuals showed cholesterol levels above 200 mg/dl at visits 2 and 3. The median HDL values decreased during PEP. ALT, AST, alkaline phosphatase, GGT, and CPK were normal at baseline in all patients and the median levels did not rise significantly during PEP although one patient at visit 2 and three patients at visit 3 had elevated levels for AST and GGT above 38 U/liter and 60 U/liter, respectively. Two patients at visit 2 and three individuals at visit 3 showed elevated ALT levels; five patients had elevated CPK levels above 190 U/liter at visits 2 and 3, denying physical exercise before blood draw. Complete blood count, bilirubin, LDH, and lactate levels remained within normal limits throughout the study period.
This is the first study to report the effects of cART with tenofovir and emtricitabine on mitochondria in HIV-uninfected subjects. We demonstrate a significant decrease in the ΔΨm over a 4-week course of HIV-PEP. The degree of decrease in ΔΨm was especially notable since only the newer NRTIs emtricitabine and tenofovir were used, which are known to cause less mitochondrial toxicity compared to older NRTIs such as stavudine, zidovudine, or didanosine. 6,7 The study design did not allow estimating the magnitude of the additional effect of lopinavir/ritonavir on ΔΨm. PIs have been associated with mitochondrial dysfunction and lipodystrophy in numerous studies. 15 Baseline ΔΨm in the control group not receiving PEP was slightly (but not significantly) higher than in the PEP group, most likely because in four individuals the baseline blood draw occurred 1–3 days after PEP had been started at the emergency department. In cell culture models, cells are usually incubated with NRTIs for several days to weeks before measurements. Therefore, the exact onset of the earliest changes is poorly defined, but a range of days appears to be enough for effects to occur.
The decrease in ΔΨm did not significantly affect apoptosis of PBMCs, although it is possible that small changes were not detected due to the limited sample size. Apoptosis was actually lowest after 4 weeks of PEP, concurring with the lowest values of ΔΨm. Therefore, triggers other than a decrease in ΔΨm seem necessary to increase the apoptosis rate in these cells and a lowered ΔΨm may only render the cells more sensitive to apoptosis. ΔΨm increased again over the weeks following PEP, reaching baseline levels. This increase could be due either to PBMC turnover or potential mitochondrial recovery in this cell type. The decrease in ΔΨm remained subclinical as none of the patients receiving PEP developed side effects thought to be associated with mitochondrial dysfunction. However, transient changes of serum lipid, ALT, AST, alkaline phosphatase, GGT, phosphate, and CPK levels occurred in some patients, which are known side effects of the medication used, especially lopinavir/ritonavir. All patients had normal CRP, lipase, glucose, creatinine, and BUN levels at all times, ruling out underlying diseases such as diabetes mellitus, pancreatitis, acute or chronic renal failure, and acute infections or inflammatory conditions, which could affect ΔΨm.
The relatively small number of individuals included is a limitation of our study. However, this is result of the rigorous inclusion criteria ensuring a homogeneous study population. The proportion of female controls was slightly higher in the control group. The importance of this is unclear as, to our knowledge, gender has never been shown to have an effect on mitochondrial transmembrane potential. 16 Also, time intervals between blood draws varied to some degree and not all participants were available for all scheduled appointments. Both are accounted for by the repeated measures mixed effects regression analysis, modeling days on PEP as fixed effect and subjects as random effect. Using this approach, all available measurements could be used in the analysis. The consistency between assessment of median ΔΨm and proportion of cells with reduced ΔΨm over time further adds to the robustness of our findings.
In conclusion, cART using the newer NRTIs tenofovir and emtricitabine with lopinavir/ritonavir causes a subclinical decrease in mitochondrial transmembrane potential in PBMCs even in the absence of HIV infection and over just a 4-week term of treatment. Considering that HIV therapy may be necessary for decades and that further decreases in ΔΨm over time might be possible, these modern substances may cause long-term side effects by inducing mitochondrial dysfunction.
Footnotes
Acknowledgments
Part of the data has been presented at the 10th Kongress für Infektionskrankheiten und Tropenmedizin (KIT), June 23–26, 2010, Cologne, Germany (abstract P152).
Author Disclosure Statement
U. Seybold received travel and conference registration support from Gilead Sciences, Tibotec/Janssen-Cilag, Abbott Laboratories, Pfizer, GlaxoSmithKline; speaker's and educational material honoraria from Gilead Sciences, Bristol-Myers Squibb, GlaxoSmithKline, Tibotec/Janssen-Cilag; and advisory board honorarium from Abbott Laboratories. J.R. Bogner received speaker's honoraria from Abbott, Astellas, AstraZeneca, Bayer, Bristol-Myers Squibb, Boehringer Ingelheim, Gilead Sciences, Janssen-Cilag, MSD, Novartis, Pfizer, Roche, ViiV Healthcare; and advisory board honoraria from Abbott Laboratories, Boehringer Ingelheim, Janssen-Cilag, and MSD. J.B. Groener and T. Vollbracht report no competing financial interests exists.