




Abstract
Chronic HIV-1 infection is characterized by immune cell dysfunctions driven by chronic immune activation. Plasma HIV-1 viral load (VL) is closely correlated with disease progression and the level of immune activation. However, the mechanism by which the persistent presence of HIV-1 damages immune cells is still not fully understood. To evaluate how HIV-1 affects disruption of T cell-mediated immune responses during chronic HIV-1 infection we determined the functional profiles of T cells from subjects with chronic HIV-1 infection. We measured the capacity of peripheral blood mononuclear cells (PBMCs) to produce 25 specific cytokines in response to nonspecific T cell stimulation, and found that the capacity to produce Th-1-related cytokines (MIP-1α, MIP-1β, RANTES, IFN-γ, and MIG), sIL-2R, and IL-17, but not Th-2-related cytokines, was inversely correlated with plasma VL. The capacities to produce these cytokines were interrelated; notably, IL-17 production had a strong direct correlation with production of MIP-1α, MIP-1β, RANTES, and IFN-γ. In both CD4+ and CD8+ T cells, dysfunctional production of cytokines was associated with T cell activation (CD38 expression) and exhaustion (PD-1 and/or CTLA-4 expression) status of memory subsets. Although the capacity to produce these cytokines was recovered soon after multiple log10 reduction of plasma viral levels by antiretroviral therapy, memory CD8+ T cells remained activated and exhausted after prolonged virus suppression. Our data suggest that HIV-1 levels directly affect the ability of memory T cells to produce specifically Th1- and Th17-related cytokines during chronic HIV-1 infection.
Introduction
P
The immune system is highly coordinated: the cytokine network regulates interactions between cells, and cytokine balance dictates how the immune system responds. Cytokine production determines the specific helper functions of CD4+ T cells and allows balance in immune responses in vivo. 14 –16 A possible explanation of the impaired immune response in chronic HIV-1 infection is that the ability of T cells to balance cytokine production has been altered, just as alteration of balance between Th1- and Th2-type immune response affects the clinical course of certain infectious diseases and autoimmune syndromes. 17,18
To evaluate T cell impairment resulting from persistent immune activation during chronic HIV-1 infection, we compared the cytokine expression spectra of peripheral blood mononuclear cells (PBMCs) in response to nonspecific T cell stimulation in treatment-naive HIV-1-infected subjects with low or high VL. We also examined the differentiation states and activation levels of CD4+ and CD8+ T cells from HIV-1-infected subjects to elucidate relationships between cytokine expression capacity and T cell phenotypic status.
Materials and Methods
Study design
HIV-1-infected individuals who were under medical supervision at our clinic were asked to provide blood samples for this study. Blood samples were taken from selected patients in the chronic phase of HIV-1 infection, with CD4 counts >200 cells/ml. We requested blood samples from antiretroviral therapy (ART)-naive patients with either low plasma viral load (VL) values (<5000 copies/ml; LVL group) or high VL values (>25,000 copies/ml; HVL group), and from treatment-experienced patients who had received ART >2 years (Tx group). Blood samples were also obtained from a small number of HIV-1-infected patients who had first initiated ART within the previous 1–2 months. As controls, blood samples were obtained from HIV-1-seronegative individuals (healthy controls; HC).
All participants gave written informed consent, and the study was approved by the institutional review boards of the Institute of the Medical Science of the University of Tokyo (No. 11-2-0329 and 20-47-210521).
PBMC cultures and PHA stimulation
PBMCs were isolated from heparinized whole blood by Ficoll-Paque PLUS density gradients (GE Healthcare, Piscataway, NJ) and cryopreserved in liquid nitrogen until use. The frozen cells were thawed 1 day before stimulation and cultured in R10 medium [RPMI 1640 medium (Sigma, St. Louis, MO) supplemented with 10% heat-inactivated fetal calf serum (FCS; Sigma), 100 U penicillin/ml, 100 μg/ml streptomycin (Sigma), 2 mmol/liter
Quantification of cytokines
The human cytokine 25-plex antibody kit (Invitrogen Corporation, Carlsbad, CA) was used to measure the levels of 25 cytokines in culture supernatants: interleukin (IL)-1 receptor antagonist protein (IL-1RA), IL-1β, IL-2, soluble IL-2R (sIL-2R), IL-4, IL-5, IL-6, IL-7, IL-8, IL-10, IL-12p40/70, IL-13, IL-15, IL-17, eotaxin, interferon gamma (IFN-γ)-induced protein 10 kDa (IP-10), monocyte chemoattractant protein-1 (MCP-1), monokine induced by IFN-γ (MIG), macrophage inflammatory protein 1alpha (MIP-1α), MIP-1β, regulated on activation normal T cell expressed and secreted (RANTES), tumor necrosis factor-α (TNF-α), granulocyte-macrophage colony-stimulating factor (GM-CSF), IFN-α, and IFN-γ. The detection limits for the cytokines measured by the kit were as follows: IL-5, IL-6, IL-8, 3 pg/ml; MIG, 4 pg/ml; IL-4, IL-10, IFN-γ, IP-10, eotaxin, 5 pg/ml; IL-2, 6 pg/ml; IL-7, IL-13, IL-15, IL-17, TNF-α, MIP-1α, MIP-1β, MCP-1, 10 pg/ml; IL-1β, IL-12p40/70, IFN-α, GM-CSF, RANTES, 15 pg/ml; IL-1RA, sIL-2R, 30 pg/ml. As the amounts of IL-6, IL-8, TNF-α, MIP-1α, MIP-1β, IP-10, MIG, and MCP-1 produced from PHA-stimulated PBMCs were beyond the range of the assay, we diluted the samples 10-fold prior to measurement of these cytokines. However, IL-8 levels were out of range in most patient samples and could not be measured accurately.
Samples were loaded onto the Luminex100 system (Luminex Corporation, Austin, YX), and samples were quantified by analysis of the median fluorescence intensity of the beads using MasterPlex QT version 2.5 (Luminex Corporation). The assays were performed according to the manufacturer's instructions, and all samples were run in duplicate.
Identification of cytokine-producing cells in PBMCs
CD14+ cells (monocytes), CD8+ T cells, CD4+ T cells, and CD56+CD16+ (NK) cells were isolated sequentially from PBMCs of each healthy subject. Magnetic cell separation (MACS) selection was performed using anti-CD14, anti-CD8, and anti-CD4 antibody-conjugated microbeads or using the CD56+CD16+ NK cell isolation kit (Miltenyi Biotic, Bergisch Gladbach, Germany). The purity of each cell fraction was >95% as determined by flow cytometry.
Fractionated cells were cultured separately or were cocultured in the presence of 2 μg/ml PHA at 37°C, 5% CO2, for 48 h. Levels of MIP-1α, MIP-1β, RANTES, IL-2R, IFN-γ, and IL-17 in culture supernatants were measured with DuoSet ELISA Development Systems (R&D Systems). The absolute numbers of each cell fraction used in the experiments were calculated from the average proportion of each subset in PBMCs.
Antibodies
The fluorochrome-conjugated monoclonal antibodies (mAb) used in the study were as follows: fluorescein isothiocyanate (FITC)-labeled anti-MIP-1α, anti-MIP-1β, and anti-RANTES (R&D Systems, Minneapolis, MN); FITC-labeled anti-PD-1 and anti-Ki67, phycoerythrin (PE)-labeled anti-Bcl-2, peridinin cholorophyll protein/cyanin5.5 (PerCP Cy5.5)-labeled anti-CD38 and anti-CD3, PE Cy7-labeled anti-CCR7, allophycocyanin (APC)-labeled anti-CD45RA, and pacific blue-labeled anti-CD4 (BD Biosciences, San Jose, CA); APC AlexaFluor 750-labeled anti-CD4, pacific blue-labeled anti-IFN-γ, and AlexaFluor 647-labeled anti-IL-17A (eBioscience, San Diego, CA); PE-labeled anti-IL-4 (Becton Dickinson, Franklin Lakes, NJ); APC Cy7-labeled anti-CD3 (BioLegend, San Diego, CA); and Pacific Orange-labeled anti-CD8 (Invitrogen).
Surface phenotypic and intracellular cytokine staining
For intracellular cytokine staining, cryopreserved PBMCs were thawed and cultured in R10 overnight. The following day cells were stimulated with phorbol ester (PMA)/calcium ionophore (ionomycin) in the presence of Golgi inhibitor (brefeldin A) for 5 h. Cells were stained with a panel of fluorescently labeled antibodies against cell-surface markers. For detection of dead cells, the cells were also stained with 5 μg/ml ethidium monoazide bromide (EMA; Sigma). Cells were washed twice and exposed to fluorescent light for 10 min on ice to allow the EMA to bind to DNA in dead cells. Cells were then fixed in 2% paraformaldehyde and permeabilized in BD FACS Permeabilizing Solution 2 (BD Biosciences) prior to antibody staining for intracellular molecules.
Dead or dying cells were detected by surface phenotypic staining with propidium iodide (PI; Sigma).
Flow cytometric analysis
Samples were analyzed on a FACSAria multilaser cytometer (Beckton Dickinson) running FACSDiva software, with collections of 60,000–100,000 lymphocyte-gated events. Data were analyzed with FlowJo software (Tree Star, Ashland, OR).
Statistical analysis
GraphPad Prism5 software (San Diego, CA) was used for all statistical analysis. Differences between groups were tested for statistical significance using the nonparametric Mann–Whitney U test. Since previous studies revealed that production of multiple cytokines by HIV-specific T cells was limited in progressors compared to nonprogressors, 6,19 the production levels of cytokines were expected to differ among LVL, HVL, and healthy control subjects. For this reason, we did not consider multiple comparison correction for Mann–Whitney U tests to avoid false-negative results. Correlation analysis was performed using Spearman's rank correlation. The level of significance for all analyses was set at p<0.05.
Results
Study population
Most analyses were performed using blood samples collected from 35 HIV-1-infected, ART-naïve patients, 15 HIV-1-infected, treatment-experienced patients, and 16 HIV-1-seronegative individuals. Demographic characteristics of these 50 HIV-1-infected patients are presented in Table 1. The 35 HIV-1-infected, ART-naive patients included 19 patients with low VL (LVL group; median VL: 1200, range: 53 to 3600) and 16 patients with high VL (HVL group; median VL: 62,000; range: 25,000 to 500,000). The median CD4 counts in the LVL and HVL groups were 449 (range: 316 to 749) and 407 (range: 228 to 520), respectively; the difference was not statistically significant. The groups also showed no significant difference in age, another factor that influences immune status.
Italics indicates the patients used for phenotype and activation/exhaustion status of T cells.
VL, viral load; LVL, low viral load; HVL, high viral load; Tx, treatment experienced.
The 15 HIV-1-infected individuals recruited into the study to represent treatment-experienced patients had received ART and successfully controlled their disease over a long period of time (median: 66 months; range: 22 to 149 months). To examine the impact of actively decreasing VL on the functional profile of PBMCs, blood samples were also collected from six HIV-1-infected patients who had initiated treatment only in the previous 1–2 months.
Cytokine production in PHA-stimulated PBMCs
Cytokine measurements from cells cultured for 48 h in an unstimulated state were at the limit of detection (data not shown). We initially compared anti-CD3-antibody and PHA as a nonspecific stimulus of PBMCs to induce cytokine production, and found that the production levels of most cytokines were much higher in PHA-stimulated PBMCs than in anti-CD3-antibody-stimulated PBMCs (data not shown). When cells were stimulated with PHA and cultured for 48 h, production of most cytokines increased dramatically (Fig. 1A). There were no significant differences between any groups in IL-2, IL-13, IL-15, IL-1β, IFN-α, TNF-α, eotaxin, or IP-10 production (data not shown).
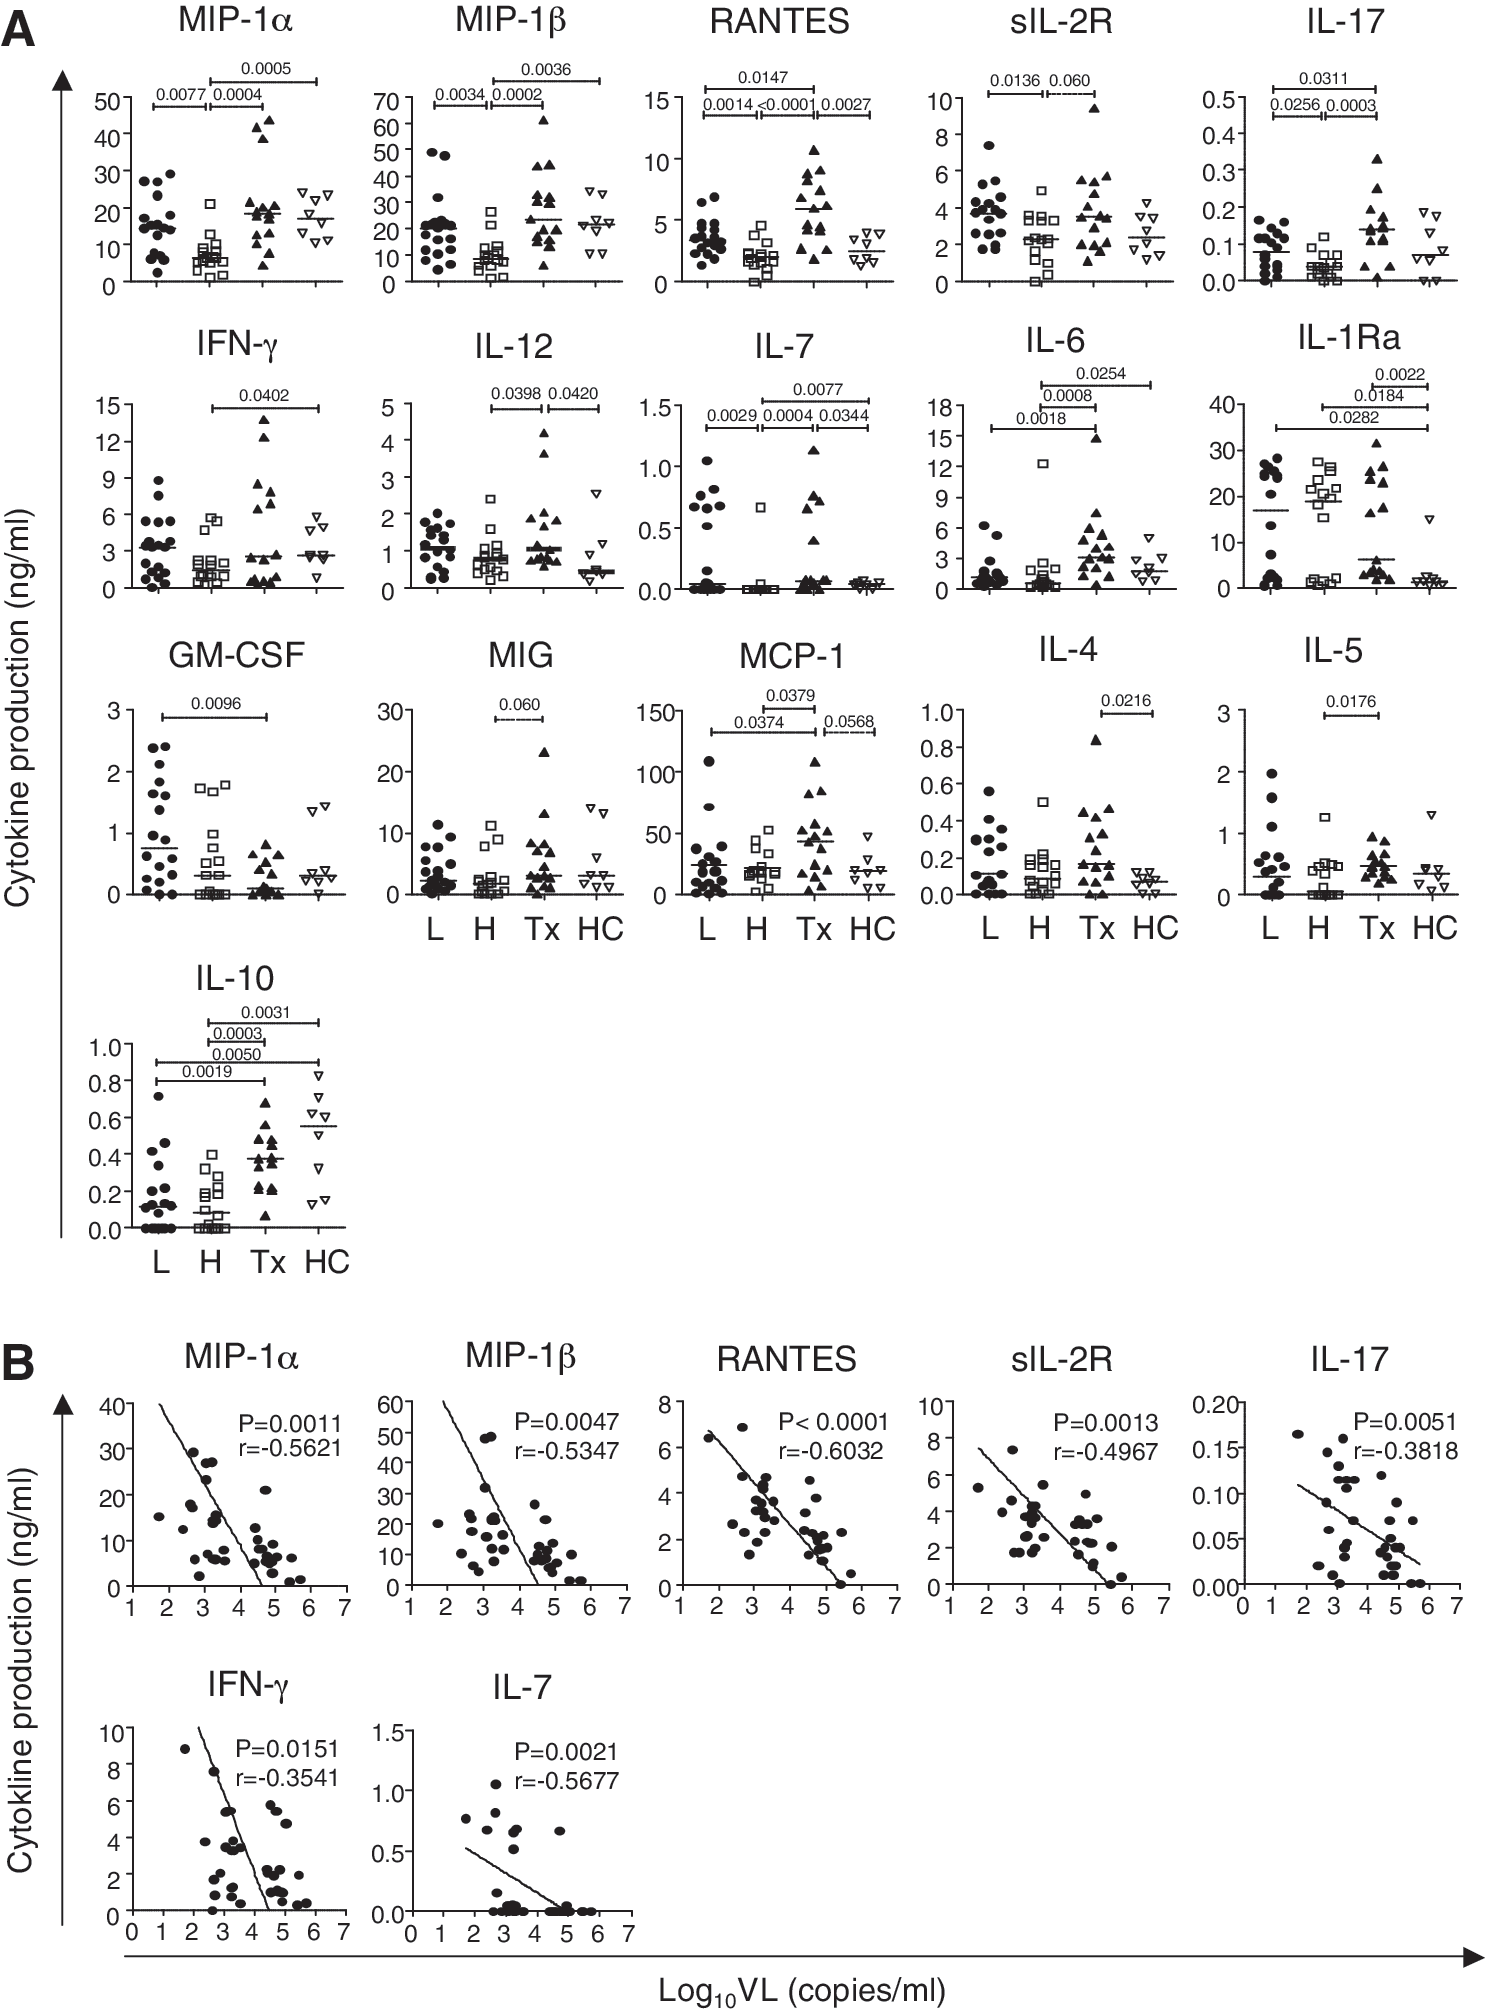
Multiple cytokine production of phytohemagglutinin (PHA)-stimulated peripheral blood mononuclear cells (PBMCs) in chronic HIV-1-infected subjects and healthy individuals.
Cytokine production in PBMCs from treatment-naive HIV-1 subjects was compared to cytokine production in PBMCs from healthy control subjects. Median levels of many cytokines in the HVL group were significantly different from those in the healthy control group: MIP-1α [6.33 (range 0.99–21.01) vs. 16.92 (10.36–23.87) ng/ml; p=0.0005], MIP-1β [8.51 (1.37–26.42) vs. 21.44 (10.26–34.11) ng/ml; p=0.0036], IFN-γ [1.50 (0.30–5.75) vs. 2.64 (0.79–5.78) ng/ml; p=0.0402], IL-7 [<0.01 (<0.01–0.67) vs. 0.04 (<0.01–0.07) ng/ml; p=0.0077], IL-1Ra [18.93 (0.59–27.61) vs. 1.50 (0.55–14.95) ng/ml; p=0.0184], IL-6 [0.63 (0.11–12.23) vs. 1.77 (0.68–4.93) ng/ml; p=0.0254], and IL-10 [0.08 (<0.005–0.40) vs. 0.55 (0.13–0.83) ng/ml; p=0.0031]. In contrast, significant differences between the LVL group and the healthy control group were seen only in levels of IL-10 [0.12 (<0.005–0.72) vs. 0.55 (0.13–0.83) ng/ml; p=0.0050] and IL-1Ra [17.05 (0.49–28.31) vs. 1.50 (0.55–14.95) ng/ml; p=0.0282] (Fig. 1A). These data suggest that although PBMCs from HVL subjects are abnormal in some way, PBMCs from LVL subjects are almost normal in terms of cytokine production.
As shown in Fig. 1A, mean cytokine levels were significantly lower in HVL subjects compared to LVL subjects, as follows: MIP-1α [6.33 (0.99-21.01) vs. 14.36 (2.29–29.16) ng/ml; p=0.0077], MIP-1β [8.51 (1.37–26.42) vs. 20.14 (4.31–48.75) ng/ml; p=0.0034], RANTES [2.01 (<0.015–4.57) vs. 3.40 (1.33–6.90) ng/ml; p=0.0014], sIL-2R [2.30 (0.02–4.96) vs. 3.72 (1.72–7.38) ng/ml; p=0.0136], IL-17 [0.04 (<0.01–0.12) vs. 0.08 (<0.01–0.17) pg/ml; p=0.0256], and IL-7 [<0.01 (<0.01–0.67) vs. 0.05 (<0.01–1.05) pg/ml; p=0.0029]. Notably, there was an inverse correlation between VL and production of these cytokines, and of IFN-γ (Fig. 1B). No relationship was observed between cytokine levels and CD4 cell count (data not shown). These data suggest that VL directly affects the capacity of PBMCs to produce certain cytokines during chronic infection.
Th1- and Th17-type T cells have impaired cytokine production in HVL subjects
Although PHA is considered a T cell mitogen, other cell populations also produce cytokines in response to PHA stimulation. 20 –22 The next step was to determine which cells were responsible for the alterations in cytokine production observed under our experimental conditions. The cytokines whose production was inversely correlated with VL can be produced by several cell populations in PBMCs. To identify the major cell population producing these cytokines, we fractionated PBMCs in healthy donors by positive selection and determined the cell population producing these cytokines. CD4+ T cells, CD8+ T cells, monocytes (CD14+), and NK cells (CD56+CD16+) were isolated from PBMCs, cultured separately or cocultured, and stimulated with PHA. We then measured levels of MIP-1α, MIP-1β, RANTES, IFN-γ, sIL-2R, and IL-17. Little or no production of these cytokines was detected in any of the single cell fractions (Fig. 2A). Production of cytokines MIP-1α, MIP-1β, RANTES, IFN-γ, and sIL-2R was observed in cocultures of CD4+ and CD14+ cells and in cocultures of CD8+ and CD14+ cells (Fig. 2A, and data not shown). IL-17 production was detected only in cocultures of CD4+ and CD14+ cells (Fig. 2A). As T cell stimulation by PHA requires accessory cells such as monocytes and macrophages, 23,24 these data indicate that CD4+ and CD8+ T cells are the sources of MIP-1α, MIP-1β, RANTES, IFN-γ, and sIL-2R production, and that only CD4+ T cells are the source of IL-17.
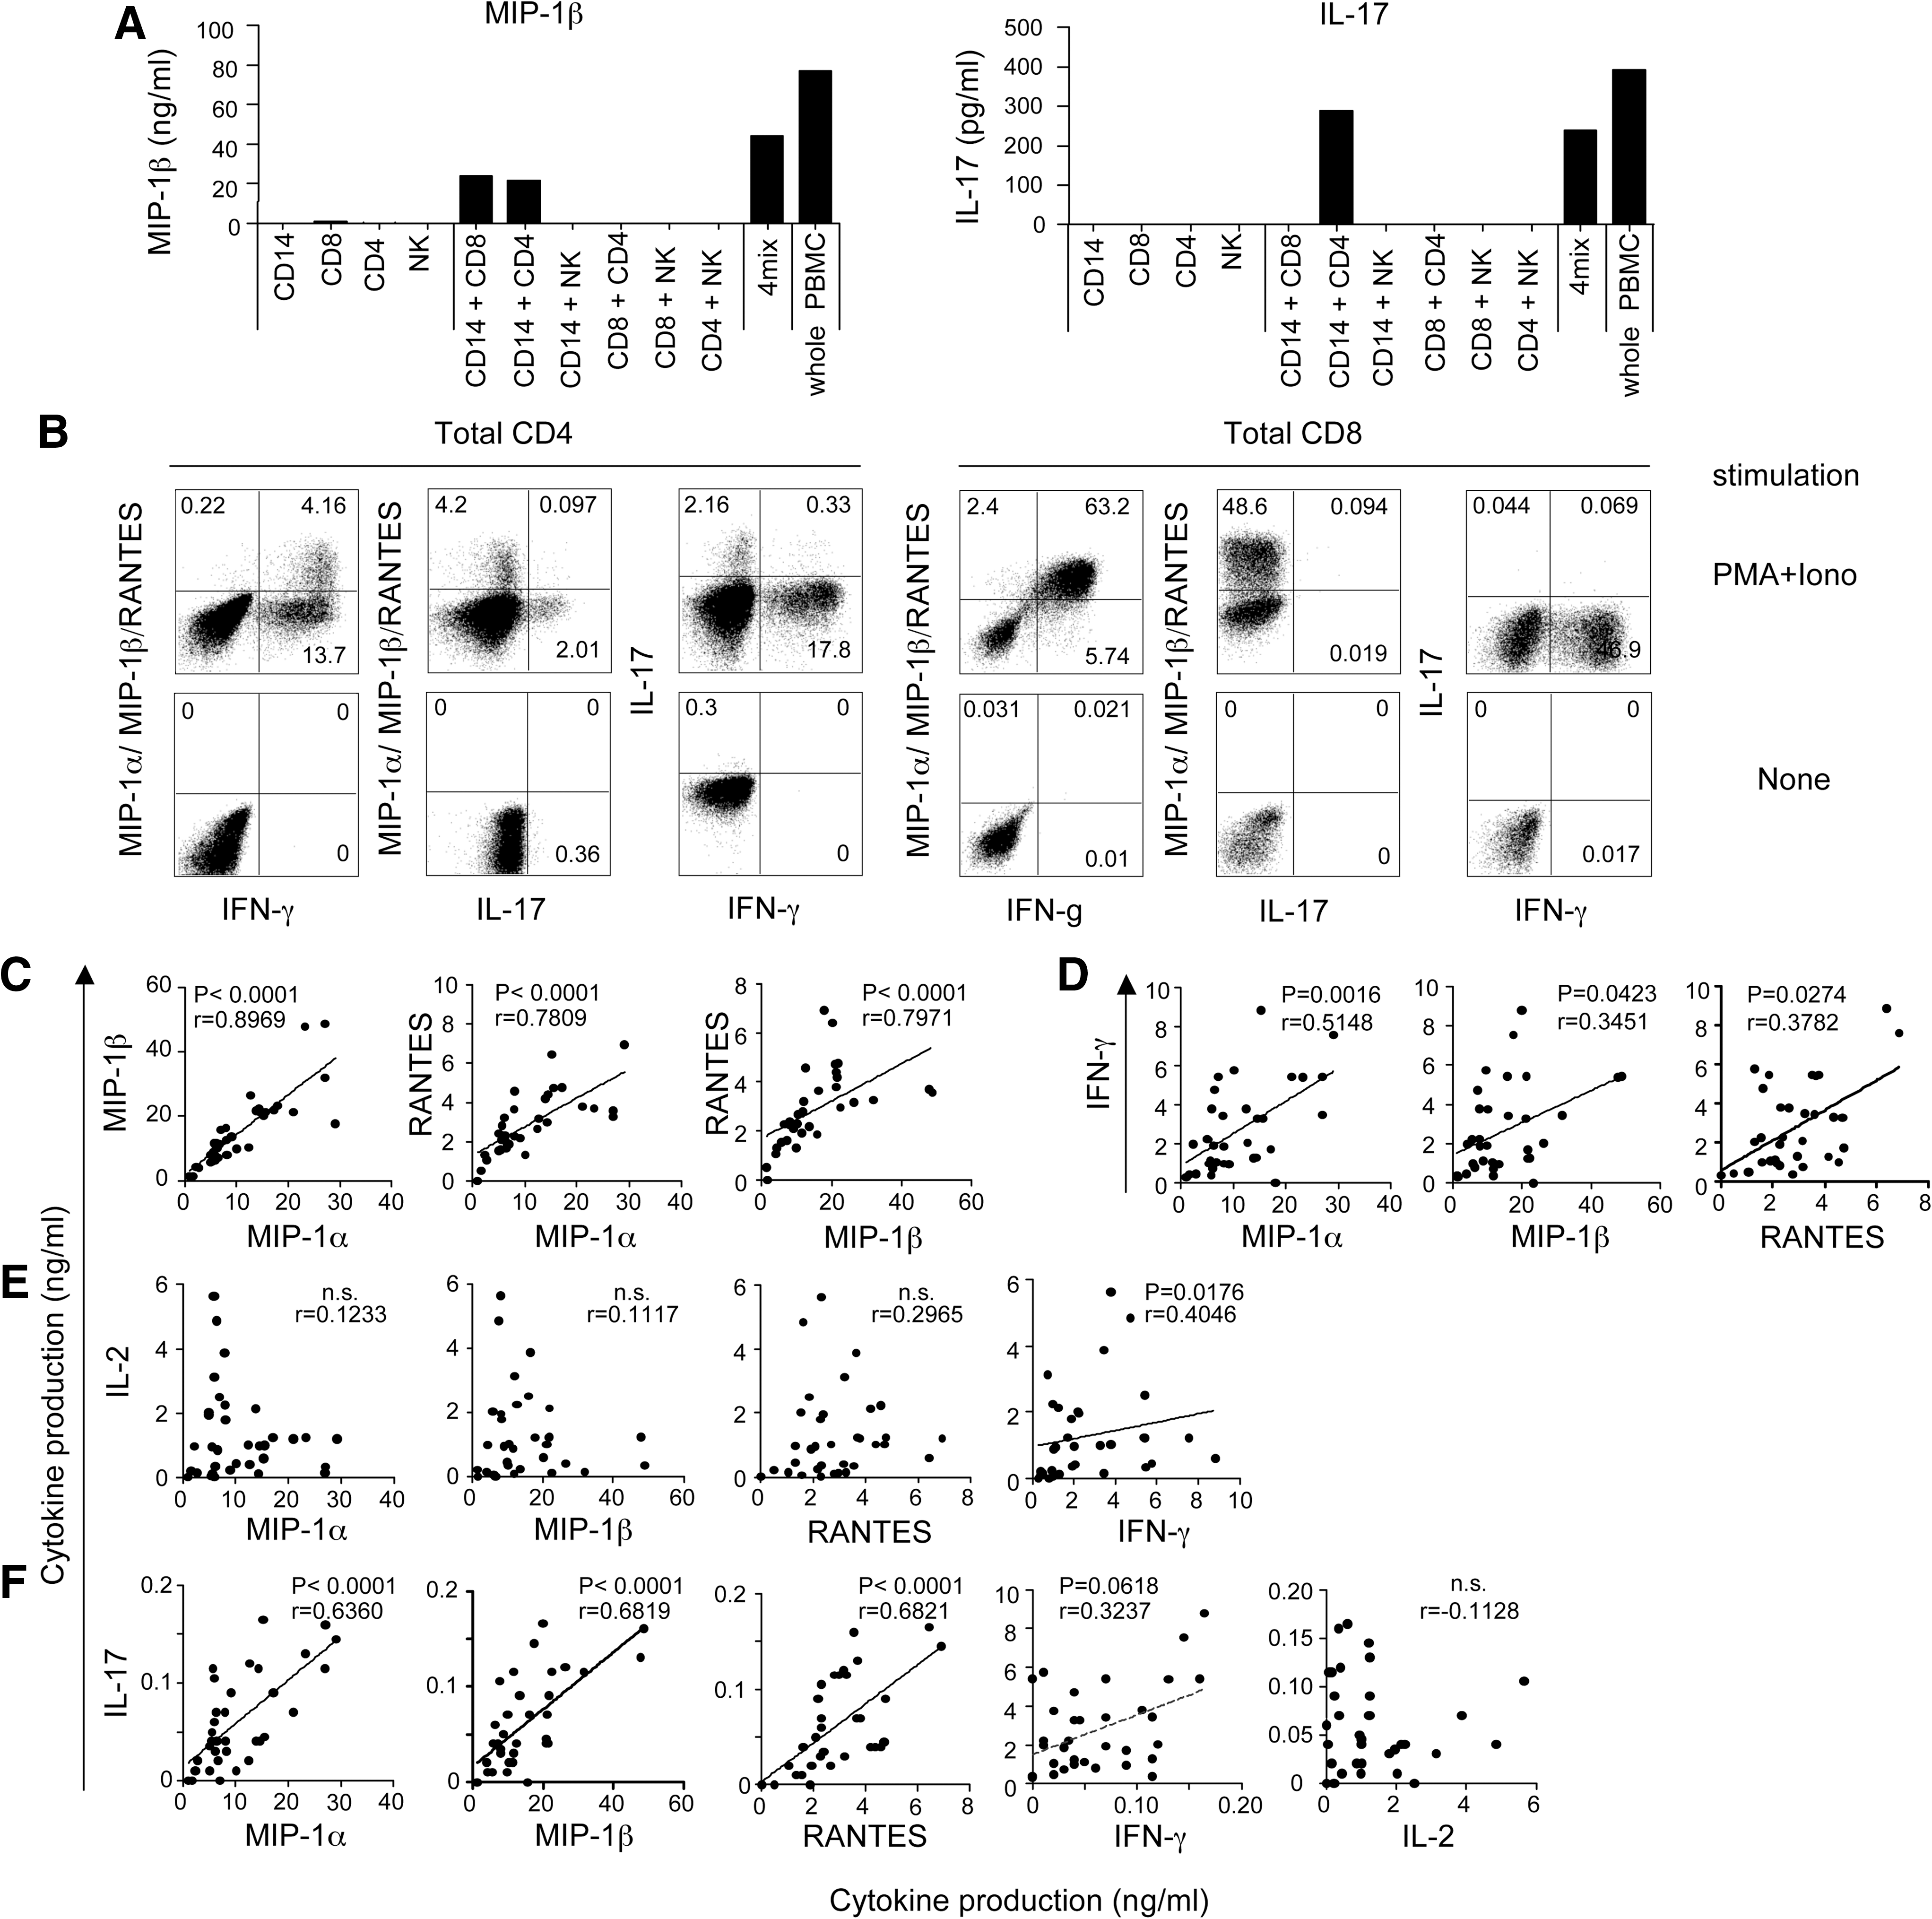
Identification of cytokine-producing cells and relationships between cytokines.
CD4+ T cells were classified into subsets based on cytokine secretion. 14,16 We found VL-associated reductions in levels of IFN-γ and IL-17 levels, which are typical cytokines secreted by Th1 and Th17 cells, respectively. In contrast, as shown in Fig. 1A, the LVL and HVL groups had comparable levels of IL-4, IL-5, and IL-13, which are associated with a Th2-type response, and IL-10, which is produced by regulatory T cells (Treg) (Fig. 1A). These results suggest that CD4+ T cell dysfunction in HVL may occur in a type-specific manner, especially in Th1 and Th17 cells.
To determine which types of T cells could secrete MIP-1α, MIP-1β, and RANTES under our experimental conditions, we examined the expression pattern of MIP-1α/MIP-1β/RANTES, IFN-γ, and IL-17 by intracellular cytokine staining (ICS) after nonspecific T cell stimulation. Production of MIP-1α/MIP-1β/RANTES occurred in IFN-γ-expressing CD4+ T cells, particularly in the subset of cells that expressed high levels of IFN-γ (Fig. 2B left). IL-17 was also produced in CD4+ T cells, but was secreted by a different CD4+ T cell subset. In CD8+ T cells, most IFN-γ-expressing cells produced MIP-1α/MIP-1β/RANTES, and IL-17 was not produced at all (Fig. 2B right). Thus, our assays showed that MIP-1α, MIP-1β, and RANTES are secreted from Th1-type CD4+ T cells and CD8+ T cells, and that IL-17-secreting cells (Th17 cells) are clearly distinct. These data suggest that cytokine production by T cells from the HVL group is dysfunctional, specifically in some of the Th1-related cytokines and in IL-17.
We next analyzed the correlation between production of Th1 cytokines (IFN-γ and IL-2), MIP-1α/MIP-1β/RANTES, and IL-17 in treatment-naive HIV-1 subjects. The levels of MIP-1α, MIP-1β, and RANTES showed strong positive correlations to each another (Fig. 2C), and correlations between IFN-γ and each of them were also significant (Fig. 2D). However, IL-2, another typical Th1 cytokine, did not show any significant correlation with MIP-1α, MIP-1β, and RANTES (Fig. 2E). Surprisingly, we found strong correlations between IL-17 production and MIP-1α/MIP-1β/RANTES levels or IFN-γ levels, despite the fact that these cytokines are produced by different cells (Fig. 2F). These data suggest interrelated production of IFN-γ, MIP-1α, MIP-1β, RANTES, and IL-17 in T cells, but not of IL-2. Moreover, the capacity of T cells to produce these cytokines appears to be affected by HIV-1 VL in vivo.
Both central and effector memory CD4+ and CD8+ T cells are highly activated and exhausted in HVL subjects
The mechanism underlying the reduction in levels of specific cytokines in the HVL group could result either from decreased numbers of the cytokine-producing cells or from decreased productive capacity in those cells. We quantitated CD4+ and CD8+ T cells in HIV-1-infected patients (Table 1) and healthy control subjects (data not shown) by FACS. Although the number of CD4+ T cells was significantly higher and the number of CD8+ T cells significantly lower in HC than in HIV-positive patients, the differences in these T cell subsets were not significant between HVL and LVL.
As the number of monocytes seemed to affect T cell stimulation by PHA, we also analyzed monocytes (CD14+ cells) and found there was no quantitative difference between any of the groups (data not shown).
As the cytokine productive capacity of T cells differs according to their differentiation status, 25 we explored the differentiation status of CD4+ and CD8+ T cells. We divided CD4+ and CD8+ T cells into four subsets depending on the expression pattern of CD45RA and CCR7: naive (CD45RA+/CCR7+), central memory (CM; CD45RA−/CCR7+), effector memory (EM; CD45RA−/CCR7−), and effector (CD45RA+/CCR7−) subsets. The proportion of each subset was highly heterogenic between subjects. The HVL and LVL subjects showed no significant differences in distribution of T cell subsets except in the proportion of naive CD8+ T cells (data not shown), which cannot secrete cytokines even following PHA stimuli (Fig. 3A). 26
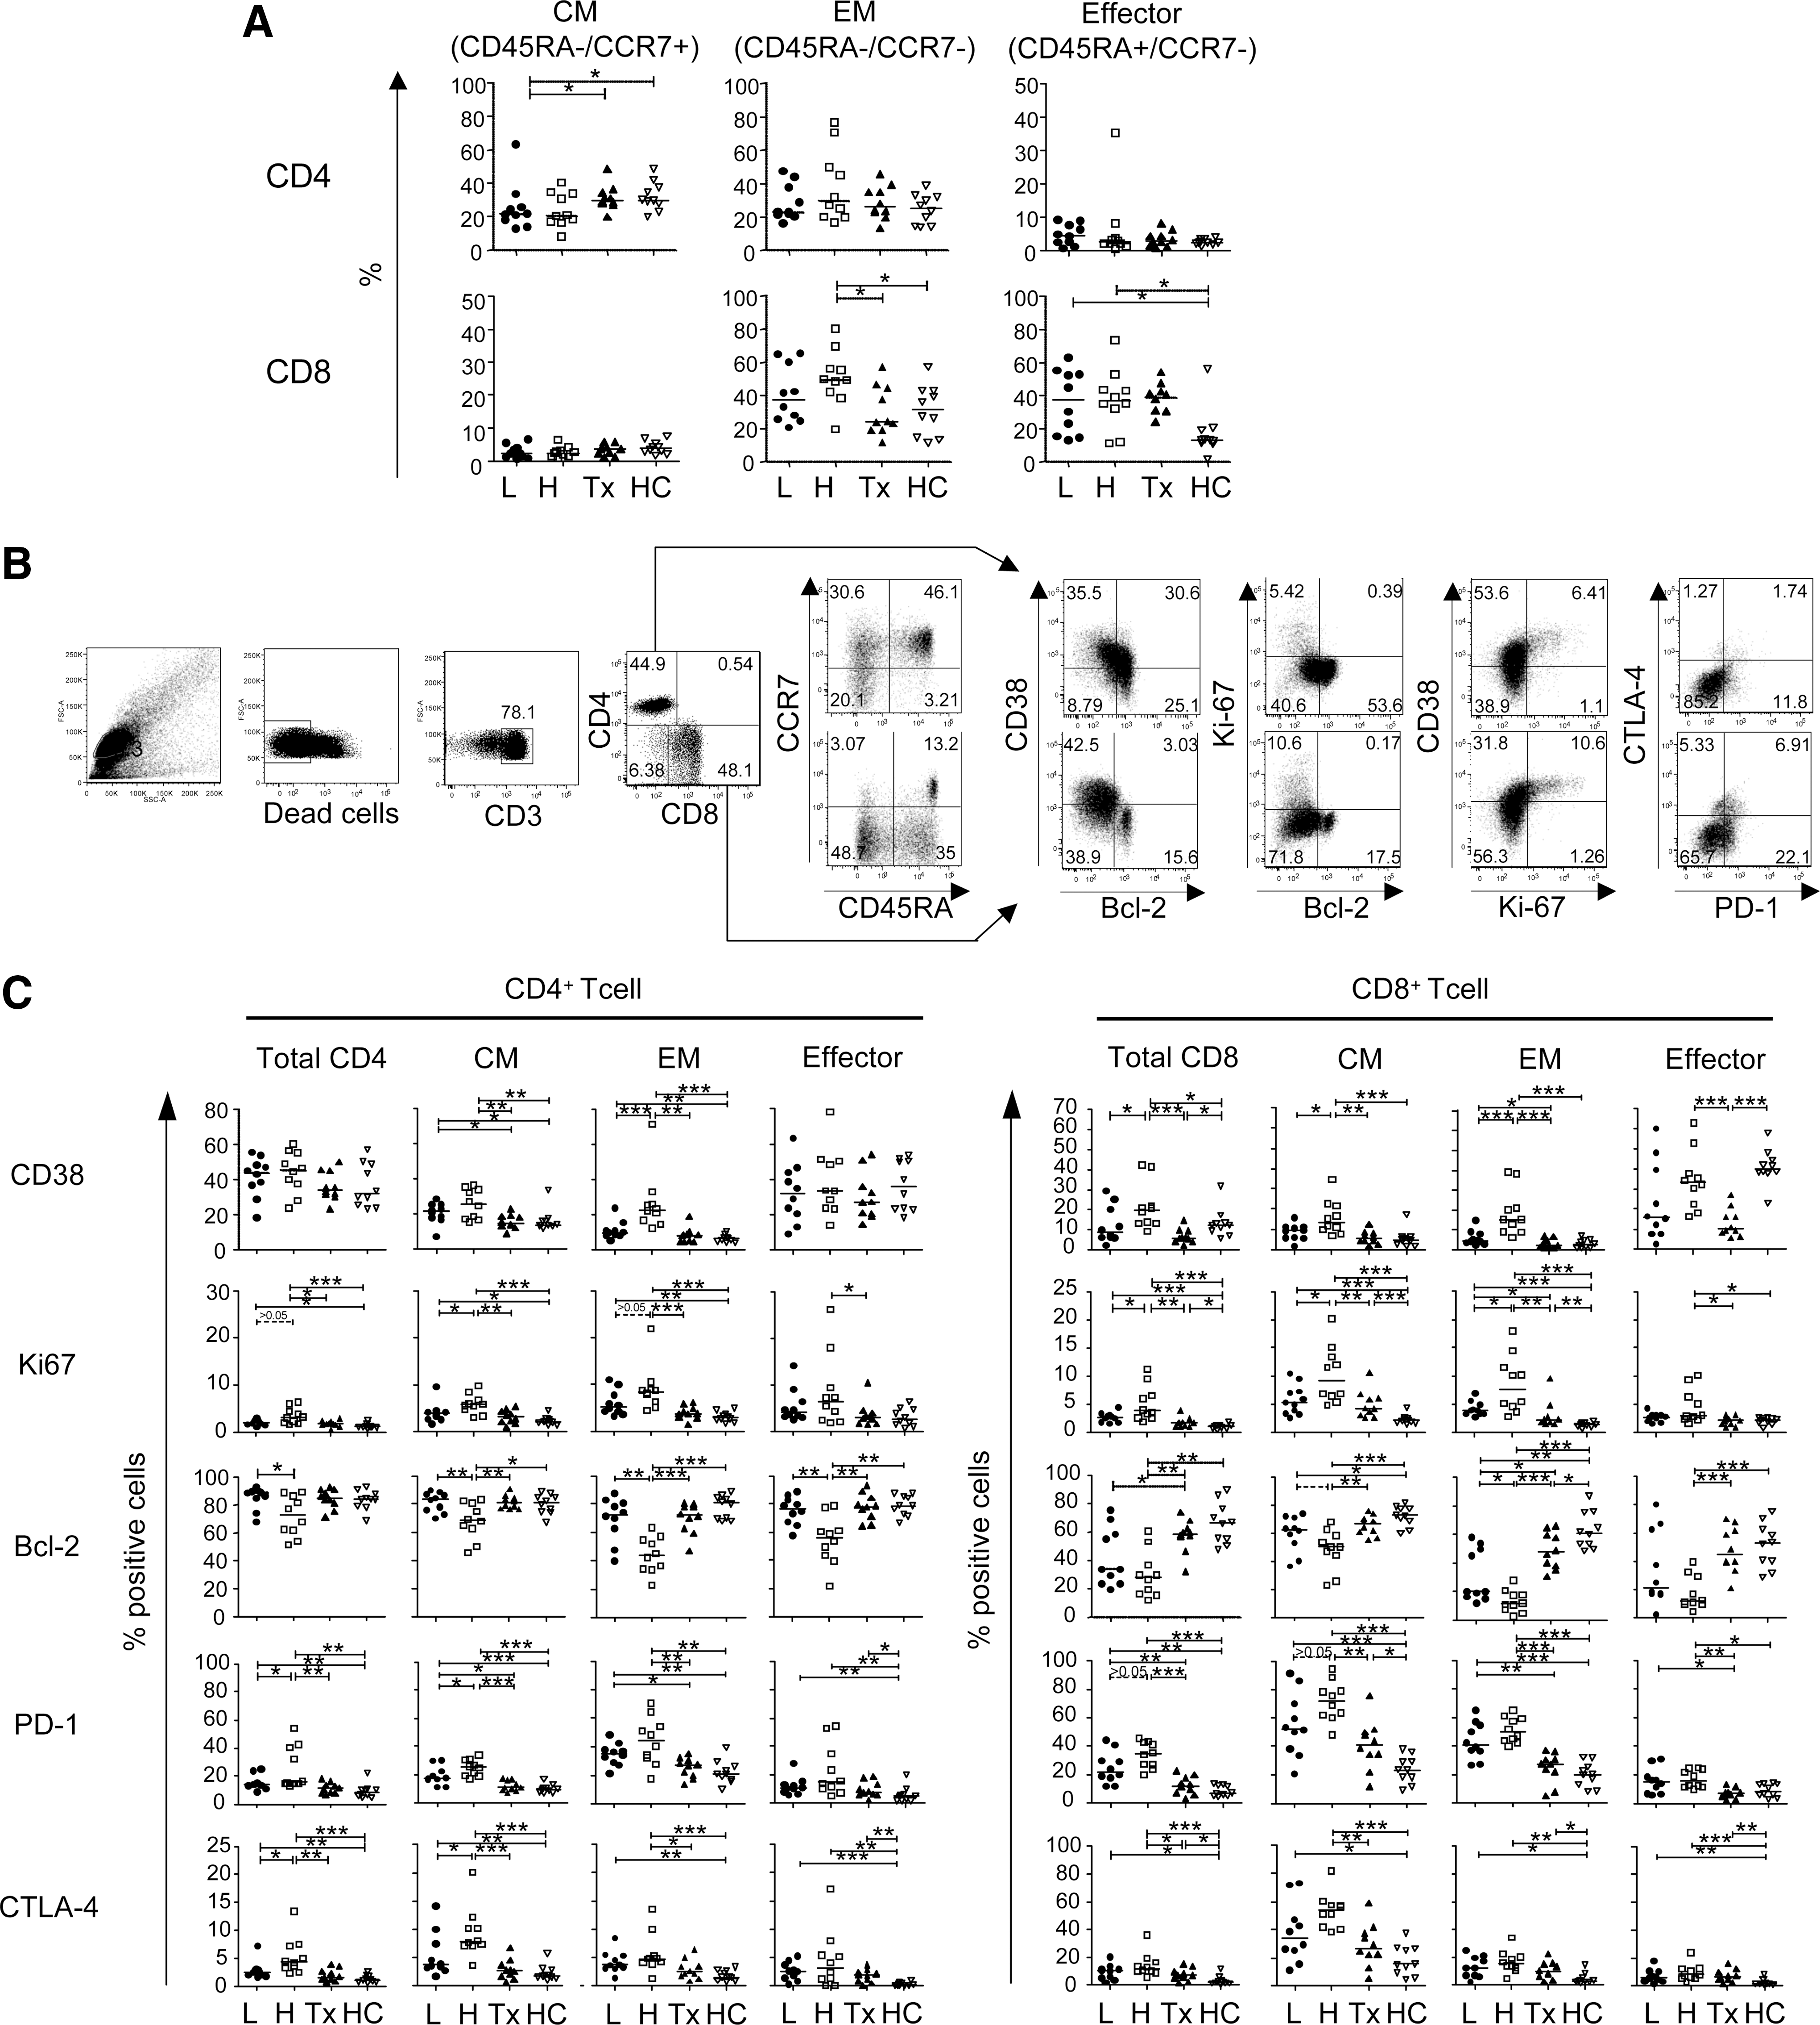
Differentiation and activation/exhaustion status of CD4+ and CD8+ T cells in HIV-1-infected subjects.
To investigate whether there are qualitative differences in T cells between HVL and LVL subjects, we analyzed the expression of CD38, Ki67, Bcl2, PD-1, and CTLA-4 as markers of the activation and exhaustion status of T cells, which seems to affect their capacity to produce cytokines (Fig. 3B). In both CD4+ and CD8+ T cells, CM and EM subsets that mainly secrete these cytokines were highly activated (CD38+, Ki67+, and/or Bcl-2−) in HVL subjects compared to LVL subjects (Fig. 3C). Especially in CM subsets of CD4+ T cells, the frequency of exhausted cells (PD-1+ and CTLA-4+) was also significantly higher in HVL subjects compared to LVL subjects (p<0.05 for both comparisons). EM subsets in CD4+ T cells and CM and EM subsets in CD8+ T cells also tended to be highly exhausted, although these differences were statistically insignificant in HVL subjects. These data indicate that memory CD4+ and CD8+ T cells, but not naive and effector subsets, are highly activated and exhausted in HVL subjects.
Poor cytokine production is directly correlated with activation/exhaustion status in memory T cells
As exhausted memory CD8+ T cells fail to produce effector cytokines, such as IL-2, IFN-γ, and TNF-α, upon antigen stimulation, 27,28 we analyzed the relationship between the expression level of activation/exhaustion markers (CD38, Ki67, Bcl2, PD-1, and CTLA-4) on memory CD4+ and CD8+ T cells and the reduced production of cytokines seen in HVL subjects in response to PHA stimulation. The proportions of PD-1+ and CD38+ cells in CM subsets were inversely correlated with the capacity to produce MIP-1α, MIP-1β, RANTES, IFN-γ, and IL-17 (Fig. 4, and data not shown). In the EM subsets, proportions of PD-1+ and CD38+ cells, but not of CTLA4+ cells, were inversely correlated with cytokine production. These data suggest that the compromised productive capacity of Th1-related and IL-17 cytokines is directly associated with persistent activation and exhaustion in memory T cells.
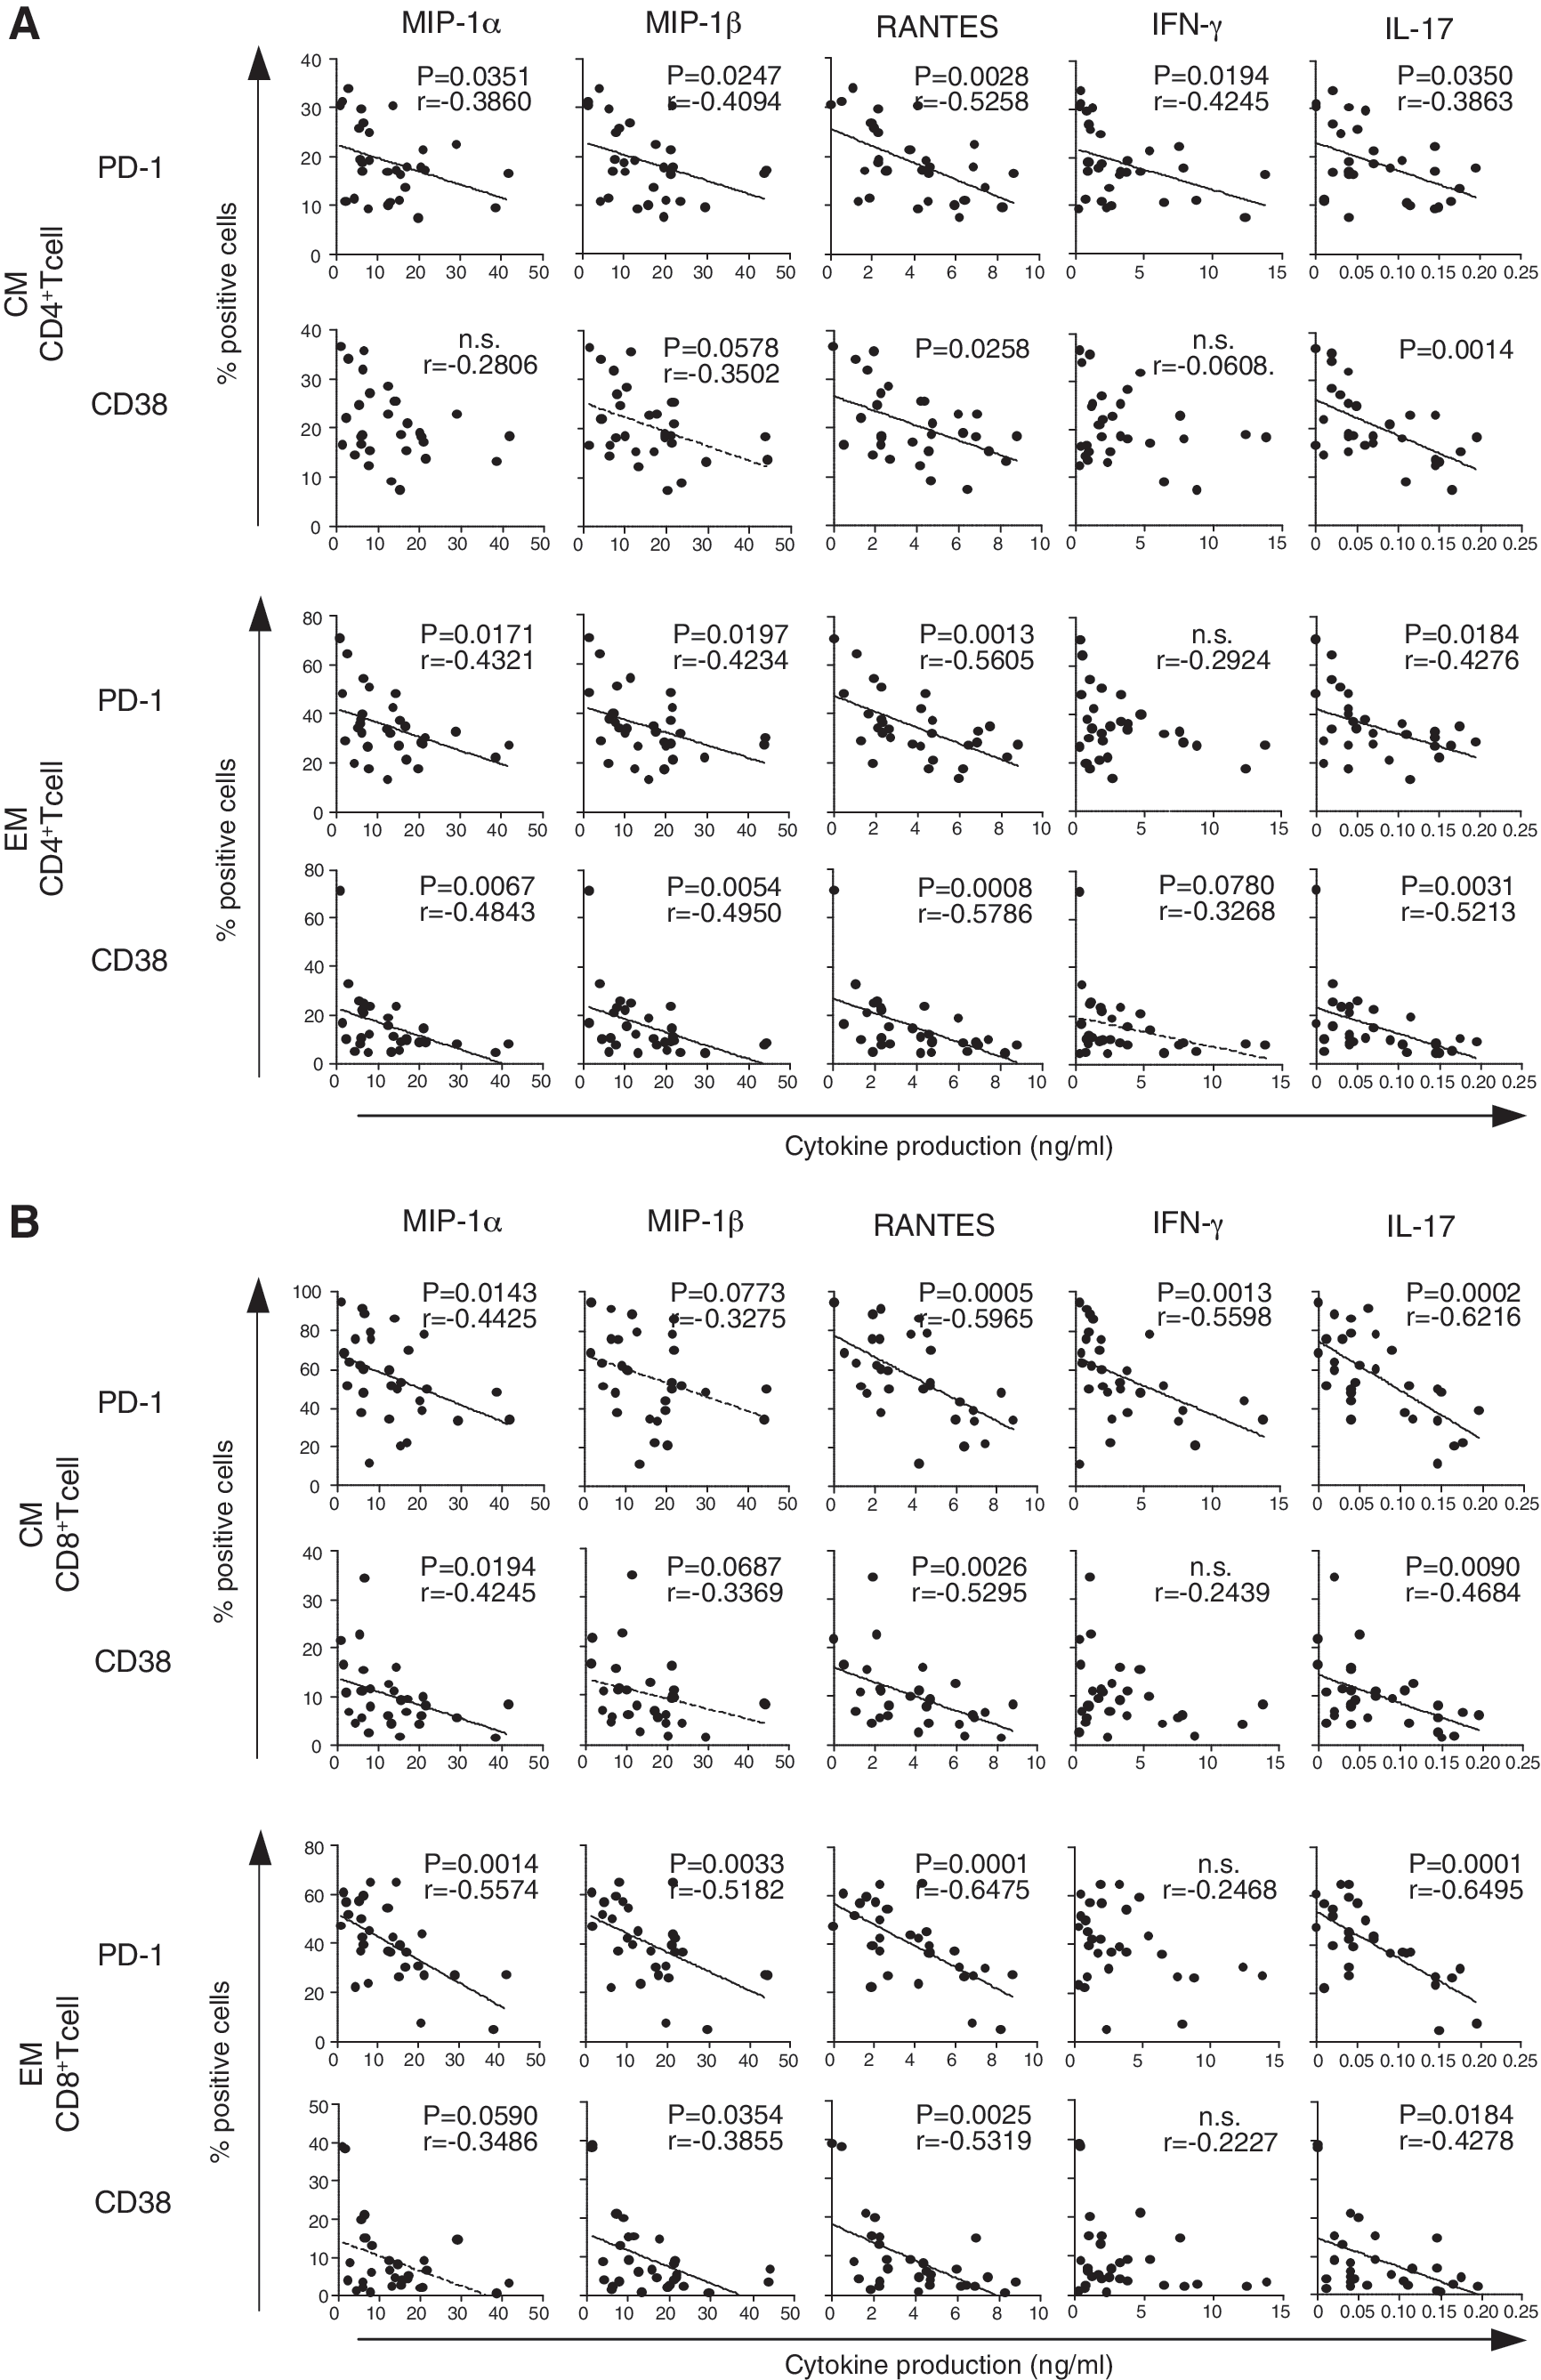
Correlation between activation/exhaustion status in memory T cell subsets and cytokine production. Each panel indicates the relationship between the frequency of PD-1 or CD38 expressing cells in central memory (CM) and effector memory (EM) T cells and each cytokine production. The results of CD4+ T cells and CD8+ T cells are shown in
Cytokine production capacity is recovered soon after ART initiation, but memory CD8+ T cells remain activated and exhausted even after prolonged viral suppression by ART
To explore whether the low cytokine production in HVL subjects is a cause or a consequence of high viral load, we compared cytokine production in subjects whose VL had been suppressed by ART for a prolonged period (>22 months) and whose CD4 count was at a similar level to that of HVL and LVL subjects (Tx subjects). In these subjects, production of the cytokines that were decreased in HVL subjects (MIP-1α, MIP-1β, RANTES, IFN-γ, sIL-2R, IL-7, and IL-17) was significantly higher than in HVL subjects, and production of MIP-1α, MIP-1β, sIL-2R, IL-7, and IFN-γ was at a similar level to that seen in LVL and HC subjects (Fig. 1A). Production of RANTES and IL-17 was higher in subjects with long-term viral suppression than in the other groups.
To clarify the relationship between VL and cytokine production capacity, we performed a similar analysis in subjects with dramatic reductions in VL due to recent ART initiation. We measured cytokine production from PBMCs isolated from blood drawn from six HIV-1-infected subjects within 1–2 months after starting ART, when VL had undergone dramatic reduction (mean VL=440 copies/ml, range 63 to 1100) (Fig. 5A). The levels of cytokines MIP-1α, MIP-1β, RANTES, and IL-7 produced after PHA stimulation were comparable to those seen in subjects with long-term suppression from ART (Fig. 5B). These data indicate that dysfunction of these cytokine production in individuals with high VL is reversible and is recovered soon after the VL reduction.
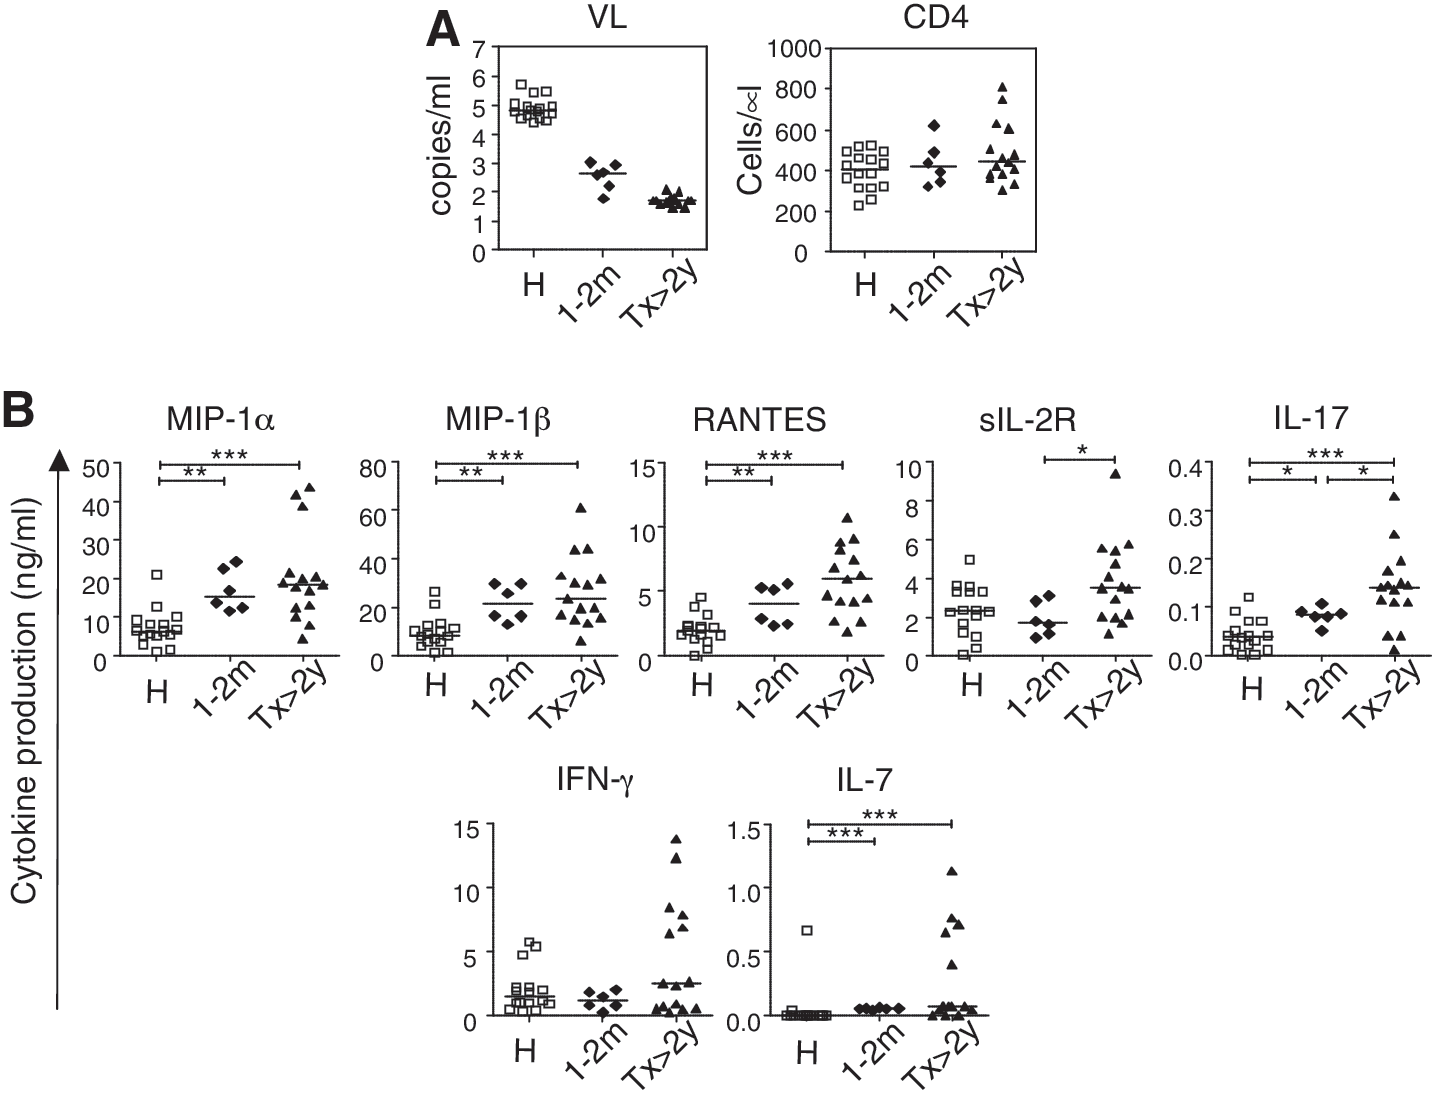
Rapid recovery of cytokine production after initiation of antiretroviral therapy.
We also analyzed the activation and exhaustion status of CD4+ and CD8+ T cells in treatment-experienced (Tx) subjects (Fig. 3C). With the sole exception of CTLA-4 expression on the EM subset in CD8+ T cells, proportions of activated (CD38+, Ki67+, and Bcl-2−) cells and exhausted (PD-1+ and CTLA-4+) cells within both memory CD4+ and CD8+ T cell populations were significantly lower in Tx subjects compared to HVL subjects (Fig. 3C).
We next examined the activation/exhaustion status of memory CD4+ and CD8+ cells in Tx subjects compared to uninfected control subjects to determine whether the T cell status can revert to normal status after prolonged viral suppression by ART. The Tx and HC groups did not differ significantly in expression levels of markers in memory CD4+ T cells (Fig. 3C). In contrast, the two groups differed significant in the activation/exhaustion status of memory CD8+ T cells, with higher levels of Ki67, PD-1, and/or CTLA-4 expression and lower levels of Bcl-2 expression, in Tx subjects compared to HC subjects. These data suggest that although suppression of HIV-1 replication by ART dramatically improves the cytokine production capacity of T cells to a normal level, memory CD8+ T cells, but not memory CD4+ T cells, remain somewhat activated even after prolonged viral suppression.
Discussion
Despite intensive research, it remains unclear how HIV-1 can cause the collapse of the host immune system and development of AIDS after chronic infection. In this study, we demonstrate that high HIV-1 viral load associates with skewed T cell dysfunction in cytokine production, independently of CD4 T cell count. Diminished cytokine production in subjects with high VL is specific for some Th1-related cytokines (MIP1-α, MIP-1β, RANTES, and IFN-γ), IL-17, IL-7, and sIL-2R, and is associated with activation and exhaustion status in both CD4+ and CD8+ T cells, especially in memory subsets. The dysfunctional production of these cytokines in HVL subjects appears to be reversible, with recovery occurring after VL reduction by ART.
In this study, we tried to find as many cytokines as possible that differ between LVL and HVL subjects. For this reason, we used a strong stimulus and long incubation times to show the results clearly. The 48-h culture period is long enough to allow expression both of late-response genes and of secondary response genes that may be induced following the primary response.
Production of MIP-1α, MIP-1β, and RANTES was dramatically reduced in HVL subjects and showed a close inverse correlation with plasma VL (Fig. 1). As the natural ligands of HIV-1 coreceptor CCR5, MIP-1α/MIP-1β/RANTES are potent inhibitors of CCR5-tropic HIV-1 (R5-HIV-1) infection. 29 Physiologically, these chemokines also play a key role in induction of cellular immune responses by recruiting CCR5+ Th1 lymphocytes to the infectious site in vivo. 30 –33 In the case of HIV-1 infection, decreased production of these chemokines seems to favor both viral expansion and reduced migration of effector T cells in vivo. In recent studies, a high copy number of CCL3L1 (one of the genes encoding MIP-1α) combined with a low CCR5 expression genotype was associated with low VL in HIV-1-infected subjects, 34,35 suggesting that CCL3L1-CCR5 genotypes may be able to modify the clinical course of HIV-1 infection.
In our study plasma VL affected the ability of T cells to produce IFN-γ, one of the cytokines that defines Th1 cells, and IL-17, which is a Th17-type cytokine. However, no effect was seen on Th2-type cytokines (IL-4, IL-5, and IL-13) or IL-10. Interferon-γ, MIP-1α, MIP-1β,and RANTES are produced by Th1 cells (Fig. 2B), which preferentially express CCR5, 30 and Th17 cells are known to express CCR5 in peripheral blood. 36,37 However, Th2 cells do not express CCR5. 30 Transcription of these cytokines in T cells may be influenced by CCR5 signaling. Large amounts of R5-HIV-1 or the Env protein might persistently trigger the signaling pathway by binding to CCR5, thereby causing reductions in levels of specific cytokines in chronically HIV-1 subjects.
In our experiments, MIP-1α, MIP-1β, and RANTES were produced by IFN-γ-expressing cells in subsets of CD4+ and CD8+ T cells, and IL-17 was produced by a different subset of CD4+ T cells. Surprisingly, IL-17 production was strongly correlated with MIP-1α, MIP-1β, RANTES, and IFN-γ production even though the producer cells are different (Fig. 2F). This correlation might reflect a general ability of Th1 and Th17 cells to produce cytokines. However, IL-2 production was not correlated with MIP-1α, MIP-1β, RANTES, and IFN-γ production, despite the fact that IL-2 should be produced by the same IFN-γ-producing cells (Fig. 2C–F). Critical regions of IFN-γ promoter (i.e., consensus GATA motif and essential functional motif) are not found in the IL-2 promoter region, but are found in the MIP-1α and MIP-1β promoters. 38 In addition, the same sequence in the promoter region of IFN-γ, MIP-1α, and MIP-1β was found in the IL-17 promoter. 39 Interferon-γ, MIP-1α, MIP-1β, RANTES, and IL-17 production in T cells may be coordinately regulated, and the productive capacity of these cytokines appears to be affected by HIV-1 VL in a similar fashion. Alternatively, we measured cytokine production 48 h after PHA stimulation in this study. The period is long enough to develop sequential reactions occurring in response to primary reaction. As IFN-γ is known as an early-response gene and has the potential to affect multiple immune responses, 40 the production of MIP-1α, MIP-1β, RANTES, and IL-17, but not IL-2 may depend on the amount of IFN-γ as the primary response. Further studies are required to elucidate the mechanism by which IL-17 production is correlated with MIP-1α, MIP-1β, RANTES, or IFN-γ production. The IFN-γ pathway protects against intracellular pathogens through cellular immunity, and IL-17 provides protection against extracellular pathogens and fungal infections. 41,42 Although their target pathogens differ, IL-17 regulates the Th1 immune response through IL-17 receptor-expressing dendritic cells (DC) and macrophages. 43 These data suggest that Th1-type and Th17-type immune responses are closely related, and that their interaction is crucial for immune protection.
In a pathogenic SIV infection model, the loss of Th17 cells in the gastrointestinal tract dampens the intestinal mucosal barrier, resulting in microbial translocation, which in turn induces systemic immune activation. 44 –47 In SIV infection the loss of Th17 cells in intestinal mucosa and in PBMCs is inversely correlated with plasma VL. 48 In this study, we observed a strong inverse correlation between IL-17 production and the proportion of activated and exhausted memory T cells. Our results suggest that not only the number of IL-17-producing cells but also the quality of those cells may account for the dysfunction of the Th17-type immune response in HVL subjects.
During chronic HIV-1 infection expression of the inhibitory coreceptors PD-1 and CTLA-4 on total T cells (not only HIV-1-specific T cells) is associated with plasma VL and CD4 count. 11,12 In this study, we found that the proportions of PD-1+, CTLA4+, and CD38+ cells in total memory subsets of CD4+ and CD8+ T cells were inversely correlated with the ability of T cells to produce MIP-1α, MIP-1β, RANTES, IFN-γ, sIL-2R, and IL-17 in response to PHA stimulation (Fig. 4). It has been reported that PD-1 expression depends on the status of activation markers such as CD38 and on the differentiation stage of T cells. 49,50 Other studies have shown that blocking the pathway of the PD-1/PD-L1 interaction augments the cytokine production capacity of HIV-1-specific CD4+ and CD8+ T cells in vitro. 11,51 In our study, prolonged virus suppression by ART resulted in cytokine production capacities returning to normal (Fig. 1A). Memory subsets of CD4+ T cells were no longer activated and exhausted (Fig. 3C), although memory subsets of CD8+ T cells remained slightly activated/exhausted. These data suggest that activation and/or exhaustion of T cells is directly associated with the ability to produce these specific cytokines and that the impairment in T cell function is reversible.
Our study is the first to show that the T cell impairment in high VL subjects is specific for production of some of Th1-type and Th17-type cytokines, and that production of these cytokines is strongly correlated with one another. In subjects with high VL, a vicious cycle occurs, as T cells increasingly lose the capacity to produce these important cytokines. Notably, we also found that subjects who maintain a low VL, yet who are not “elite controllers,” are capable of producing normal levels of these cytokines. These findings could be useful in guiding the development of new therapies focusing on immune control to reduce T cell activation in chronic HIV-1 infection.
Footnotes
Acknowledgments
We thank Nobukazu Watanabe for his technical advice and helpful discussion. This work was supported by a Grant-in-Aid for Scientific Research (C) (22590412) from the Japan Society for the Promotion of Science (JSPS), Grants for AIDS research from the Ministry of Health, Labor, and Welfare of Japan, a contract research fund from the Ministry of Education, Culture, Sports, Science and Technology (MEXT) for Program of Japan Initiative for Global Research Network on Infectious Diseases (J-GRID), and Global COE Program (Center of Education and Research for Advanced Genome-Based Medicine, for personalized medicine and the control of worldwide infectious diseases, of MEXT.
Author Disclosure Statement
No competing financial interests exist.