
Abstract
Patients failing antiretroviral treatment for extended periods of time are at risk of accumulating HIV drug resistance mutations (DRMs), which negatively influences second-line treatment. This retrospective study assessed the rate of DRM accumulation among South African patients with continued virological failure. Serial genotypic resistance testing was performed and DRMs were scored according to the 2009 IAS-USA list. Among 43 patients, 38 (88.4%) harbored ≥1 DRM. The median time between two sequential resistance tests was 5 months (IQR: 3–10). Thymidine analogue mutations accumulated at a rate of 0.07 mutation per month of drug exposure, which is faster than previously reported. Routine virological monitoring should be implemented in resource-limited settings to preserve susceptibility to second-line regimens.
Introduction
As the number of patients receiving antiretroviral treatment (ART) has expanded in South Africa, so too has the number experiencing first-line regimen failure. 1 –3 HIV drug resistance data emerging from South Africa have generally revealed patterns similar to those seen in HIV-1 subtype B virus. 4 –6 In contrast to other countries in sub-Saharan Africa, studies from South Africa have reported fewer thymidine analogue mutations (TAMs) at failure of first-line ART, likely to be related to the use of viral load (VL) monitoring in the public sector program. 5 –7 A study from Malawi described complex resistance profiles in patients diagnosed with clinical and/or immunological treatment failure. 8 Similarly, a meta-analysis has also revealed a higher frequency of genotypic resistance in less frequently monitored patients in resource-limited settings. 9
Patients receiving a virologically failing regimen containing nucleoside reverse transcriptase inhibitors (NRTIs) for extended periods of time are at risk of acquiring multiple TAMs, the K65R and/or Q151M mutations, which confer broad NRTI cross-resistance and may decrease the effectiveness of second-line treatment options. Limited data are available as to how fast TAMs and other NRTI mutations accumulate, especially in resource-limited settings. The current study aimed to assess resistance patterns and the rate of accumulation of mutations among South African patients with continued virological failure on first-line ART.
Materials and Methods
Patients and study design
Patients receiving ART at the Charlotte Maxeke Academic Hospital in Johannesburg who had been diagnosed with virological treatment failure and referred for genotypic HIV resistance testing were eligible for this retrospective cohort study. ART was administered according to national treatment guidelines and virological failure was defined as a VL over 5000 RNA copies/ml confirmed on two separate occasions. 10 Genotyping conducted at the clinical visit at which ART was switched to second-line, is referred to as time point 0 (T0). For each patient, additional resistance testing was conducted retrospectively whenever specimens were available; the time point of first detection of viremia is denoted T−1. Clinical outcome after switch to second-line treatment was also assessed and defined as T+1.
Population genotype analysis
Population-based genotyping was performed using an in-house HIV drug resistance assay.
11
Briefly, viral RNA was extracted using the automated Roche MagNa Pure LC analyzer and the MagNa Pure LC Total Nucleic Acid Isolation Kit (Roche, Germany). A 1.7-kb amplicon was generated by a reverse transcriptase (RT)-initiated polymerase chain reaction encompassing the entire protease (PR) and partial RT coding regions, using primers designed from the consensus HIV-1 subtype C sequence available on the Los Alamos Database (
Statistical data analysis
Statistical analysis was performed using Stata version 10 (StataCorp LP, TX). The difference in frequency of DRMs occurring with and without TAMs was compared using Pearson's chi-square test or Fisher's exact test for small samples. A p-value of <0.05 was considered significant. For patients with multiple resistance tests, the rate of mutation accumulation was calculated as the number of mutations detected at T0 that had not been detected at T-1, divided by the person-months of follow-up between the tests. Separate rates were calculated for all persons at risk at T-1 and for those with ≥1 TAM identified at T0. All patients with a resistance test at T-1 were considered as persons at risk for DRM accumulation.
Results
Patient characteristics
Between January 2006 and August 2009, 43 patients were referred for resistance testing and switched to second-line ART. The median age was 33 years old [interquartile range (IQR): 28–40.3] and 69.8% of patients were female. The median VL at time of treatment switch was 26,000 HIV RNA copies/ml (IQR: 7500–106,000) and the median CD4 count was 169 cells/μl (IQR: 77–289). The median time spent on the first-line regimen was 22 months (IQR: 13–50 months). First-line ART consisted of NNRTI-based regimens, with the majority (n=26) of patients receiving stavudine (d4T) in combination with lamivudine (3TC) as the NRTI component. Patients who experienced toxicity to d4T were changed to zidovudine (AZT, n=10) or tenofovir (TDF, n=2). All patients were infected with HIV-1 subtype C. For 37 patients with prior VL tests, the median time between first detection of viremia and treatment switch was 7 months (IQR: 4–13).
Mutational patterns at routine resistance testing (T0)
Table 1 shows resistance patterns at time of treatment switch (T0) for both patients with and without TAMs. In total, 38 (88.4%) patients harbored any DRM at time of failure and 34 (79.1%) had dual-class resistance. The most frequent NRTI mutation was the M184V (n=32; 74.4%), followed by the TAMs (n=23 with ≥1 TAM; 53.5%). Ten (23.3%) patients harbored ≥2 TAMs and the D67N TAM pathway was preferred. The frequencies of Q151M and K65R mutations were n=1 (2.3%) and n=3 (7.0%), respectively. The K103N (n=21; 48.8%) and V106M (n=12; 29.9%) were the most frequent NNRTI mutations observed. No significant difference was observed between the frequency of M184V and K65R between the group with and without TAMs (p=0.128 and p=0.554, respectively). All patients were infected with HIV-1 subtype C.
Resistance Patterns for Patients with Thymidine Analogue Mutations Versus Those Without Thymidine Analogue Mutations
Frequencies of individual TAMs: M41L, 7 (16.3); D67N, 8 (18.6); K70R, 6 (14.0); L210W, 3 (7.0); T215Y/F, 14 (32.6); K219Q, 4 (9.3).
Data are n (%) of patients. TAM, thymidine analogue mutation; (N)NRTI, (non)nucleoside reverse transcriptase inhibitor; n/a, not applicable.
Accumulation of mutations (T-1 to T0)
Figure 1 shows the increase of TAMs and any (N)NRTI mutations for 29 patients with paired resistance tests. The median time between T-1 and T0 for these patients was 5 months (IQR: 3–10). At T-1, the mean number of TAMs was 0.59 and at T0 this increased to 1.03. In absolute terms, 13 TAMs were acquired in a total of 190 person-months, resulting in a rate of accumulation of 0.07 TAM per month [confidence interval (CI): 0.04–0.11] for all persons at risk. Patients with ≥1 TAM at T0 (n=13) accumulated mutations at a rate of 0.15 mutation per month (CI: 0.08–0.25). This group was further divided into patients with one to three TAMs and patients with four to five TAMs at T0, and the respective rates of TAM accumulation were 0.08 mutation per month (CI: 0.02–0.20) and 0.24 mutation per month (CI: 0.12–0.41). The accumulation rate for any NRTI-associated mutations was 0.05 (CI: 0.03–0.09) per month, and for NNRT-associated mutations 0.03 (CI: 0.01–0.06) per month for all persons at risk at T-1.
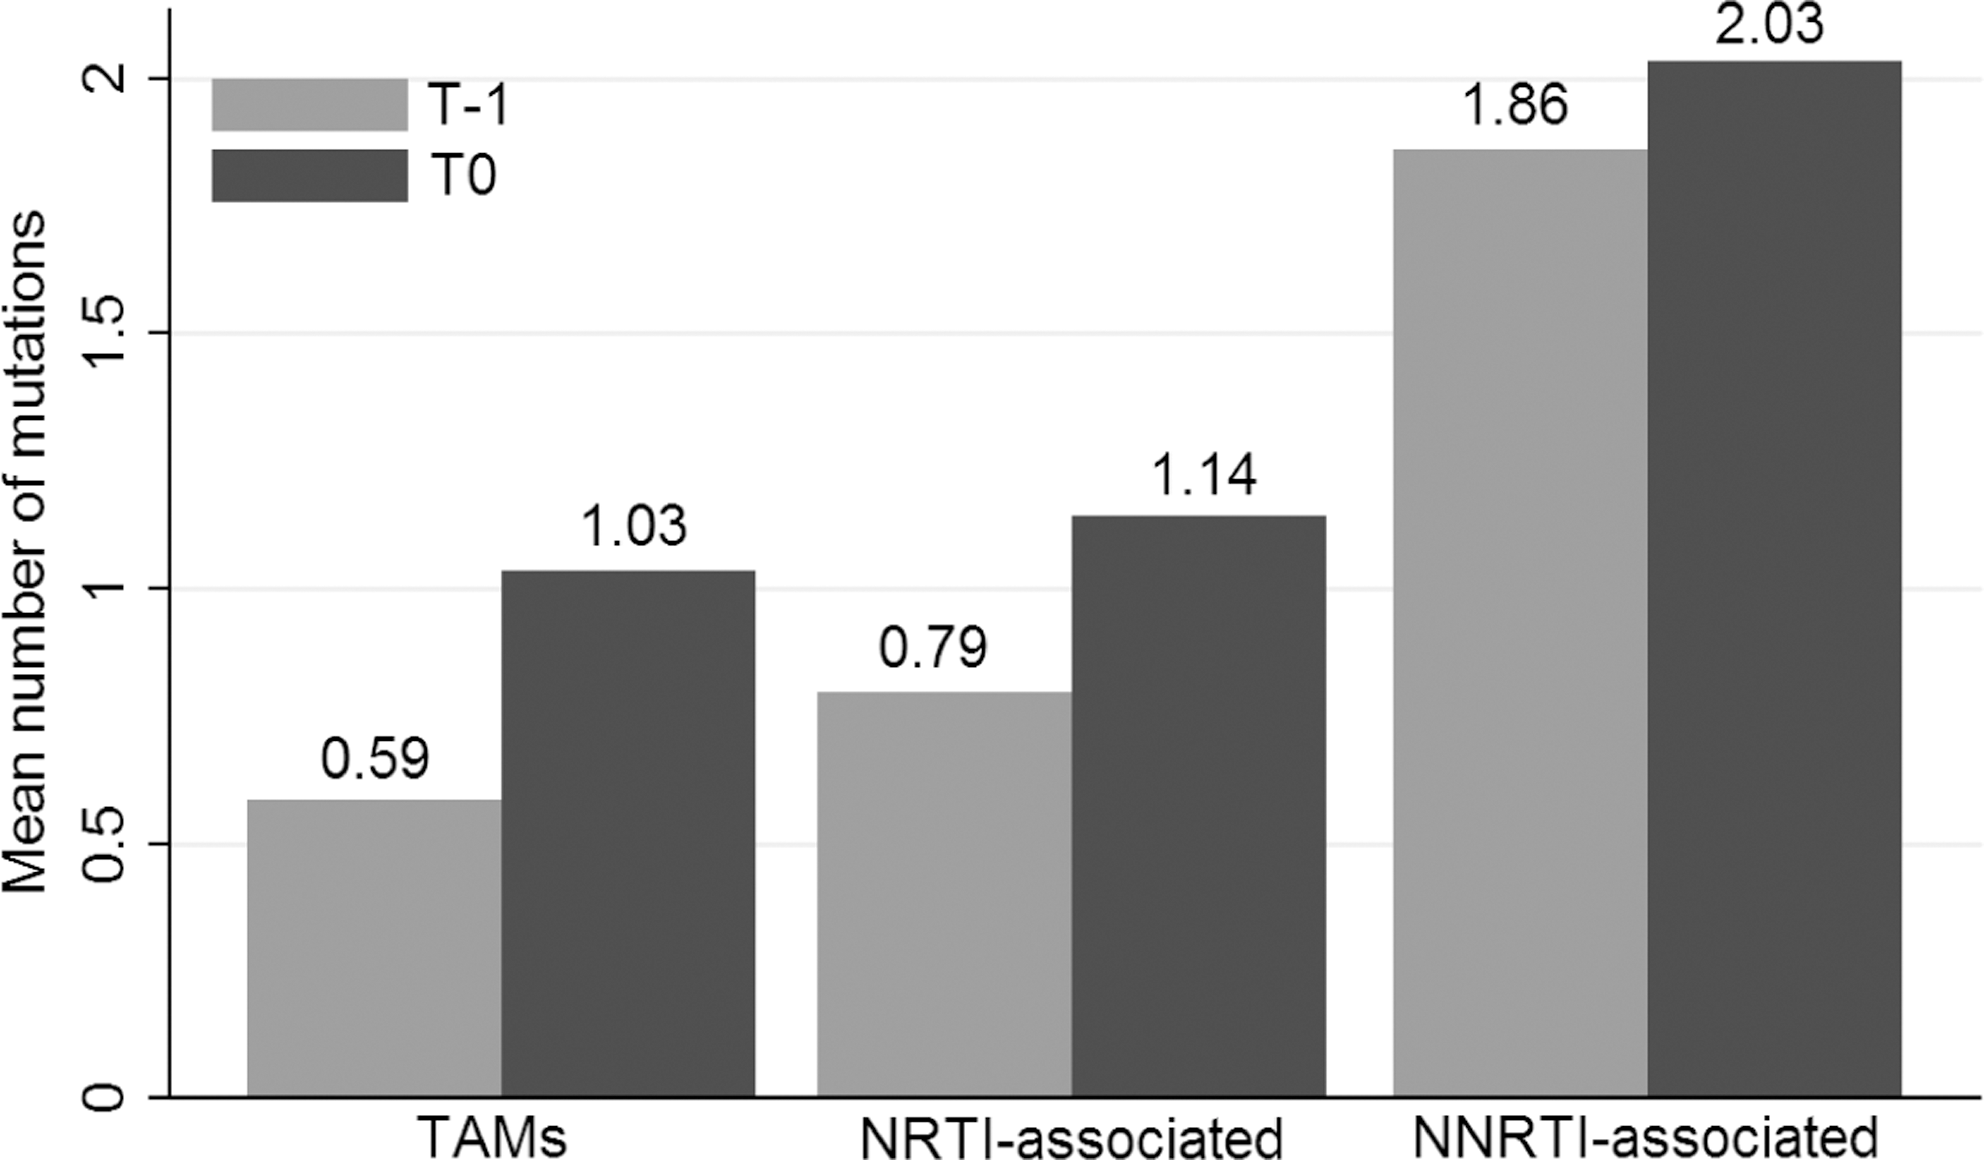
Increase of mutations between T-1 and T0 for 29 patients with multiple resistance tests. TAM, thymidine analogue mutation; (N)NRTI, (non)nucleoside reverse transcriptase inhibitor. T0 is the time point of the last resistance test, conducted at the visit at which antiretroviral therapy was switched to second-line; T-1 is the time point of the first resistance test, conducted retrospectively at the first detection of viremia.
Outcome on second-line treatment
Clinical outcomes on second-line treatment were assessed after a median of 22 months (IQR: 13.5–28). Twenty-five (58.1%) patients achieved full virological suppression, of which 14 (56%) had complex DRMs that included TAMs, K65R, or Q151M at T0. Seven (16.3%) patients failed second-line ART, of whom two never suppressed following treatment switch and five experienced virological rebound. Within this group, four (57.1%) subjects had TAMs, K65R, or Q151M at T0. The proportion with complex DRMs at T0 was not significantly different for patients who achieved virological suppression versus those who failed second-line ART (p=0.649). For the remaining 11 patients, no follow-up information was available.
Discussion
This study provides important information on the accumulation of HIV drug resistance among patients with prolonged virological failure of first-line ART in South Africa. A considerable frequency of clinically significant mutations was observed, including multiple TAMs (23.3%), and K65R (7.0%) or Q151M (2.3%) mutations. TAMs accumulated at a high rate of 0.07 mutation per month of drug exposure after the first detection of viremia, resulting in one new TAM for every 14.6 months of continued drug exposure. While the South African 2010 national treatment guidelines recommend using TDF in first-line regimens, 14 the resistance data presented from failures of regimens containing d4T and AZT remain very relevant for resource-limited settings.
An unusual contribution of our study is the repeated resistance testing on patients with persistent viremia while receiving first-line ART, enabling us to assess the accumulation of mutations. This information is useful for informing clinical decisions, such as how rapidly to switch to second-line therapy after detecting viremia. A limitation of this study is the small sample size and erratic nature of sampling for resistance testing. When VL monitoring is available, deliberately leaving patients on failing regimens is no longer ethical and it is impossible to conduct prospective or randomized investigations. A second shortcoming of our study is the fact that mutations detected within the T-1 to T0 interval might reflect drug selective pressure before time point T-1. In the absence of baseline genotypic information, however, we were unable to assess the rate of mutation accumulation for the entire time of drug exposure. Nevertheless, our findings provide an estimate of mutation accumulation in patients left on failing regimens. This information is useful for clinicians and can guide them in their decision to switch regimens.
At first detection of viremia, NNRTI mutations were most commonly observed, followed by the M184V mutation. This is consistent with prior work from South Africa, which has documented first-line failure patterns with mainly NNRTI-associated mutations and multiple TAMs in only 12% 6 . Recent work using a cohort with a more stringent failure definition of 1000 RNA copies/ml revealed less complex resistance profiles with a low frequency of TAMs. 15 In our study, TAMs accumulated after a longer duration of viremia. This mirrors the situation in other African countries in which monitoring is conducted based on clinical and/or immunological grounds, resulting in a high prevalence of TAMs and complex resistance mutations at failure. 8 The most common TAM detected was the D67N, indicating that most patients had the more favorable TAM-2 pathway, as had been reported previously in South Africa. 6,16
Although the number of patients with paired resistance tests in our study was limited, we estimated a rate of one additional TAM for every 14.6 months of drug exposure. This is considerably faster than the rate of one TAM in every 4.3 years described in a European study in which resistance testing was performed at HIV-RNA >500 copies/ml. 17 To date, few studies in non-subtype B-infected patients in Africa have documented the rate of TAM accumulation. Prior work from South Africa reported that only 10% of patients had TAMs after 6 months of continued viremia on first-line ART. 18 The results found in our study population are therefore alarming, and imply that a prompt switch to second-line therapy is warranted after the first detection of viremia.
We separately evaluated the rate of accumulation in patients who had acquired ≥1 TAM at time of treatment switch (T0). These patients were found to develop 0.15 additional TAM per month, i.e., one TAM for every 6.5 months of continued drug exposure. Although evaluating a triple NRTI regimen, a study from Germany showed that TAM accumulation rates differed for patients acquiring one to three TAMs versus those acquiring four to five TAMs (0.04 and 0.23 mutation per month, respectively). 19 When we performed this analysis within our cohort, we found very similar rates of TAM accumulation (0.08 and 0.24 mutation per month, respectively), although this difference was not significant. Our sample was too small to evaluate specific risk factors for those patients with higher TAM accumulation rates. Also, in the absence of baseline genotypic information, we were unable to evaluate whether the TAM accumulation rate differed over time or over the course of the disease.
The accumulation of TAMs and complex mutations causes decreased activity of NRTIs, 20,21 bearing consequences for the effectiveness of the currently available second-line regimens in African countries. Once cross-resistance has developed, standard second-line regimens will primarily offer the benefit of the boosted PI, with limited or no additional effect of the NRTI backbone. Patients will thus receive functional monotherapy, which lowers the barrier for selection of PI resistance. 22 A study from Malawi has shown a high rate (85%) of virological suppression on second-line ART despite extensive NRTI resistance. 23 In our study, over half of the patients, including those with complex DRMs, achieved virological suppression on second-line ART. Despite these relatively favorable on-treatment outcomes, a study of PI monotherapy after failure of an NNRTI-based regimen revealed a high incidence of low-level viremia. 24 Therefore, patients with extensive NRTI resistance at time of switch to PI-based ART should receive intensive adherence counseling and frequent virological monitoring. A high rate of attrition, likely due to poor tolerability and toxicity of second-line regimens, accounted for the low overall success rate on second-line ART in our study. Active patient tracing therefore remains of key importance after regimen switch.
In conclusion, the degree and pattern of HIV drug resistance detected after prolonged virological failure of first-line ART are likely to negatively impact future regimes containing NRTI backbones. These findings underscore the need to perform viral load testing to detect failure early and guide treatment switch. The standard of care in South Africa now includes yearly routine virological monitoring, 14 and this policy should be implemented in other African countries as well. Further research should focus on the optimal frequency of virological monitoring to reduce the risk of the accumulation of resistance mutations and protect the susceptibility to second-line and subsequent therapies.
GenBank Accession Numbers
Genbank accession numbers for sequences in this study are: JN381557, JN381571, JN381572, JN381576, JN381577, JN381579, JN381580, JN381581, JN381583, JN381584, JN381585, JN381595, JN381596, JN381604, JN381605, JN381606, JN381607, JN381611, JN381612, JN381614, JN381615, JN381616, JN381617, JN381619, JN381620, JN381621, JN381625, JN381558, JN381573, JN381578, JN381582, JN381586, JN381597, JN381608, JN381613, JN381618, JN381622, JN381559, JN381574, JN381587, JN381598, JN381609, JN381623, JN381560, JN381575, JN381588, JN381599, JN381610, JN381624, JN381561, JN381589, JN381600, JN381562, JN381590, JN381601, JN381563, JN381591, JN381602, JN381564, JN381592, JN381603, JN381565, JN381593, JN381566, JN381594, JN381567, JN381568, JN381569, JN381570.
Footnotes
Acknowledgments
The authors are grateful to all study participants, clinicians, and staff at participating clinics. We also thank investigators and staff who contributed to this research at the University of the Witwatersrand in Johannesburg.
W.S., T.F.R.W., and C.W. conceived the study. C.W. and W.S. supervised data collection and laboratory testing. K.C.E.S. and C.W. performed data analysis and finalized the manuscript. C.W., W.S., and T.F.R.W. critically reviewed the paper. All authors contributed to subsequent drafts and reviewed and approved the final manuscript.
This work was an initiative of the University of the Witwatersrand and PharmAccess Foundation. The authors are grateful for financial support received from Stichting Aids Fonds in The Netherlands (grant number 2006083). The funders had no role in the study design, data collection, data analysis, data interpretation, decision to publish, or writing of the report. The content of this publication is solely the responsibility of the authors and does not necessarily represent the official views of any of the institutions mentioned above.
Author Disclosure Statement
No competing financial interests exist.