
Abstract
HIV subtype C has previously been shown to infect hematopoietic progenitor cells (HPCs) at a significantly higher rate than subtype B. To better understand the subtype-specific nature of HPC infection, we examined the prevalence of HPC infection in vivo by HIV-1 subtypes A and D. HIV-1 infection of HPC was examined in 40 individuals, 19 infected with subtype A and 21 with subtype D, using a single colony assay format. DNA from 1177 extracted colonies was tested for integrated viral DNA of the p24 gene. Four colonies were found to be stably infected, three of 462 colonies (0.65%) from HIV-1A-infected individuals (1/19 individuals) and one of 715 colonies (0.14%) from HIV-1D-infected individuals (1/22 individuals). These rates of colony infection were comparable to the rates observed in PBMCs from the same subjects. Additionally, no correlation was observed between cell colony density and circulating viral load or proviral load. Our findings suggest that HIV-1 subtypes A and D do not preferentially infect colony-forming HPCs over mature HIV target cells in vivo.
Mature blood cells are derived from pluripotent hematopoietic stem cells through a complex expansion and maturation cascade, which includes various developmental progenitor stages. 1 The ability of HIV-1 to infect these hematopoietic progenitor cells (HPCs) has been investigated as a potential cause of the many hematopoietic abnormalities observed in infected individuals. 2 –5 HIV-1 has been detected in a variety of hematopoietic progenitor cell types suggesting that HIV-1 is capable of infecting HPCs. 3,4,6,7 However, other studies have not detected HIV-1 infection in HPCs leading to questions about the relevance and extent of HPC infection in vivo. 5,8 –11 However, a recent finding by Carter et al. established that HIV-1B is capable of infecting HPCs both in vitro and in vivo, and credits the lack of evidence for infection in the earlier studies to the difficulty of maintaining HPCs in culture and establishing cells that are infected using indirect measurements that are subject to contamination by other cell types. 3 Interestingly, this issue with possible contamination of mature cells was raised for the Carter et al. study as well, even though they attempted to control for possible contamination by observing that the proviral load of CD34+ cell-depleted total bone marrow mononuclear cells was lower than the proviral load from purified CD34+ cells. 12
The differences in these findings could also be partially explained through differences in the infecting viral strains. 4 Early studies primarily used HIV-1 subtype B (HIV-1B) despite the fact that HIV-1B infection of HPCs is a rare event in vitro and in vivo. 4,5 In contrast, HIV-1C appears to be more efficient in infecting HPCs in vitro than HIV-1B. 4 In an HIV-1C-infected population, there was a negative correlation between viral levels and hematopoietic colony growth, which suggests that this increased cell tropism may also affect hematopoiesis. 2 These effects on hematopoiesis may have clinical implications as well, since it was found that HIV-1C infection of HPCs was associated with increased rates of anemia in this population. 4
Although HIV-1C has been shown to infect HPCs at a higher rate than HIV-1B, the ability of subtypes A (HIV-1A) and D (HIV-1D) to infect HPCs remains unclear. 3,7 Using a single-colony infection assay, we examined rates of in vivo HPC infection in subjects infected with either HIV-1A or HIV-1D in a population of subjects from rural Uganda.
Serum samples were collected from subjects enrolled in a community-based closed cohort study in Kayunga District, Uganda. This population has been described previously. 13 Viral subtype was previously determined using a multiregion hybridization assay. 14 Nineteen subjects infected with HIV-1A and 21 subjects with HIV-1D were selected for analysis. Preference was given to subjects with lower CD4 counts and sample availability. All subjects were treatment-naive at the time of sample collection.
Peripheral blood mononuclear cells (PBMCs) from subjects were used in a single-colony infection assay. The protocol used for plating, scoring, isolating, and establishing infection of the colonies has been previously described except that PBMCs were not purified according to CD34 cell expression because of a limited concentration of cells available. 4 Briefly, PBMCs were washed and plated at a maximum concentration of 1.0×10⁶ cells per ml in methylcellulose medium in a 96-well plate format (Stemcell technologies, Vancouver, BC). The cells were incubated for 2 weeks at 37°C at which time hematopoietic growth was scored visually for growth of burst-forming unit erythroid (BFU-E), colony-forming unit-granulocyte, macrophage (CFU-GM), and colony-forming unit-granulocyte, erythrocyte, macrophage, megakaryocyte (CFU-GEMM) colonies. A maximum of 44 wells containing only a single colony as well as four control blank wells (no colonies detected) were isolated with 190 μl of phosphate-buffered saline. Isolated colonies were determined by inclusion of all single CFU-GEMM colonies and a random distribution of the remaining available CFU-GM and BFU-E colonies up to the maximum of 44 wells. Genomic DNA was purified using a QiAmp DNA Mini and Blood Mini Kit from all colonies and tested for integrated viral p24 DNA and host-cell albumin using quantitative real-time polymerase chain reaction. 4 In addition, proviral loads were determined from DNA isolated directly from the isolated PBMCs using the same protocol. To be classified as stably infected, a colony was required to have a proviral load/housekeeping gene ratio of 0.3 to 0.7 and a raw quantitative proviral value greater than 20 copies on two separate runs.
Lymphocyte immunophenotyping and viral load assessment were performed as previously described. 13 In short, CD4+ T cell absolute counts and percentages were determined from EDTA anticoagulated whole blood using the single platform BD Multitest IMK Kits with Trucount tubes (BD Biosciences, San Jose, CA). Samples were acquired using a dual laser BD FACSCalibur and analyzed using BD Multiset software. Viral loads were determined from plasma separated from EDTA anticoagulated whole blood using the AMPLICOR HIV-1 MONITOR Test, version 1.5 (Roche Diagnostics, Indianapolis, IN). The viral load assay was run in standard mode and the detectable range was 400–750,000 viral copies/ml.
Viral and hematological markers were compared between subtypes using a Mann–Whitney rank sum test. Spearman rank order was used to compare total colony count with CD4 and viral load. Data were considered statistically significant if the p value <0.05.
HIV viral load did not differ between the two populations (HIV-1A median log viral load=5.08, IQR 4.57–5.35; and HIV-1D median log viral load=5.01, IQR 4.47–5.18; p=0.229) (Fig. 1A). The median proviral load did not differ between populations (HIV-1A median proviral load=0.31, IQR 0.07–0.77, and HIV-1D median proviral load=0.10, IQR 0.01–0.76; p=0.577) (Fig. 1B). CD4 cell counts were significantly higher in HIV-1D-infected subjects (median=563, IQR 265–716) than HIV-1A-infected subjects (median=299, IQR 131–365) (Fig. 1C).

Comparison of hematopoietic and viral markers between individuals infected with HIV-1 subtypes A and D. Differences between viral load
HIV-1A-infected subjects had a median of 6.91 colonies per 105 PBMCs plated (IQR 4.85–31.41), HIV-1D-infected subjects had a median of 17.80 colonies per 105 PBMCs plated (IQR 8.54–33.05), and the density of colony-forming units did not significantly differ between populations (p=0.229) (Fig. 1D). When stratified by the type of colony, there was no significant difference in the density of the specific colony-forming units between populations (Fig. 1D). CD4 count (R=0.27, p=0.09) and viral load (R=−0.18, p=0.25) were not correlated with total colony count in this population (Fig. 2).
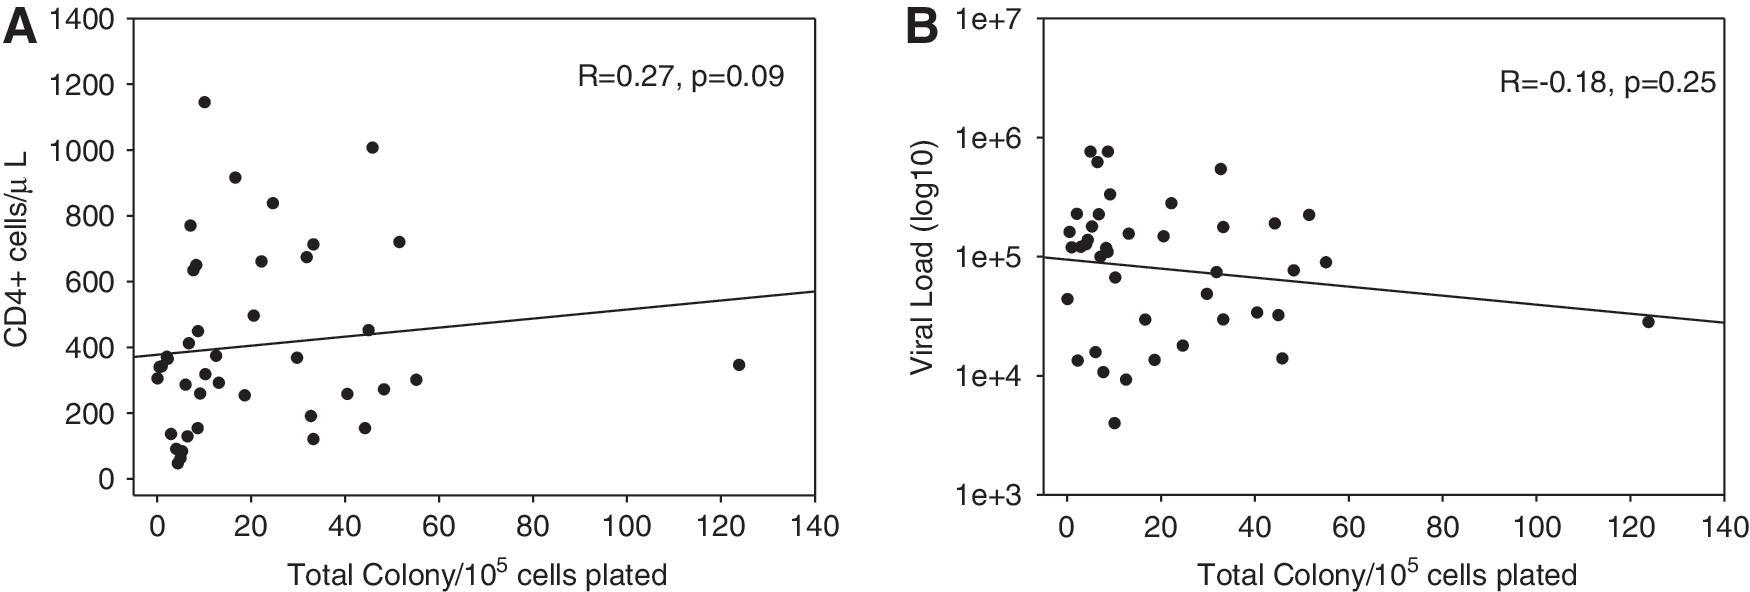
Colony-forming ability does not associate with CD4+ cell count (R=−0.18, p=0.25) (
Three of 462 colonies (0.65%) from HIV-1A-infected individuals (1/19 individuals) and one of 715 colonies (0.14%) from HIV-1D-infected individuals (1/22 individuals) were classified as stably infected (Tables 1 and 2). All four colonies that were classified as stably infected were identified as CFU-GM colonies. A total of 156 blank wells were successfully isolated as controls. The mean viral p24 count for all blank wells was 2.13 copies (95% CI=0.59–3.68) with a mean albumin count of 139 copies (95% CI=13.5–266). There was one blank well with a p24 copy count above 20 (WR-41), however, no colony isolates from this individual were identified as infected. The rate of infected CFU-GM colonies (p=0.15) and total colonies (p=0.19) did not differ between individuals infected with HIV-1A and HIV-1D.
Viral and Hematological Characteristics of Individuals Infected with HIV-1A
BE, burst-forming unit erythroid; GM, granulocyte, macrophage; GEMM, granulocyte, erythrocyte, macrophage, megakaryocyte.
Viral and Hematological Characteristics of Individuals Infected with HIV-1D
As the majority of HIV-infected people live in sub-Saharan Africa, it is imperative to better understand the viral characteristics of the prevalent subtypes in the region. Although previous work has demonstrated HIV-1 subtype C's ability to infect HPCs in vivo, it was unclear whether other subtypes prevalent in Africa share this phenotype.
As only four of the 1177 HPC colonies tested were found to be infected in vivo, it is most likely that colony-forming HPCs are not preferentially infected over mature HIV target cells by subtypes A and D. This frequency of HIV infection of HPCs is more closely related to the infection rates seen in HIV-1B than what has been observed in HIV-1C. 3,4 It should be noted that the proviral loads of the individuals used in this study are similar to the percentage of HPC colonies found to be infected. Although over 1100 colonies were tested it is possible that HPCs are infected at a rate below the level seen in PBMCs but at a high enough level to serve as a viral reservoir. Using the error rate calculated for the blank wells collected the limit of detection of our assay was 0.64%, which is similar or higher than the rate of infection seen in subtypes A or D and the PBMC proviral load from these subjects. This suggests that future studies should include a more sensitive assay to detect infection such as FACS analysis in addition to a functional colony-growth assay. Similar to our finding that only CFU-GM colonies are infected, infected colonies observed in HIV-1B infections were also often CFU-GM colonies, which occur later in the hematopoietic differentiation process. 4 It is also possible that colonies observed were formed by some other mature colony-forming cells. However, it is difficult to directly compare many of the studies that have examined HPCs due to differences in the assays and samples used to assess infection. 4,6,7,15,16
There is evidence that active HIV infection in HPCs may be cytotoxic to the progenitor cells early in the incubation period. 3 When induced to differentiate the HIV-1-infected HPCs are thought to be destroyed, making detection of the HIV-1-infected HPCs difficult. 3,7 Therefore, the low level of infection observed here may be a result of this cytotoxicity. However, a similar single-colony infection assay was successfully able to detect the presence of HIV-1C in vivo in both CFU-GEMM and BFU-E colonies, which represent cells present at earlier stages of hematopoiesis. 4 Additionally, in vivo infections may not have been detected since HIV-1 infection of an HPC has been hypothesized to promote differentiation and as a result may decrease the amount of time during which the cell can be identified in a colony-forming assay. 17 Previous work has demonstrated that HPCs can resist infection through cellular p21, which may be contributing to the low rates of infection seen here. 16,18
The difference in CD4 count observed between populations is likely a result of the selection criteria giving preference for CD4 counts less than 200 cells/mm3. The difference in disease progression rates between HIV-1D and HIV-1A-infected individuals results in the limited availability of HIV-1D samples with CD4 counts less than 200 cells/mm3. 19 The differences in CD4 counts between populations had no apparent affect on colony-forming ability. A negative correlation between circulating viral levels and density of colony forming ability, as well as an association between HPC infection and anemia, has been shown in HIV-1C-infected subjects. 2 This suggests that HIV-1 infection of HPCs can affect hematopoiesis and colony-forming ability. The observance of no correlation between circulating viral level and density of colony formation in our population further supports our conclusion that HIV-1A and HIV-1D do not preferentially infect HPCs over mature HIV target cells in vivo. However, the limited number of infected colonies observed here indicates that more research is needed to examine the role of subtype-specific infection of HPCs.
Footnotes
Acknowledgments
The authors would like to thank all the study participants and study staff. All subjects provided written informed consent for their samples to be stored and used for future HIV-related research. The study was approved by the Science and Ethics Committee of the Uganda Virus Research Institute, the NIH Office of Human Subjects Research, and the Division of Human Subjects Protection U.S. Army Walter Reed Institute of Research. There are no conflicting interests for any of the study authors. The funders had no role in the study design, data collection and analysis, decision to publish, or preparation of the manuscript. This study was supported in part by funding from the Division of Intramural Research, NIAID, NIH and U.S. Military HIV Research Program.
Author Disclosure Statement
No competing financial interests exist.