




Abstract
Regressive morphological lesions, found in peripheral lymphocytes from HIV+ patients, clearly conflict with normal cycle progression and with the execution of basic housekeeping and immune functions. With these lesions, circulating lymphocytes are destined to spontaneous and energy-independent cell lysis. By means of confocal microscopy and morphometry, we have quantified the rate of circulating T cells that are probably destined to emocatheresis in vivo. This rate includes lymphocytes in which nucleolin fragments have been scattered out of the nuclear region as a result of prelethal alterations in the nuclear membrane permeability. In terms of bioenergetics, these cells show evident anomalies in the energy production machinery that make them unable to carry out ATP-requiring functions. The extent of damaged cell fraction in peripheral blood reflects the frequency with which T lymphocytes leave lymphoid tissue to be cleared in hemocatheretic processes.
Introduction
Historically, molecular components and immune functions of T cell pool have been studied in the most accessible tissue compartment, peripheral blood, in order to understand how T cell death in HIV infection originates, as well as to follow disease progression, establish when to initiate antiretroviral therapy, and, ultimately, how to use these notions in clinical pathology.
However, mostly in terms of morphological features, circulating lymphocytes decidedly deviate from the norm. 1 –4 Major pathological modifications concern nucleus, with nucleolus and nucleolar organizer region (NOR) remodelling, 2,3 chromatolysis and nuclear evanescence, 1 plasma membrane, with formation of blebs and loss of surface proteins, 1 organelles, with mitochondrial swelling, and cytoplasm with extensive vacuolization. 1
This pathological picture, particularly nuclear evanescence, is difficult to reconcile with correct cell cycle progression and normal execution of basic immune functions. It is plausible to suppose, instead, that damaged T cells leave lymphoid tissues only to be eliminated in hemocatheretic processes. 1
The data presented here confirm this idea and explain why peripheral T cells, whose in vivo morphology includes important nuclear anomalies, undergo swelling, lysis in culture, and energy-producing and consuming metabolic processes, typical of the necrotic cell death.
Our results lay the foundation for the development of minimally invasive tests for peripheral T cell damage detection and quantification that may exploit the marked distinction between healthy individuals and infected patients in terms of nuclear morphology and intracellular content and compartmentalization of nuclear proteins.
Materials and Methods
Study population, T cell isolation, and cell cultures
After informed consent, HIV-infected patients were recruited at the Infectious Diseases Department of the University of Messina. The cohort of infected patients includes a total number of 21 individuals under study (14 males and 7 females; mean age 43 years). Eighteen of these patients were chronically infected and three presented evidence of acute or recent HIV infection as defined by (1) negative HIV antibody and enzyme immunoassay, with detectable HIV RNA levels, (2) history compatible with recent HIV infection, and (3) laboratory confirmation of recent antibody seroconversion. In this cohort, 15 were aviremic (viral load <25 copies/ml) while six viremic patients showed a viral load ranging from 550 to 1.2×10⁶ copies/ml. At the time of blood collection and in the subsequent experimental testing, CD4+ T cell density ranged from 87 cells/ml to 0.5×10³ cells/ml. Immunological phenotyping was performed by a FACScalibur flow cytometer (Becton Dickinson, San Jose CA); viral load was measured by Nuclisens HIV-1 QT Nucleic Acid Sequence Based Amplification (NASBA) (Biomerieux bv, Boxtel, NL) according to the manufacturer's instructions. All patients underwent antiretroviral therapy.
The control group was composed of 11 uninfected blood donors (five males and six females; mean age 35 years). In healthy controls, the average CD4+ T cell density was 0.95×10³ cells/ml.
Peripheral T lymphocytes, prepared from venous blood by density gradient centrifugation (Ficoll gradient) were cultured in complete RPMI-1640 (Sigma, St. Louis, MO) supplemented with 10% fetal calf serum (FCS) at an initial density of 106 cells/ml. Concanavalin A (Con A) was added at a final concentration of 5 mg/ml. T cells, freshly isolated (ex vivo), and at several times after seeding in culture, were analyzed by western blot (WB), confocal laser microscopy (CLM), and flow cytometry as detailed below.
Cell extract preparation, western blot, ELISA, and proteasome assay
Nuclear and cytosolic extracts
To obtain the cytosolic extracts, after nucleus removal as described, 1 –3 the cells were lysed for 10 min on ice with 20 mM HEPES (pH 7.9), 0.2 mM EDTA, 1.5 mM MgCl2, and 10 mM KCl, containing 0.5% NP40, 10 μg/ml leupeptin, 10 μg/ml pepstatin, 1 mM sodium fluoride, and 1 mM sodium orthovanadate. Nuclear proteins were extracted from cell homogenate after 20 min incubation on ice using 20 mM HEPES (pH 7.9), 25% glycerol, 0.2 mM EDTA, 1.5 mM MgCl2, 0.42 M NaCl, 10 μg/ml leupeptin, 10 μg/ml pepstatin, 1 mM sodium fluoride, and 1 mM sodium orthovanadate. The cytosolic and nuclear proteins were denatured in SDS-sample buffer and 30 μg was fractionated on SDS-PAGE, and then were electrically transferred to a nitrocellulose membrane. Equal protein loading was confirmed by the level of beta-actin protein present in the membrane tested with anti beta-actin antibody 1:500 (Sigma CA).
Western blot analysis
PDK Abs were purchased from MitoSciences, USA. Blots were incubated overnight at 4°C, followed by incubation with horseradish peroxidase-conjugated secondary antibody. Blots were treated with enhanced chemiluminescence reagents, and proteins were detected and quantified by ChemiDoc System (Bio-Rad, Hercules, CA). After cell homogenization, proteins were separated by 8.5% SDS-PAGE and transferred to nitrocellulose membranes. Blots were blocked overnight at 4°C with 5% nonfat dry milk; then membranes were probed with mouse anti-PDK1 monoclonal antibody (diluted 1:500 in TBS-T) or mouse anti-beta-actin (diluted 1:10,000 in TBS-T) followed by incubation with horseradish peroxidase-conjugated antimouse secondary antibodies (respectively diluted 1:1500 and 1:30,000 in TBS-T) (Sigma-Aldrich). The PDK1 expression was visualized by chemiluminescence with an ECL kit on Kodak film. Blots were scanned and quantified by densitometric analysis with the AlphaImager 1200 System (Alpha Innotech, San Leandro, CA).
ELISA (protein ubiquitination)
The measures of total protein polyubiquitination were carried out by ELISA (Poly-ubiquitinated protein ELISA Kit, Abnova Taipei City, Taiwan) in T lymphocytes, according to the manufacturer's instructions.
Proteasome assay
Proteasome activity in T lymphocytes was evaluated using the CHEMICON Proteasome Activity Assay Kit (CHEMICON Intrnational, Inc.), according to the manufacturer's instructions.
Amino acid transport, protein synthesis, and degradation and protein content per cell
The activity of amino acid transport system A and ASC was measured in lymphocyte cultures as [ 3 H]proline uptake by previously described methods 5,6 ; values are expressed as picomoles per minute per 103 viable cells in these experiments; cell viability was evaluated by PI and trypan blue dyes exclusion.
General protein synthesis was measured, several times after mitogen addition, in initial velocity by [ 3 H]leucine incorporation (2 μCi/ml RPMI, 10% FCS) in TCA-precipitable fractions of cultured peripheral blood mononuclear cells (PBMCs). Briefly, aliquots of 0.5–1×10⁶ cells were washed three times in complete RPMI and then incubated for 30 min in fresh medium (106 cells/ml) supplemented with labeled leucine. At the end of incubation, pellets were obtained by centrifugation at 800×g for 10 min, washed three times with cold PBS, and treated with 5% TCA (20 min). Leucine incorporation into cell proteins was calculated by measuring the radioactivity associated with the TCA-precipitable fraction after centrifugation of TCA-treated cells at 12,000×g for 10 min. Values were expressed as nanomoles of leucine incorporated by 106 cells in 30 min.
Degradation and half-life of newly synthesized proteins was determined as follows: after mitogenic activation, the cells were labeled with [ 3 H]leucine as described above (see general protein synthesis); labeled cells were washed three times and incubated at 106 cells/ml in fresh medium supplemented with Con A in the absence of labeled leucine. Aliquots of 106 cells were collected every 10 h for 4 days and the radioactivity still linked to the TCA-precipitable fraction was determined. In these experiments, cell viability was assessed every 24 h by PI trypan blue dyes exclusion and flow cytometry. Radioactivity values were plotted against time in unlabeled medium. A linear regression best defined the trend of radioactivity decrease associated with the TCA-precipitable fraction. On the basis of parameters that define this equation, the half-life for newly synthesized proteins was established for each HIV-positive and control person under study.
Protein content per cell was measured as follows in aliquots of 1×10⁶ cells, carefully washed three times and centrifuged at 800×g for 10 min; cell pellets were then dissolved in 0.5 N NaOH for 30 min at 37°C in a volume of 1 ml. Protein concentration in aliquots of this solution was measured by spectrophotometric methods (Bradford protein assay).
Immunofluorescence staining and confocal laser microscopy
Peripheral blood mononuclear cells were fixed on polylysined slides using 3.7% paraformaldehyde and incubated for 15 min at room temperature. To detect nucleolin (C23), cells were treated with Triton X-100 (Sigma-Aldrich) and washed with phosphate-buffered saline.
After two washes, monoclonal antinucleolin antibody FITC conjugated, 1/100 (Santa Cruz Biotechnology, Inc., Santa Cruz, CA) and/or propidium iodide (PI, 5 μg/ml, Sigma-Aldrich) were added, in a dark, humidified chamber (30 min; 37°C). Cells were observed and images were acquired with a Zeiss LSM 510 laser scanning microscope (Argon laser 458-488 nm; HeNe laser 543 nm and 633 nm; Plan-Neofluar lens). Images were processed by LSM510 Image Examiner-Zeiss software. All images were digitalized at a resolution of 8 bits into an array of 2048×2048 pixels. Optical sections of fluorescence were obtained at 1 min, 12-sec scanning speed using a pinhole of 329.
Flow cytometric analysis
Multicolor flow cytometric analysis was performed according to standard procedures using a panel of monoclonal antibodies. Flow cytometric acquisition of samples was performed on at least 100,000 events on a FACScalibur flow cytometer. Multicolor flow cytometric analysis was performed according to standard procedures using a panel of fluorescent probes.
Analysis of the acquired data was performed using FloMax software. To determine the mitochondrial mass, the cells were incubated with 10-nonyl bromide acridine orange (NAO) (Invitrogen Molecular Probes) and mitochondrial membrane potential was evaluated as incorporation of the fluorescent probe rhodamine 123 (Rh123) (Invitrogen Molecular Probes).
NAO was spontaneously incorporated by mitochondria with a high specificity due to the affinity to cardiolipin; therefore, the emission signal was proportional to the mitochondrial content. The chemical properties of the cationic fluorochrome Rh123 allowed the mitochondrial membrane crossing and storage in the matrix only in functional mitochondria that possess a transmembrane potential (Δψ m) indicative of an active proton gradient. 7 The probes NAO and R123 were added to cells suspensions (final concentration 0.2 μM), incubated for 10 min at 37°C, and the fluorescent signals were collected in the green and red channel, respectively.
Statistical analysis
The analyses performed included the two-tailed Student's t test or Mann–Whitney U test for comparisons between groups, while correlations involving different sets of data within the same group were determined using either the standard Pearson correlation coefficient or the Spearman's rank correlation test. Significance was assessed at the p<0.01 and p<0.05 levels. All analyses were performed using Prism 4.0 software.
Results
The nature and variety of nucleolin functions (i.e., formation of chromatin structure, rDNA transcription, rRNA maturation, ribosome assembly, and nucleocytoplasmic transport) make nucleolin a versatile marker of cell proliferation and death. 8 –12 To study intracellular nucleolin concentration and compartmentalization, we have examined purified peripheral T lymphocytes from healthy individuals and HIV-infected patients by high-resolution confocal microscopy and morphometry (Fig. 1). Staining with an nucleolin-specific antibody revealed a uniform overexpression in the majority of peripheral T cells from patients (Fig. 1A). Besides being overexpressed, nucleolin is scattered throughout the cytoplasm region, as demonstrated by merging nucleolin-linked fluorescence with transmitted light (Fig. 1B) and confirmed by plotting values of nucleolin-linked fluorescence against cell thickness (Fig. 1C). In infected patients, morphometric analysis also documents a distinct prevalence of cytotypes showing extranuclear nucleolin diffusion (Fig. 1D).
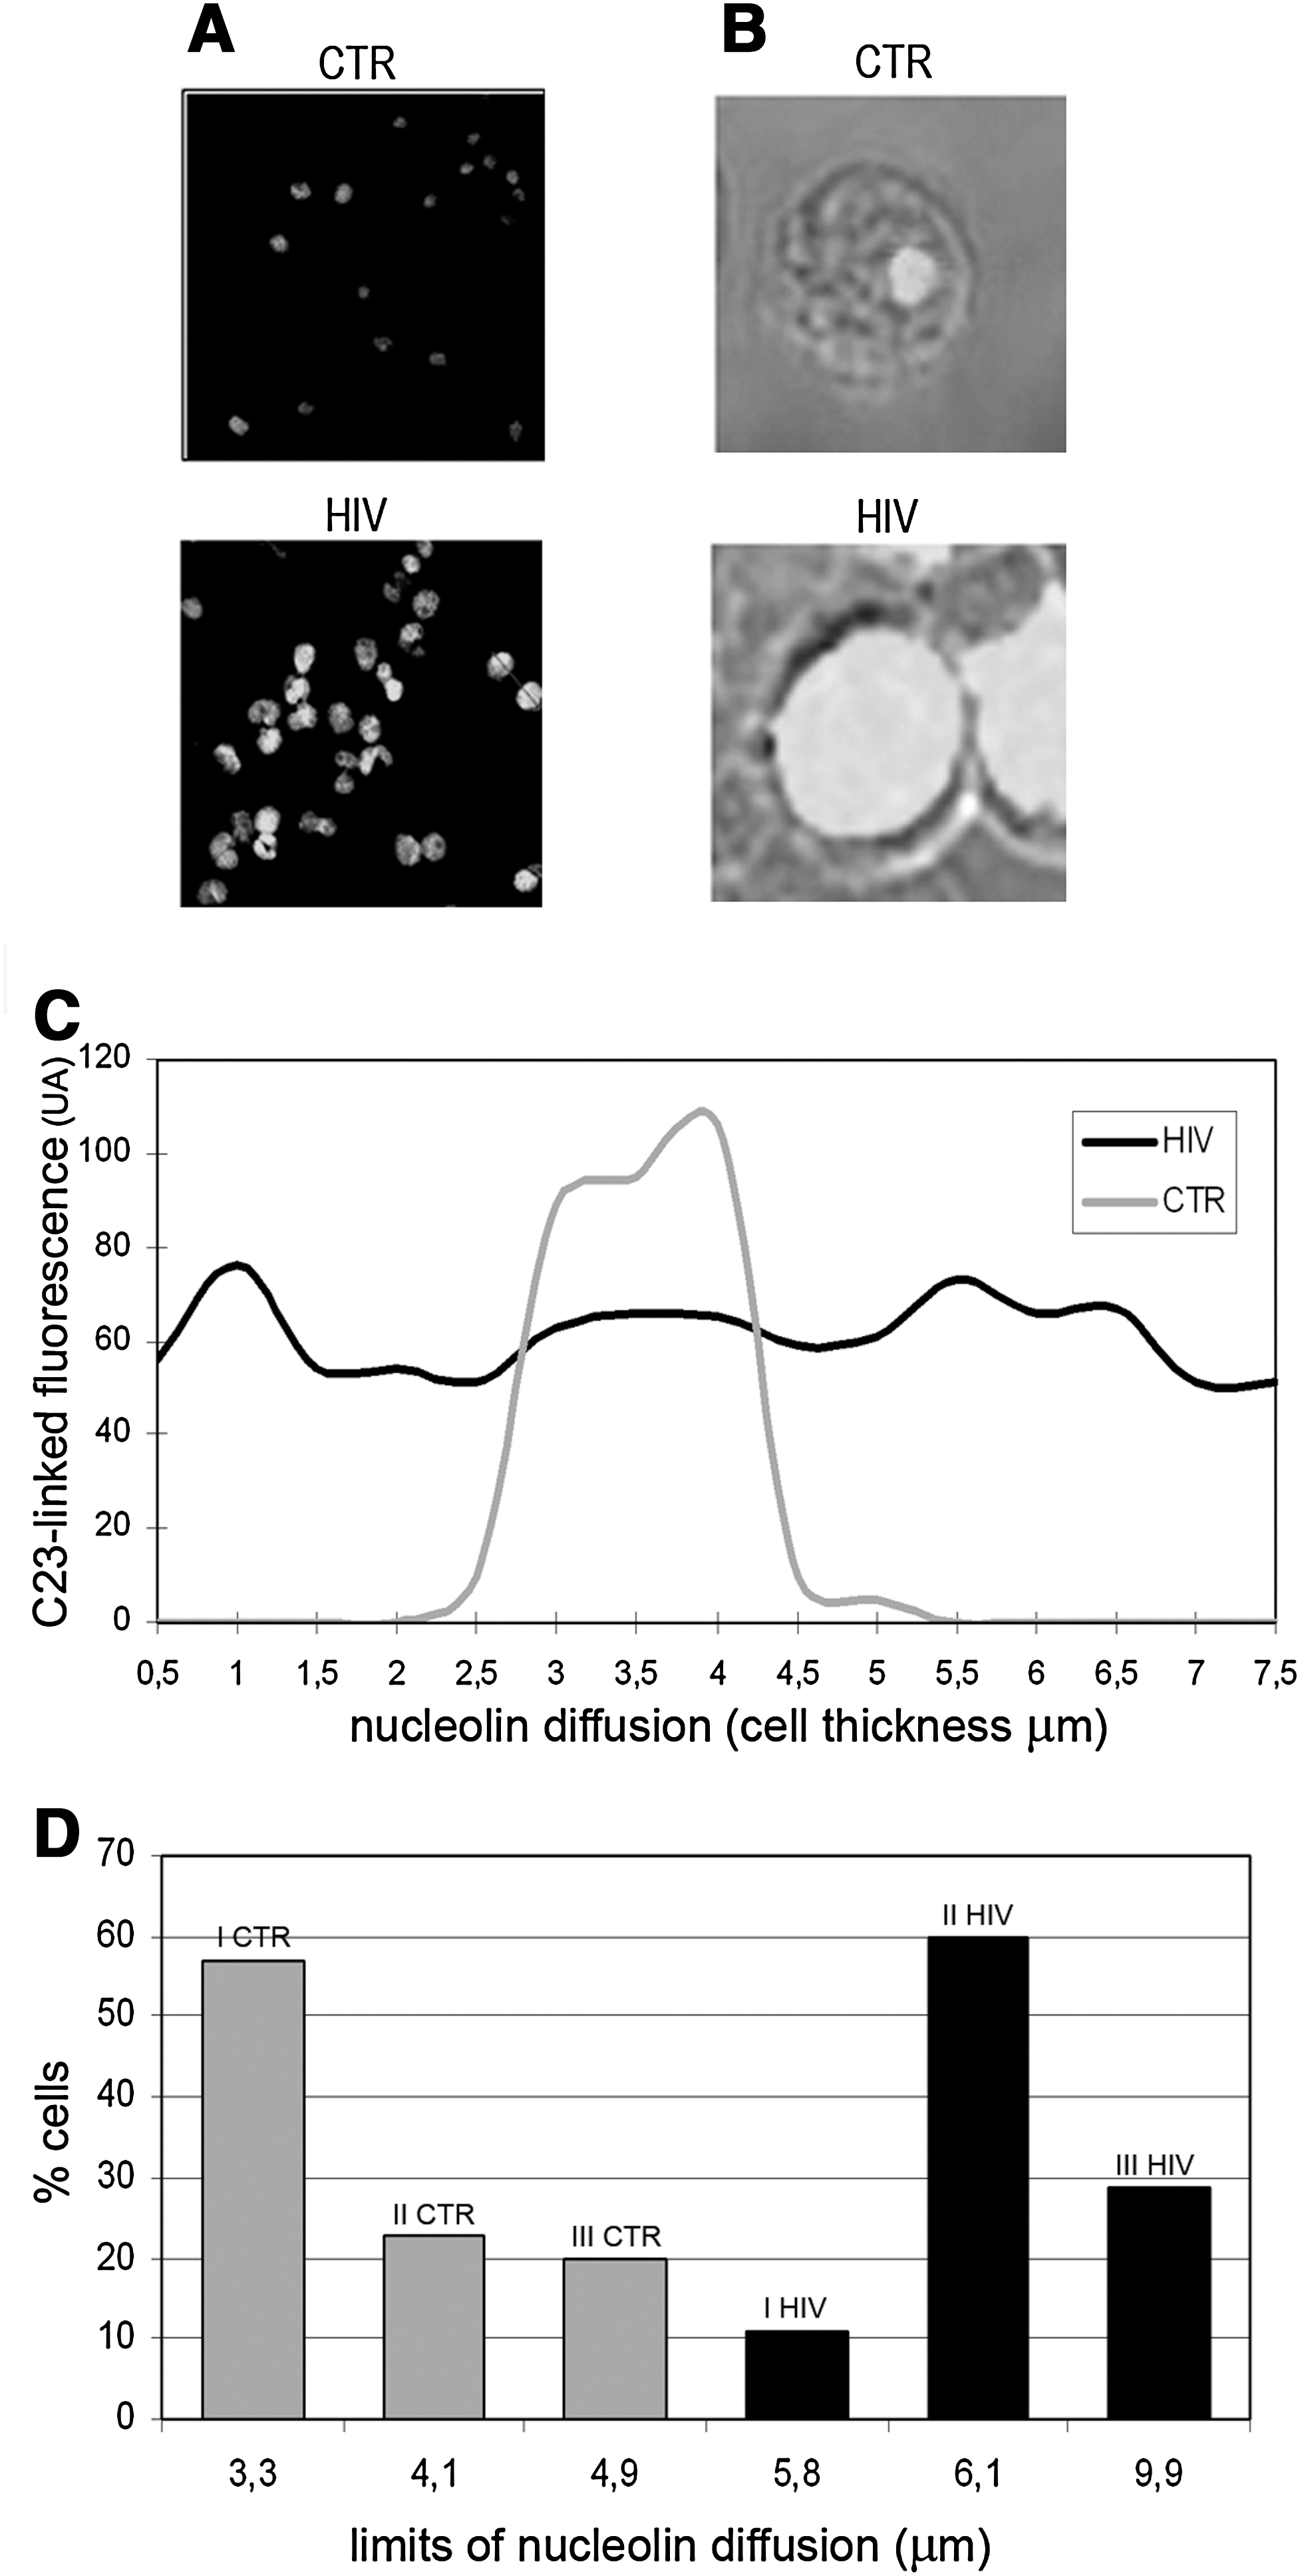
Cell nucleolin content and subcellular localization in freshly isolated T lymphocytes.
Morphometric values as reported in Table 1 show a marked distinction between patients and healthy individuals, in terms of nucleolin intracellular accumulation and compartmentalization. With comparable values of T cell diameter and nuclear size, T cell nucleolin content ranges from 30 to 100 and from 70 to 250 nucleolin-linked fluorescence units in healthy individuals and patients, respectively. In T cell populations from healthy individuals, the structure of a normal T cell cytotype implies strictly rigid nucleolin compartmentalization in the central portion of the nucleus, namely in the nuclear region included between 3 and 4.5 μm of scanning thickness. In patients, instead, nucleolin is scattered over a wide cellular region (i.e., nucleus and cytoplasm) included between 2.5 and 9.9 μm of scanning thickness.
Intracellular Nucleolin Content, Limits of Nucleolin Diffusion, and Nuclear and Cellular Diameter Have Been Measured 1
Flow cytometric profiles obtained from ex vivo analysis show that few peripheral T cells are positive to PI, thus indicating that pathological changes in membrane permeability are very limited, both in patients and control cells (Fig. 2A), despite the high percentage of T cells showing nuclear damage in patients (Fig. 2B). These percentages keep increasing and, after mitogenic activation, when only 30% of T cells are positive to PI, rise above 80% (Fig. 3A). Specificity of nuclear disarrangement is further evidenced by high nucleolin instability. As shown in Fig. 3B, in patients nucleolin is almost completely degraded during T cell activation. As a result, intracellular concentration of both full length and fragmented forms is higher than controls in resting cells but drops dramatically after activation. Taken altogether, these data suggest that T lymphocytes from HIV-infected patients are prone to cell lysis and nuclear breakdown.
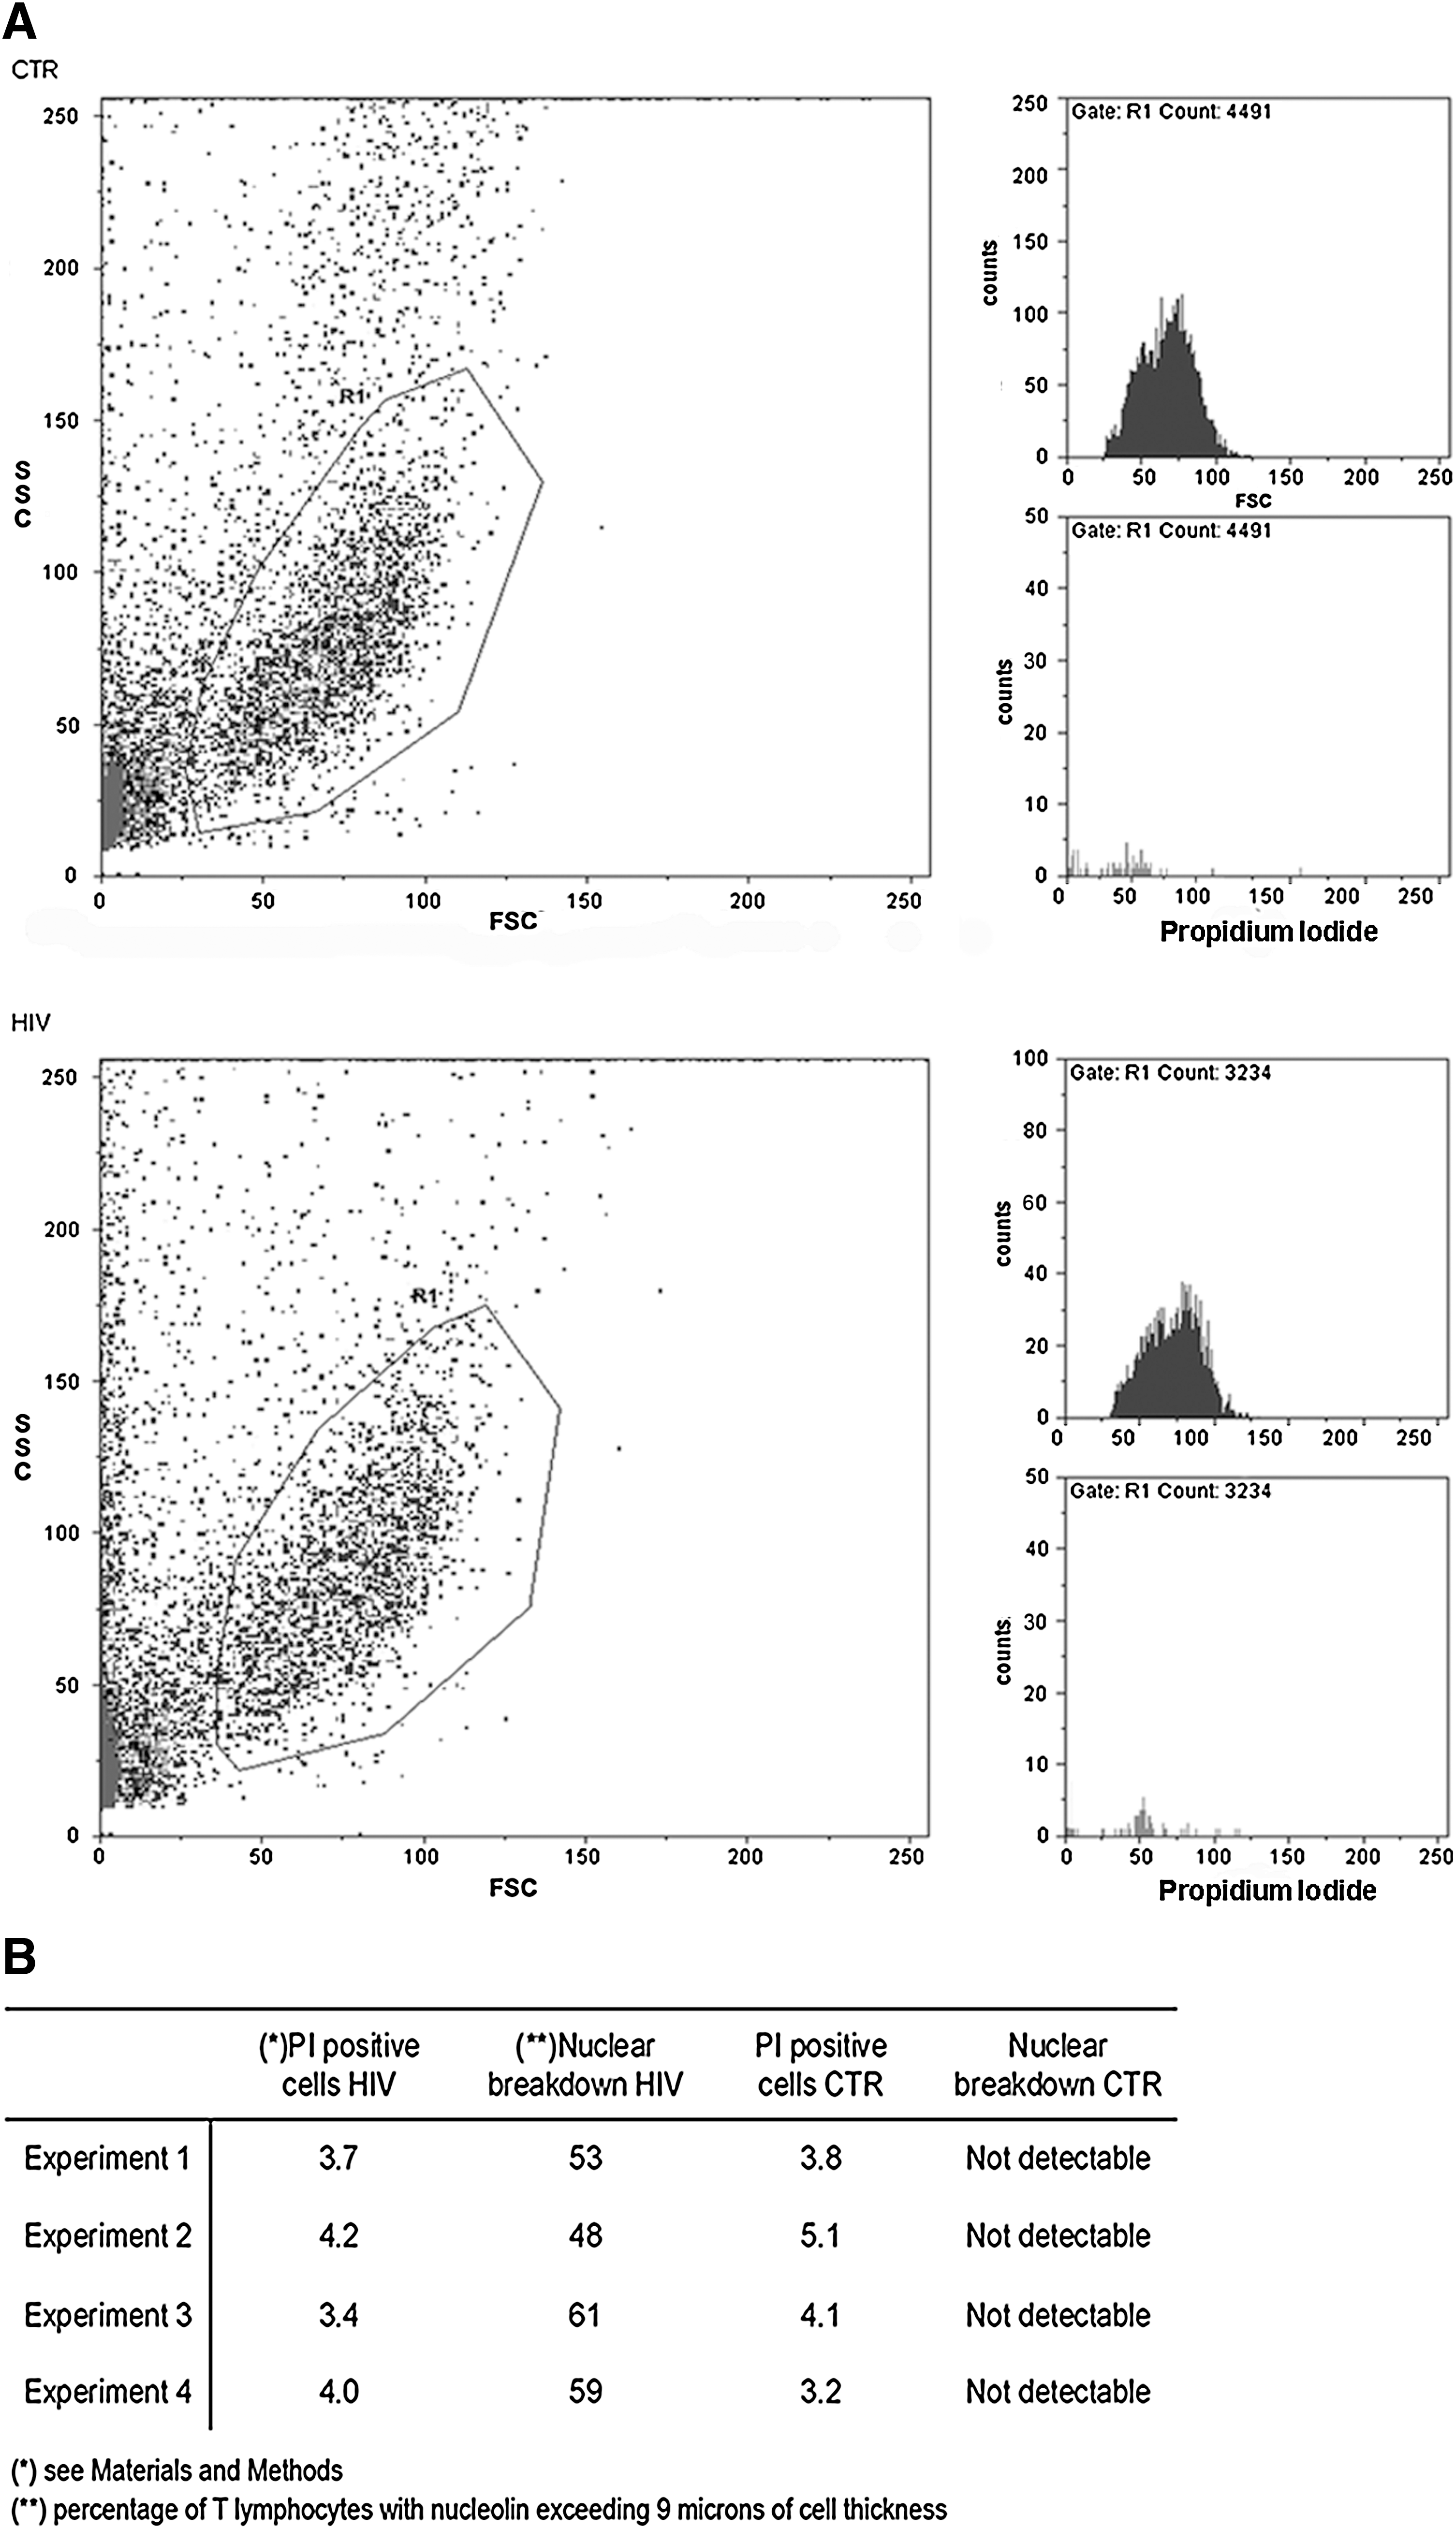
Membrane damage evaluated by propidium iodide (PI) exclusion in freshly isolated T lymphocytes.
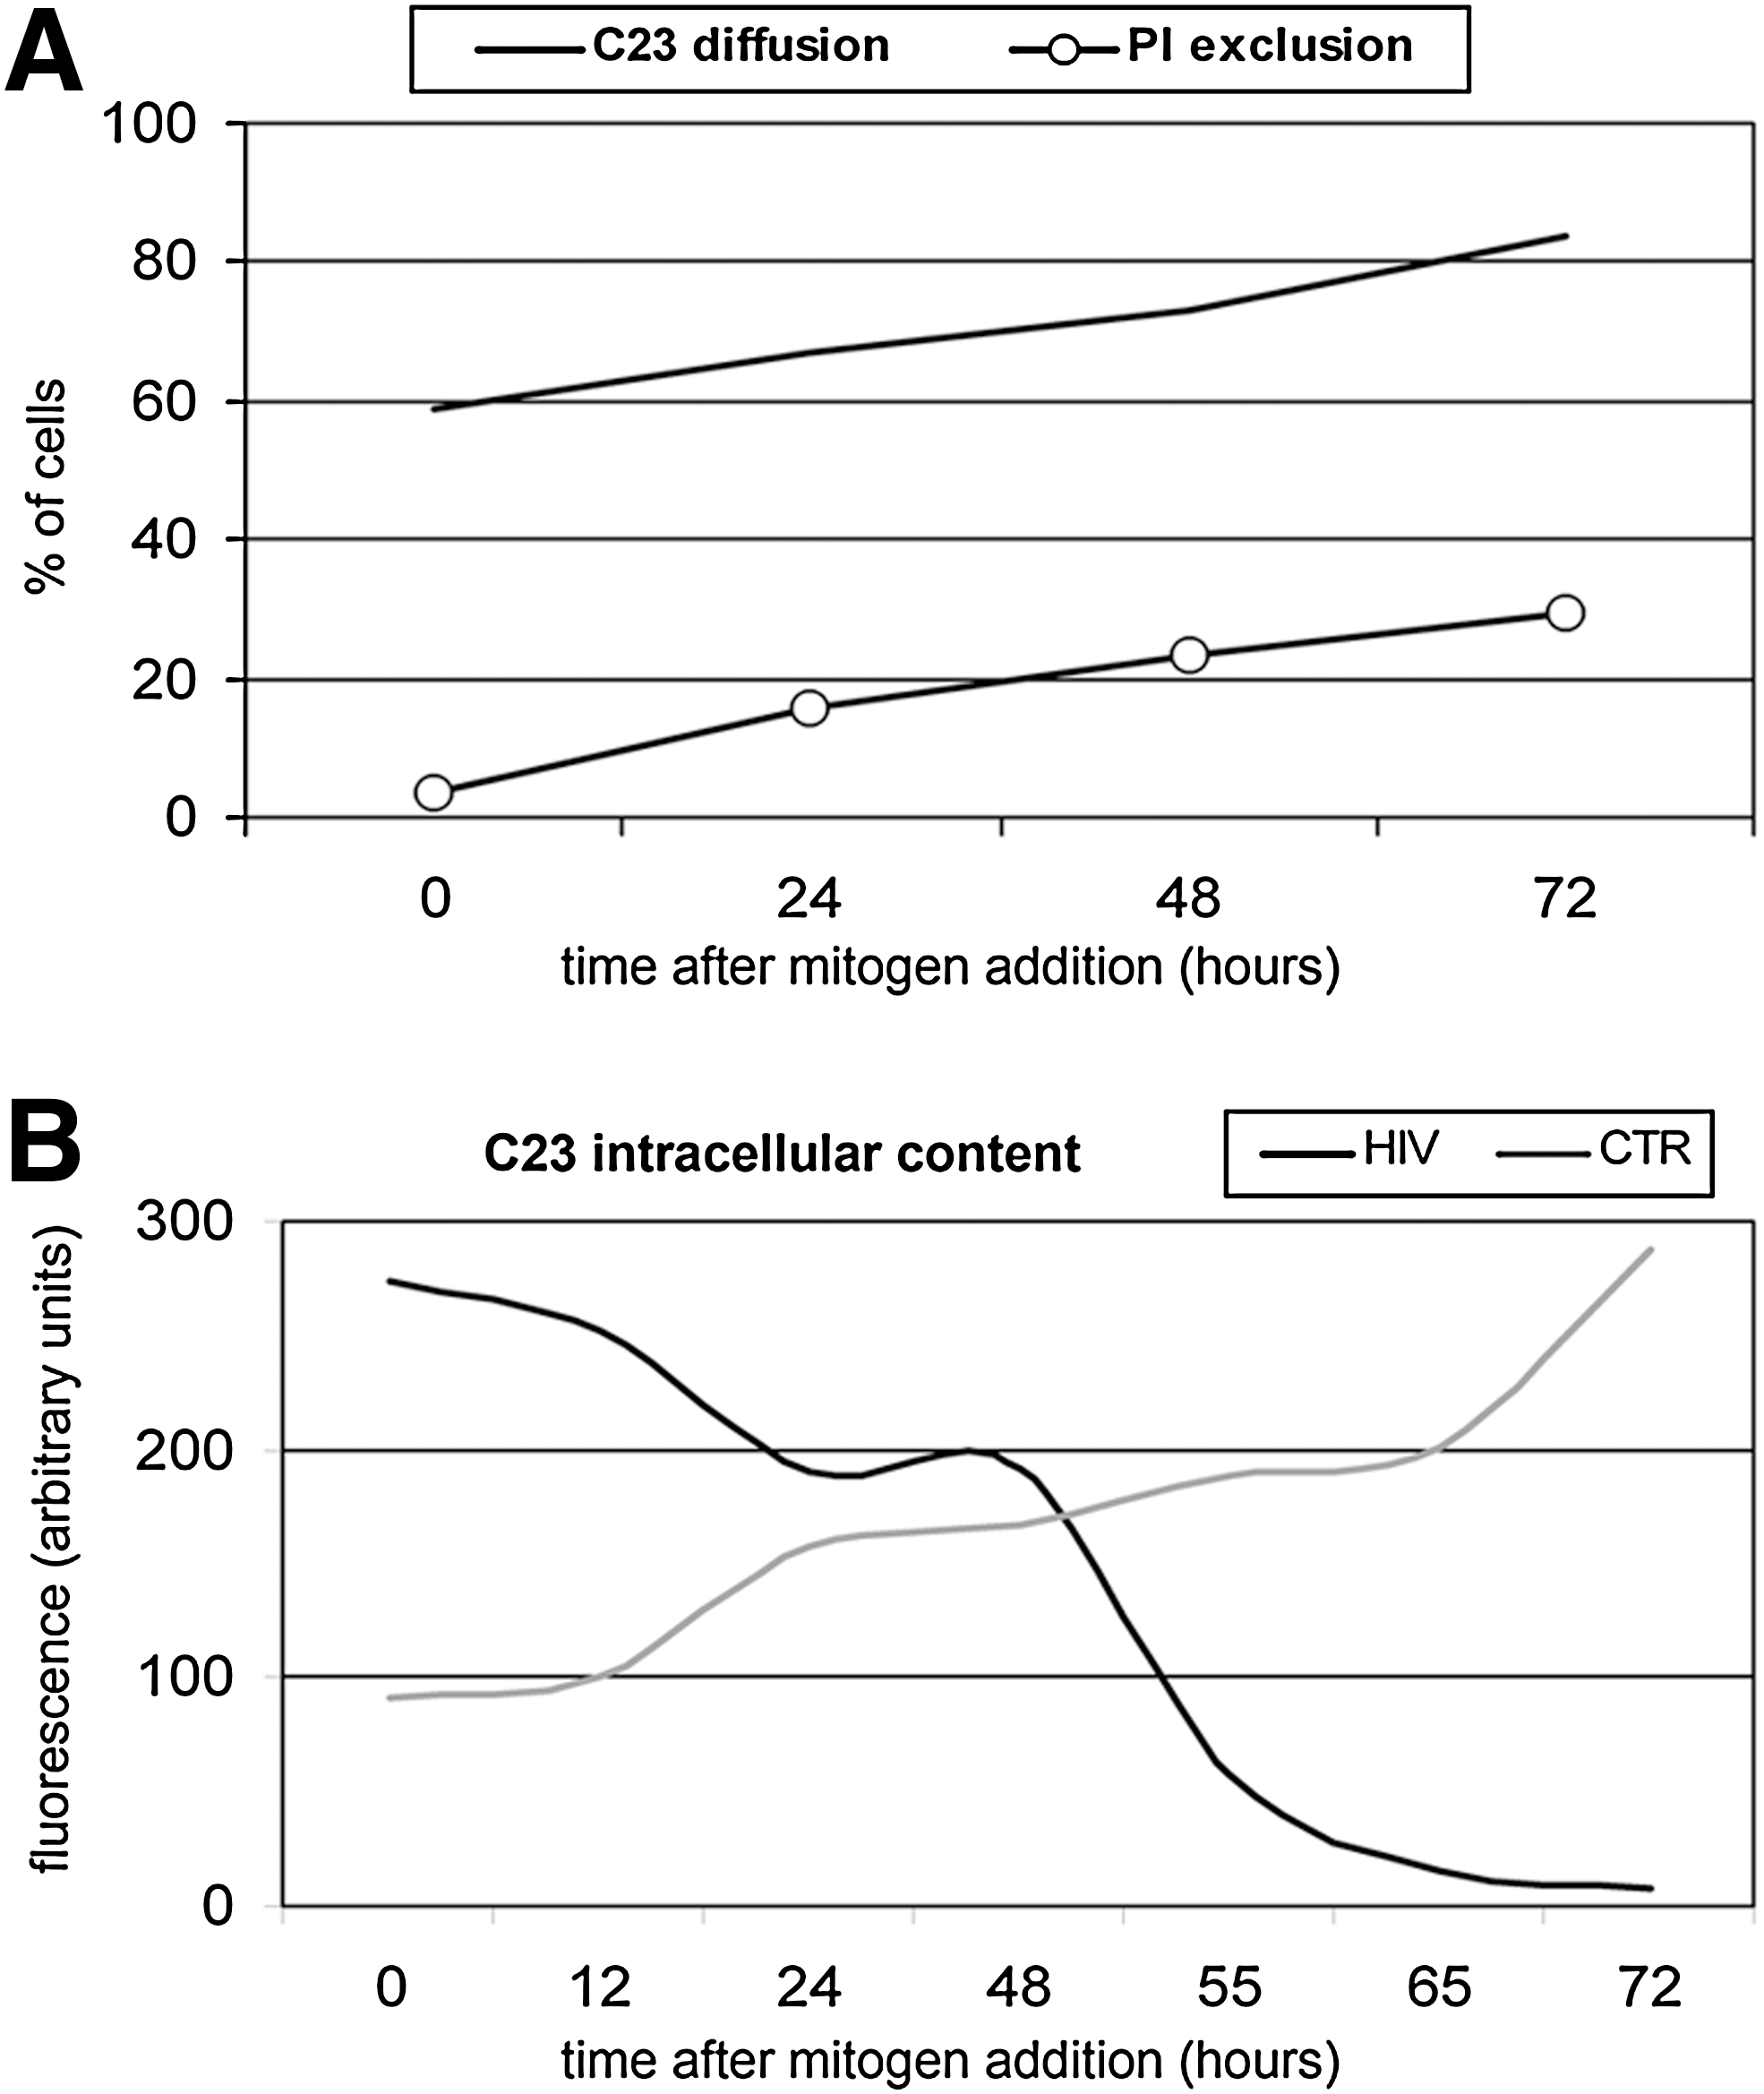
Nucleolin diffusion, propidium iodide exclusion, and nucleolin depletion in cultured T lymphocytes.
Within this complex morphological picture, studying the metabolic profile of cultured cells is crucial to distinguish apoptotic and necrotic modifications. Using acridine orange derivative, 10-N-nonyl acridine orange (NAO), in conjunction with rhodamine 123 (Rh123), allows estimation of both mitochondrial membrane content and metabolic state. 13 –15 NAO binds to the mitochondrial inner membrane by interaction with the phospholipid cardiolipin, while fluorescent lipophilic compound Rh123 specifically binds to functionally active mitochondria. NAO and Rh123 fluorescence intensity values in resting and activated T cells are summarized in Fig. 4A and B. Distribution profiles of NAO/Rh123-linked fluorescence intensity are similar (Fig. 4A), or almost superimposable (Fig. 4B), in resting cells from both patients and controls. However, the differences are dramatic in activated cells, in which case 92% of T lymphocytes from healthy controls emit high fluorescence intensity values, while T lymphocytes from patients show limited shifting from initial NAO- and Rh123-linked fluorescence values, even after prolonged stimulation (Fig. 4A and B). That mitochondrial membrane potential varies as a mere function of the mitochondrial mass is suggested by the low expression of pyruvate dehydrogenase kinase (PDK) (Fig. 4C) and other enzymes of the Krebs cycle, such as succinic dehydrogenase and malate dehydrogenase (data not shown), all specific markers of mitochondrial matrix and inner membranes.
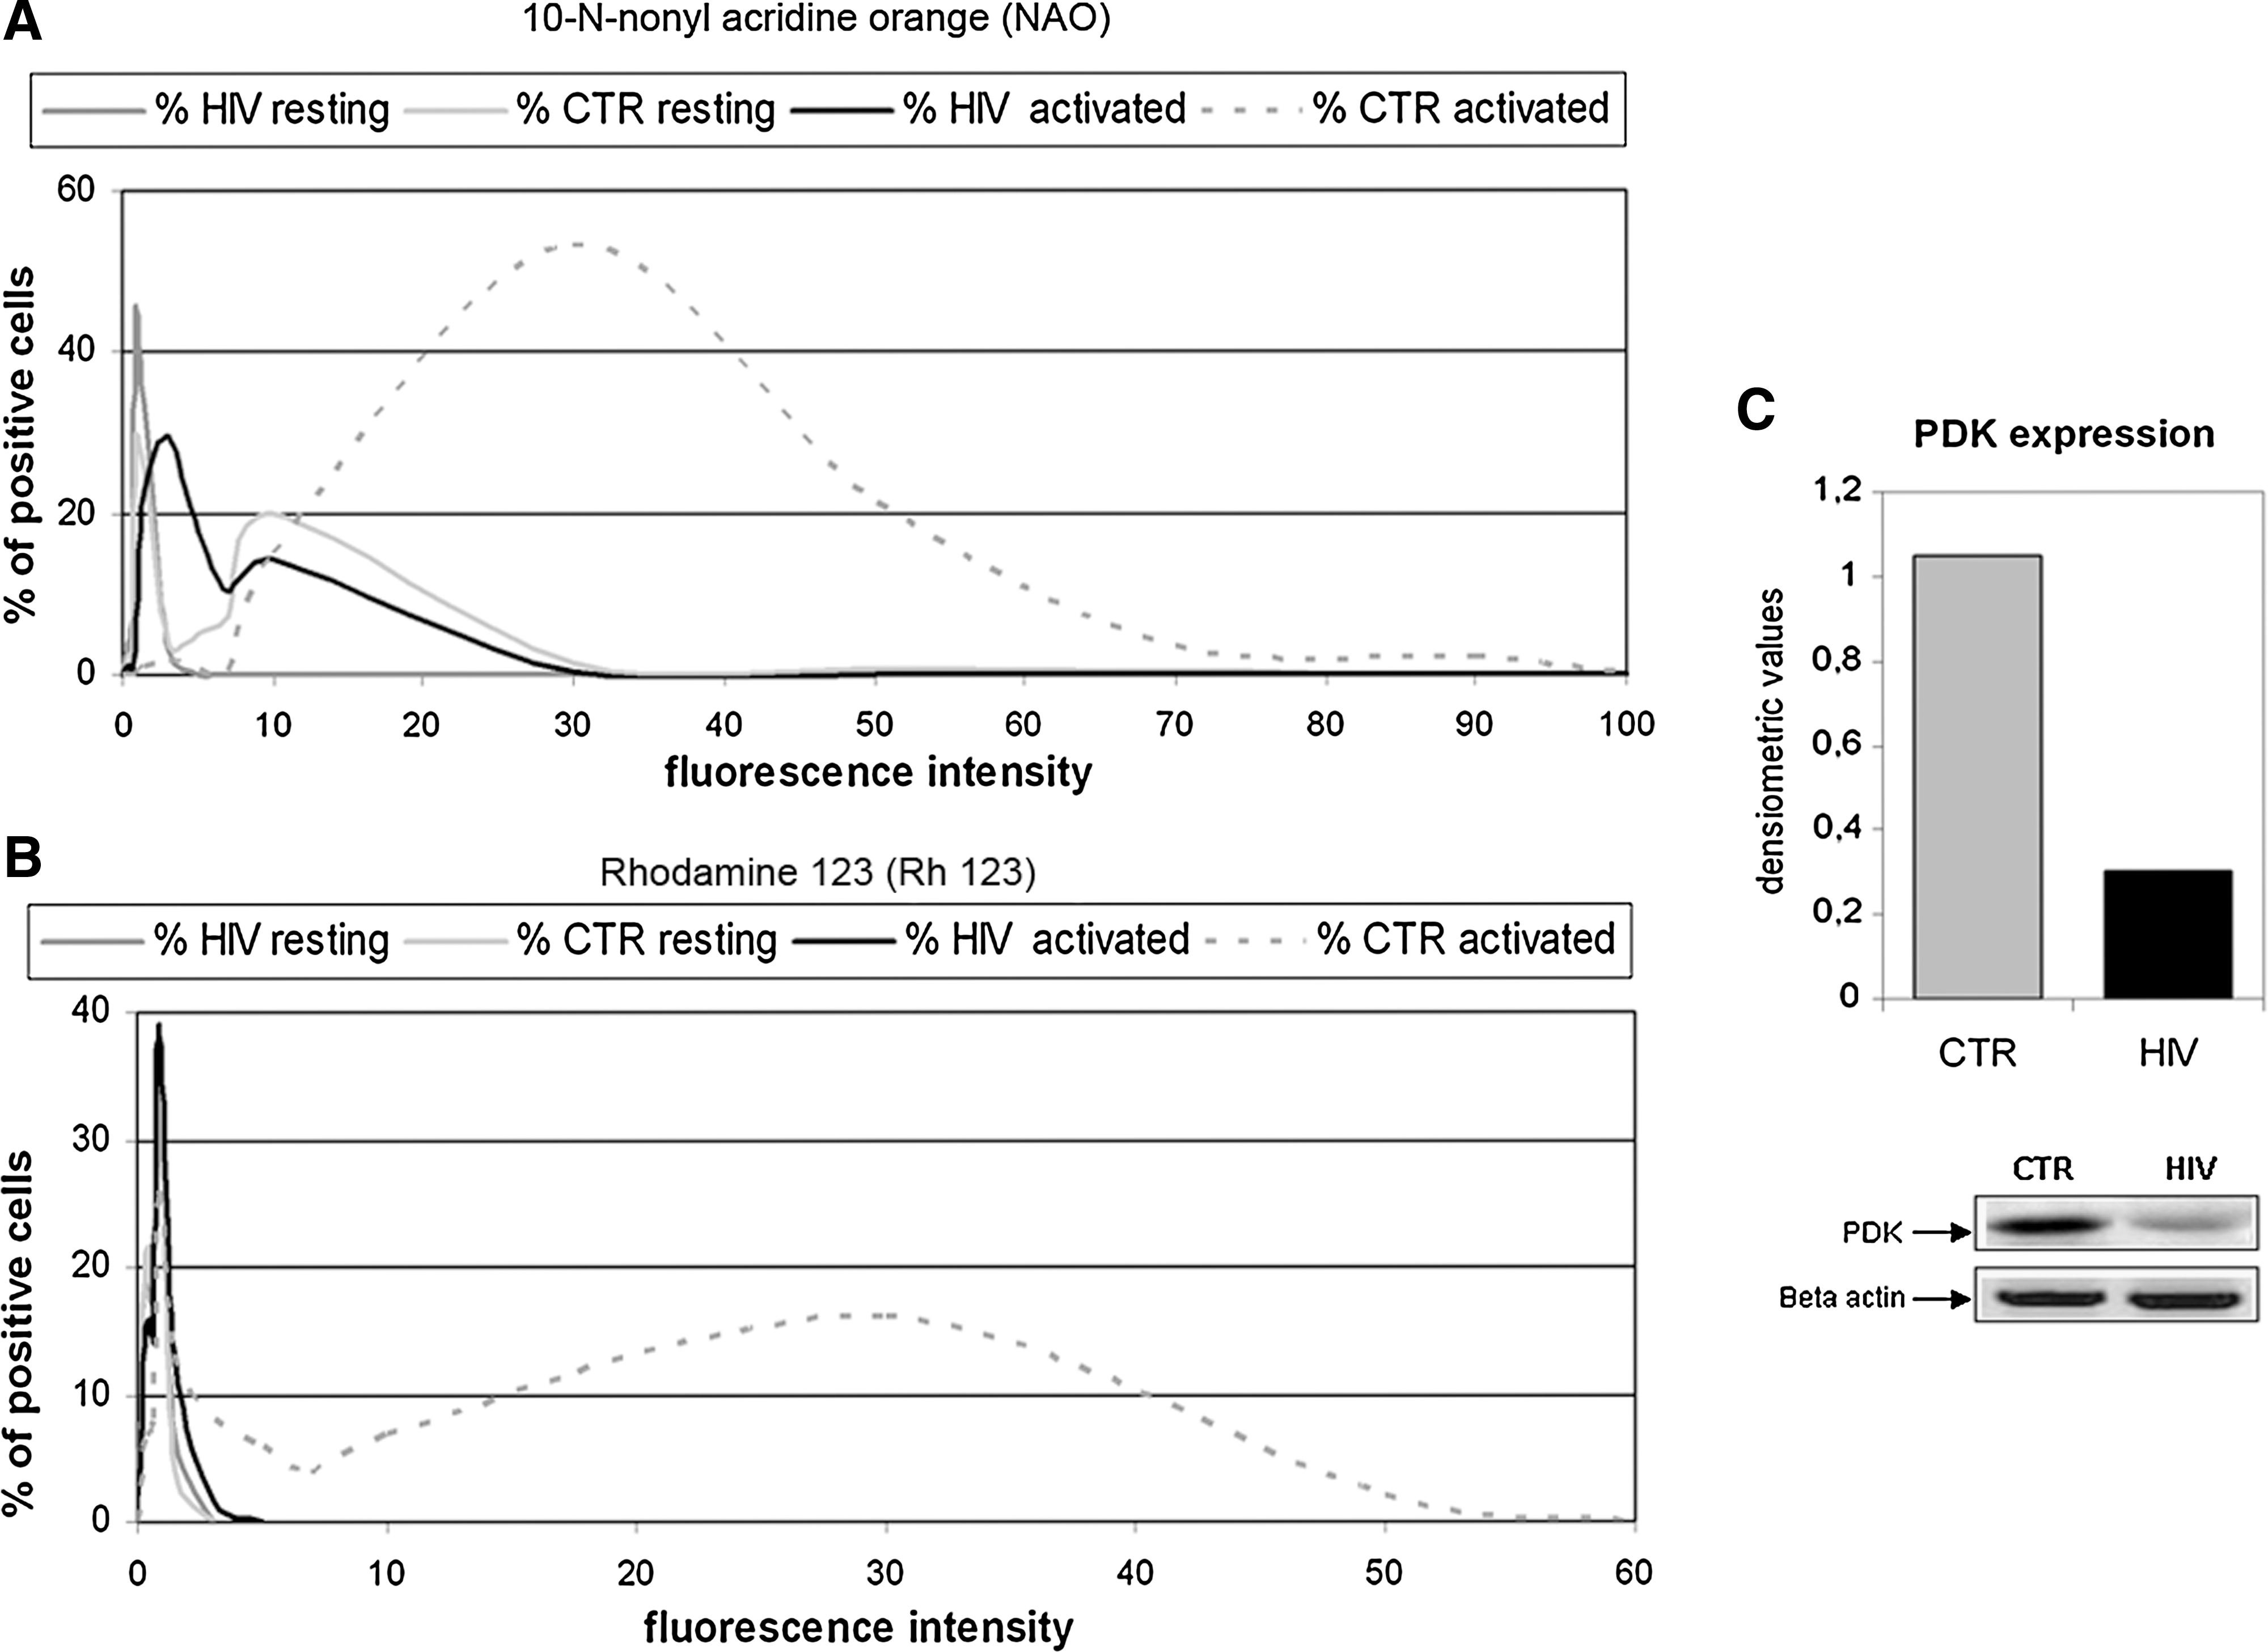
Mitochondrial mass and function and mitochondrial pyruvate dehydrogenase kinase (PDK) expression. Distribution profiles of N-nonyl acridine orange (NAO)
The inability of T lymphocytes from patients to adjust mitochondrial mass in response to mitogens causes metabolic energy as a result of poor ATP supply. There are hierarchical criteria in remodulating ATP-consuming processes in conditions of ATP deprivation 16 –20 and the structure of this hierarchy depends on functional specialization and tolerance to cell anoxia. 18,19 Our study was, therefore, extended to membrane transport of small metabolites, protein synthesis, protein degradation, and protein ubiquitination, all strictly ATP-dependent cellular functions. To evaluate ATP consumption by membrane transport systems during T cell activation, we measured initial velocity of the Na+/ATP-dependent amino acid transport system A activity.
As shown in Fig. 5A, in normal T cells mitogens induce early membrane activation and sustained activity of transport system A. In cells from patients, instead, after a slight transitory increase, amino acid uptake by system A dramatically drops. We then measured cell membrane damage and amino acid transport system A activity in parallel, plotting values of proline uptake and positivity to PI against the time spent in culture. Figure 5B and C shows that the drop in activity of energy-dependent transport system A precedes the appearance of clear alterations of membrane permeability.

Modulation of amino acid transport system A in resting and proliferating T lymphocytes. The activity of amino acid transport system A has been evaluated as proline uptake as described in Materials and Methods. Cell viability has been measured by propidium iodide exclusion. Values of proline uptake reported in
In lymphocytes, the effects of ATP deprivation on macromolecular synthesis and degradation vary with cell proliferative activity, 19,20 but activity of cell machinery for macromolecular synthesis is preserved even in critical conditions of ATP supply. 16 Under our experimental conditions, in cells from patients, the incorporation of free amino acids into protein is dramatically lower than that found in healthy controls even after prolonged stimulation (Fig. 6A). In parallel, the stability of new synthesized protein strongly decreases (Fig. 6B); the decrease in synthesis and increase in degradation are consistent with progressive loss in protein mass (Fig. 6C). Importantly, proteolysis increase occurs in the setting of the extinction of such ATP-dependent processes of protein degradation as proteasome catalytic activity (Fig. 6D) and protein ubiquitination (Fig. 6E). This means that the observed increase in proteolytic activity is part of the necrotic pattern of cell death. 21 –23
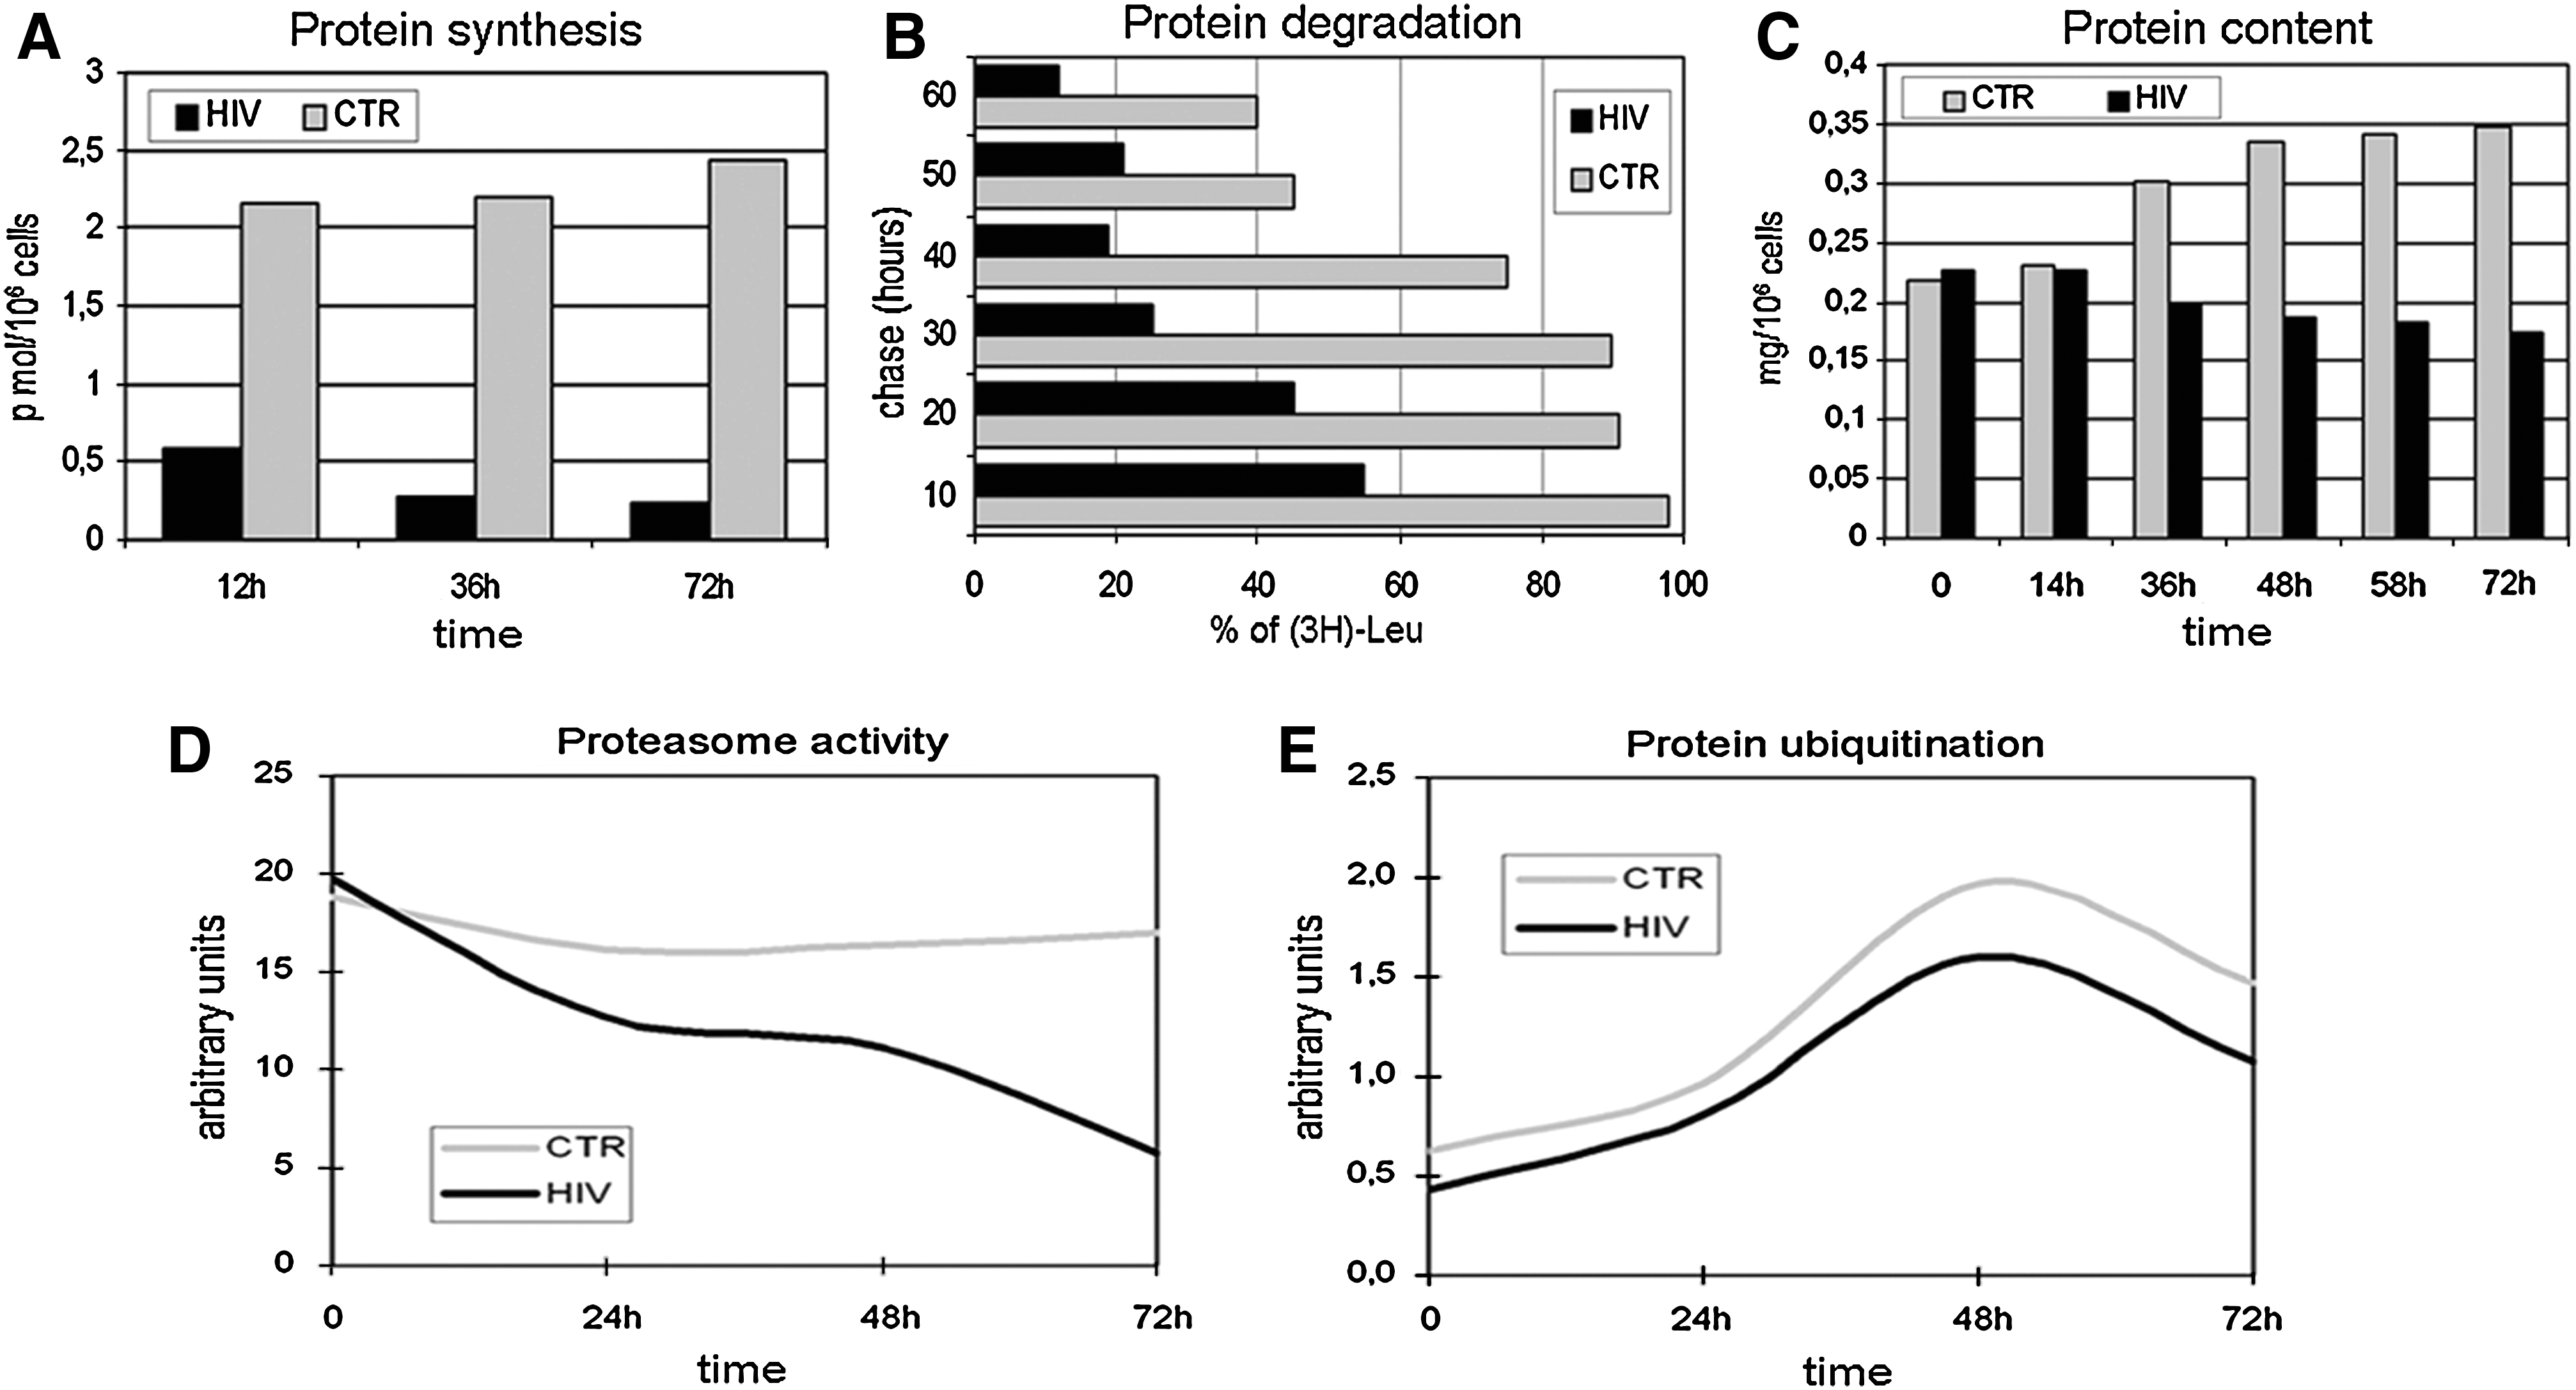
Protein synthesis and degradation. Protein synthesis
Discussion
The behavior of normal T cells after mitogen addition summarizes well-established notions 8,12,24 –31 and is illustrative of how cell population is synchronously committed to enter and progress in cycle, with increase in cellular, nuclear and mitochondrial size, 24 –27 nucleolin content, 8,12 membrane uptake, 28,29 activity of cell machinery for protein synthesis, and proteasomal degradation. 30,31 What, on the other hand, was found in T cells from patients is a substantial unresponsiveness to mitogenic stimulation with extinction of ATP-requiring metabolic processes, followed by a series of energy-independent changes in cell morphology, all of which are regressive events generally associated with necrotic death. This type of bioenergetics, albeit not necessarily in contrast with the idea that apoptosis is a prominent modality of T cell death in HIV disease, 32 is inconsistent with metabolic patterns of executive phases of apoptosis. Thus expressions such as “activation-induced apoptotic death,” which usually define the death of T cells in culture, should actually be avoided.
Mammalian cells fuel their growth through uptake and catabolism of small metabolites such as glucose, 33 whose utilization for ATP production, together with the synthesis of ribonucleotides, is essential for the execution of energy-requiring phases of cell proliferation and apoptotic death. 34,35 When committed in G1/S phases of the cell cycle, circulating T cells from patients infected with HIV are unable to accumulate nucleotides via de novo nucleotide synthesis, thus lacking the main source of precursors necessary for RNA, DNA, and membrane lipid synthesis. 34,35 That this metabolic defect is the main cause of T cell death by necrosis was observed 12 years ago in a cohort of chronically infected individuals 34 but so far little attention has been focused on these conceptual bases of bioenergetics, and no attempt has been made to apply these biochemical criteria to the clinical pathology of HIV disease. As a result, the diagnostic approaches to the immune profile of infected patients is limited to conventional methods of immune phenotyping by flow cytometry.
The fact remains that in patients a small portion of damaged T cells, disseminated in peripheral blood only to be destined to hemocatheresis, is counted together with the viable cells, and this makes the flow cytometric approach to the reconstitution of immune function after antiretroviral therapy questionable. The presence of circulating cells, which in significant amounts and in all stages of infection show sublethal nuclear lesions, 1 inability to produce ATP, drop in ATP-dependent membrane uptake, and even alterations of basic mechanisms of homeostatic control such as the balance between protein synthesis and degradation, is very hard to reconcile not only with processes of immune reconstitution, but even with housekeeping functions.
Therefore, data of T cell bioenergetics suggest systematically integrating conventional flow cytometry with rigorous methods for quantification of hemocatheretic T cell fraction, defined as the rate of circulating T lymphocyte population (both CD4+ and CD8+) composed of damaged and/or aged cells. The extent of this fraction probably reflects not only the extent of T cell death but also the function of hemocatheretic organs.
Many biochemical anomalies of T cells are only terminal events of the cell life cycle and cannot be easily exploited as specific markers of hemocatheresis. Changes in expression, prevalence of full length or fragmented form, and intracellular accumulation and compartmentalization of nucleolin are instead highly specific; thus, nucleolin overexpression, along with the related enlargement of the AgNOR area, is typical of the G1/S phases of the cell cycle 10,12 while cells in G0 reduce the nucleolin synthesis and size of the AgNOR area 8,12 ; during necrotic processes nucleolin is initially fragmented and then disappears 2,11,12 ; finally, nucleolin overaccumulation signals that cells have experienced several rounds of mitotic cycles, namely that they are aged. 9,12
Beside the versatility of nucleolin as an indicator of mitotic activity, proliferative history, and cell death, there are other reasons to try measuring nucleolin expression as a new diagnostic method in HIV infection. For example, pathological nucleolin overexpression is a negative prognostic factor for immune reconstitution after antiretroviral therapy 4 and is strictly associated with pathogenicity of a lentiviral infection and level of immune activation. 36 Furthermore, the physiopathology of this protein reveals a strict association between nucleolin accumulation and scattering and suggests being the accumulation, fragmentation, loss of compartment-specific retention, and degradation of nucleolin sequential events of a unique process of nuclear break-down.
Transferring these data to the clinical pathology of HIV infection requires (1) optimization of flow cytometric measures of nucleolin cell content, (2) studies of quantitative electron microscopy after nucleolin-immunogold labeling, and (3) application of suitable algorithms for comparative analysis of morphometric data on nucleolin diffusion and flow cytometric values of nucleolin accumulation. With rigorous standardization of this methodological approach, nucleolin overaccumulation can be quantified and considered as a biochemical equivalent of morphological nuclear damage.
Footnotes
Author Disclosure Statement
No competing financial interests exist.