
Abstract
Regulatory T cell (Treg) is a subset of CD4+ T cells that play a critical role in regulating the immune responses. Human immunodeficiency virus (HIV) infection is associated with T cell abnormalities and alters effector T cell function. There are a large number of patients coinfected with HIV and hepatitis C virus (HCV). Here, we evaluated the proportion of CD4+ Treg cells expressing CD25 and FOXP3, and the status of immune activation of CD8+ T cells in 60 Chinese patients chronically infected with HIV and/or HCV. Furthermore, we investigated the influence of highly active antiretroviral therapy (HAART) on the level of Treg cells and immune activated CD8+ T cells. We observed that the Treg level was upregulated in HIV infection and HCV infection could not enhance this kind of upregulation significantly. The level of Treg cells was negatively correlated with CD4+ T cell counts and positively correlated with HIV viral loads. We observed considerably elevated CD38 and HLA-DR expression in CD8+ T cells in HIV-infected subjects but not in HCV-infected patients in comparison to that in healthy controls. There is no significant difference concerning the proportion of CD8+ T cells expressing CD38 or HLA-DR between HIV-1-monoinfected and HIV/HCV-coinfected patients. After 12-week HAART, the proportion of Treg cells dropped, but still more than the level in healthy controls. HAART could reverse the abnormal immune activation of CD8+ T cells. The decrease of Tregs did not alter the downregulation of HIV-1-specific CTL responses in these HIV-infected patients after HAART therapy. The level of HIV virus might be the key point for the decline of CTL responses.
Introduction
Human immunodeficiency virus (HIV) and hepatitis C virus (HCV) are presently the leading chronic viral infections worldwide. Approximately 4 to 5 million people are living with chronic HIV/HCV coinfection. 1 However, studies of the effect of HCV on HIV disease progression have been conflicting. 2 –6 A recent meta-analysis of over 30 studies with over 100,000 patients found no increase in mortality in coinfected patients in the pre-highly active antiretroviral therapy (HAART) course. 7 Post-HAART, coinfection increased the risk of overall mortality but not of AIDS-defining conditions. 7 However, most studies suggested the need for earlier and more aggressive HIV and HCV treatment in coinfected individuals. 8,9
Regulatory T cell (Treg) is a subset of CD4+ T cells responsible for controlling the responses of other T cells, and protection from self-reactivity by suppressing the proliferation of effector T cells. 10,11 This cell subset represents 5–10% of peripheral CD4+ T lymphocytes in humans. 12,13 It has been demonstrated that Tregs are able to suppress lymphoproliferative responses against HIV proteins or peptides in the blood and lymphoid tissues of HIV-infected patients. 14 –16 Whether these cells are harmful by suppressing HIV-specific immune responses or beneficial through a decrease in immune activation remains debatable. Conflicting data have been reported regarding the relationship between Treg activity, immune activation, and HIV/SIV disease progression. The level of Tregs has been found to be unaffected, expanded, or decreased with disease progression. 14,17 –19 The relationship of circulating Tregs to plasma HIV RNA levels and the impact of HAART on the level of Tregs have not been well understood. Recent studies have shown that Treg cell activity is increased in patients with chronic HCV infection compared to those who clear infection 12,20,21 ; these studies have also shown that Tregs contribute to the dysfunction of HCV-specific CD8+ T cells by suppressing their proliferation and IFN-γ production, suggesting that Tregs contribute to HCV persistence. 20,22 –24 However, there is limited information available on Treg cells in HIV/HCV coinfection, 25,26 and the results from these studies are conflicting.
Herein, we compared levels of Tregs, using CD4, CD25, and FOXP3 as its specific markers, in patients infected with HIV and HCV, and patients coinfected with HIV/HCV in China. Furthermore, the immune activation of CD8+ T cells was analyzed in these patients. In addition, we evaluated the effect of HAART on the level of Treg cells.
Materials and Methods
Subjects studied
Study subjects were recruited from the Department of Infectious Disease of Tangdu Hospital (Xi'an, China) and the 8th hospital (Guangzhou, China). The study population included HIV-monoinfected (n=20), HCV-monoinfected (n=20), and HIV/HCV-coinfected (n=20) patients, as well as healthy controls (n=20). All the patients in both the monoinfected and coinfected groups were antiretroviral therapy naive at baseline and with typical progressive disease, peripheral CD4 T cell counts below 500 cells/μl, and levels of plasma HIV RNA exceeding 1000 copies/ml. All the patients involved had normal liver function with no evidence of hepatocirrhosis.
After baseline evaluation, HIV patients whose CD4 T cell counts were equal to or less than 350 cells/μl would receive antiretroviral therapy. HAART was defined as treatment with three antiretroviral drugs, including nucleoside reverse transcriptase inhibitor, nonnucleoside reverse transcriptase inhibitor, and/or protease inhibitor. Patients were excluded if they used hydroxyurea, interleukin (IL)-2, interferon (IFN)-α, or a combination of tenofovir and didanosine, because these are known to affect the CD4 T cell count. All HIV/HCV-coinfected patients with CD4 T cell counts <350 cells/μl began receiving HAART. If the CD4 T cell counts were between 200 and 350 cells/μl, the patients would receive anti-HCV therapy (IFN-α-2a combined with ribavirin) after 12 weeks of HAART therapy. If the CD4 T cell counts were less than 200 cells/μl, the patients would receive HAART first until their CD4 T cell counts increased to more than 200 cells/μl. After that, they would receive anti-HCV therapy 12 weeks later. In this analysis, we followed patients only until they finished their 24 weeks of HAART. There were five HIV/HCV-coinfected patients excluded at 24 weeks of HAART because of the initiation of anti-HCV therapy. Healthy controls were HIV and HCV seronegative. All samples were from patients who signed informed consent forms in accordance with the guidelines for the conduction for clinical research by the Fourth Military Medical University Institutional Review Board.
Measurement of plasma HIV RNA and HCV RNA level and CD4 T cell counts
Plasma HIV-RNA and HCV-RNA were measured using a real-time polymerase chain reaction assay (COBAS TaqMan 48; Roche, Barcelona, Spain); they have a lower limit of detection of 47 copies/ml and 15 IU/ml, respectively. CD4 T cell counts were measured in EDTA-treated whole blood by flow cytometry.
Flow cytometry analysis
Peripheral blood was used for flow cytometry. For evaluating the proportion of Treg cells, cells were stained with anti-CD3-Percp (Isotype Control: PerCP Mouse IgG1, κ), anti-CD4-FITC (Isotype Control: FITC Mouse IgG1, κ), and anti-CD25-APC (Isotype Control: APC Mouse IgG1, κ) (BD PharMingen, San Diego, CA) first. Cells were then stained with anti-FOXP3-PE (Isotype Control: PE Mouse IgG1, κ) (eBiosciences, San Diego, CA), according to eBiosciences's instructions. When the immune activation of CD8+ T cell was investigated, cells were stained with anti-CD3-Percp, anti-CD8-APC, and anti-CD38-PE (Isotype Control: PE Mouse IgG1, κ) or anti-HLA-DR-PE (Isotype Control: PE Mouse IgG2a, κ) (BD PharMingen, San Diego, CA). Marker expression was analyzed using a FACSCalibur and CellQuest software (BD PharMingen). A minimum of 100,000 cells/tube was analyzed.
ELISpot Assays
Fresh peripheral blood mononuclear cells (PBMCs) were separated from whole blood by Ficoll-Hypaque (Sigma) density gradient centrifugation and plated in 96-well polyvinylidene difluoride-backed plates (MAIP S45; Millipore, Bedford, MA) that had been previously coated with 100 μl of anti-gamma-interferon (IFN-γ) MAb 1-D1k (0.5 μg/ml; Mabtech, Stockholm, Sweden) overnight at 4°C. Peptides were added directly to the wells at a final concentration of 10 μM. Cells were added to the wells at 100,000 cells per well in a final volume of 130 μl of R10. Wells containing PBMCs and R10 medium were used as negative controls and were run in triplicate on each plate. Wells containing PBMCs and phytohemagglutinin (PHA) served as positive controls.
The plates were incubated at 37°C with 5% CO2 overnight (14 to 16 h), then were washed six times with phosphate-buffered saline (PBS) before 100 μl of biotinylated anti-IFN-γ MAb 7-B6-1 (1 μg/ml; Mabtech) was added, and incubated at room temperature for 90 min. After being washed again with PBS, 100 μl of 1:20,000-diluted streptavidin-alkaline phosphatase conjugate (Mabtech) was added to all wells of the plates. The plates were incubated at room temperature for 45 min. Wells were again washed with PBS, and individual IFN-γ-producing cells were detected as dark spots after a 20- to 30-min color reaction with 5-bromo-4-chloro-3-indolylphosphate and nitroblue tetrazolium using an alkaline phosphatase-conjugated substrate (Bio-Rad Laboratories, Hercules, CA). Spots were counted by direct visualization and are expressed as spot-forming cells (SFC) per 106 PBMCs or per 106 input cells. The number of specific IFN-γ-secreting T cells was calculated by subtracting the negative control value from the established SFC count. Results of 50 or greater SFC/106 input cells were considered positive. Negative controls were always <40 SFC/106 input cells. The overall CD8 T cell specificity of the IFN-γ ELISpot-based responses to synthetic peptides was demonstrated previously by others in a series of CD8 and CD4 depletion and enrichment experiments.
Statistical analysis
Statistical analysis and graphic presentation were performed using SPSS 13.0 and GraphPad Prism 4. Results are given as means or medians with ranges. Statistical analysis was based on the Student`s t test, Wilcoxon rank sum test, and Spearman rank correlation coefficient. All tests were two-tailed, and p values of <0.05 indicated statistical significance.
Results
Patient characteristics
A total of 60 patients were enrolled in this analysis. More than half (63.3%) of the patients were man (Table 1). The median age at baseline was 35 years [interquartile range (IQR), 24–45 years], and there was no significant difference in the age among different groups (p>0.05). The median CD4 T cell count of HIV-infected patients (including monoinfection and coinfection) at baseline was 141 cells/mm3 (IQR, 74–226 cells/mm3), and the median HIV RNA level was 4.39 log10 copies/ml (IQR, 4.04–4.72 log10 copies/ml). There was no significant difference in CD4 T cell count and viral load between HIV monoinfection and HIV/HCV coinfection (p>0.05). The median HCV RNA level was 6.05 log10 copies/ml (IQR, 5.72–7.22 log10 copies/ml) and there was no significant difference between HCV monoinfection and HIV/HCV coinfection (p>0.05).
Characteristics of HIV- and/or HCV-Infected Patients and Healthy Controls
Data are expressed as median (IQR).
The proportion of Tregs increased in chronic HIV and/or HCV infection
We evaluated the baseline proportion of Tregs in PBMCs in different groups, including HIV-monoinfected, HCV-monoinfected, and HIV/HCV-coinfected patients, as well as healthy controls. Tregs were defined as CD4+ T cells expressing CD25 and FOXP3 (Fig. 1a). Using this definition, the highest level of Tregs among CD4+ T cells was observed in HIV/HCV-coinfected patients. As shown in Fig. 1b, the percentage of Tregs was increased significantly in HIV-monoinfected and HIV/HCV-coinfected patients [7.52% (3.98–13.30%) and 8.39% (5.38–14.90%)] compared with that in controls [4.37% (3.23–5.45%); p=0.006 and <0.001] and HCV-monoinfected patients [5.81% (4.11–8.46); p=0.048 and 0.031]. The proportion of Tregs in HCV monoinfection was slightly increased compared with that in healthy controls (p=0.087). The level of Tregs in coinfected patients seemed a little higher than that in HIV-monoinfected patients. However, the difference did not reach statistical significance (p=0.109). These results indicated that the Treg level was upregulated in HIV infection and HCV infection could not enhance this kind of upregulation significantly.
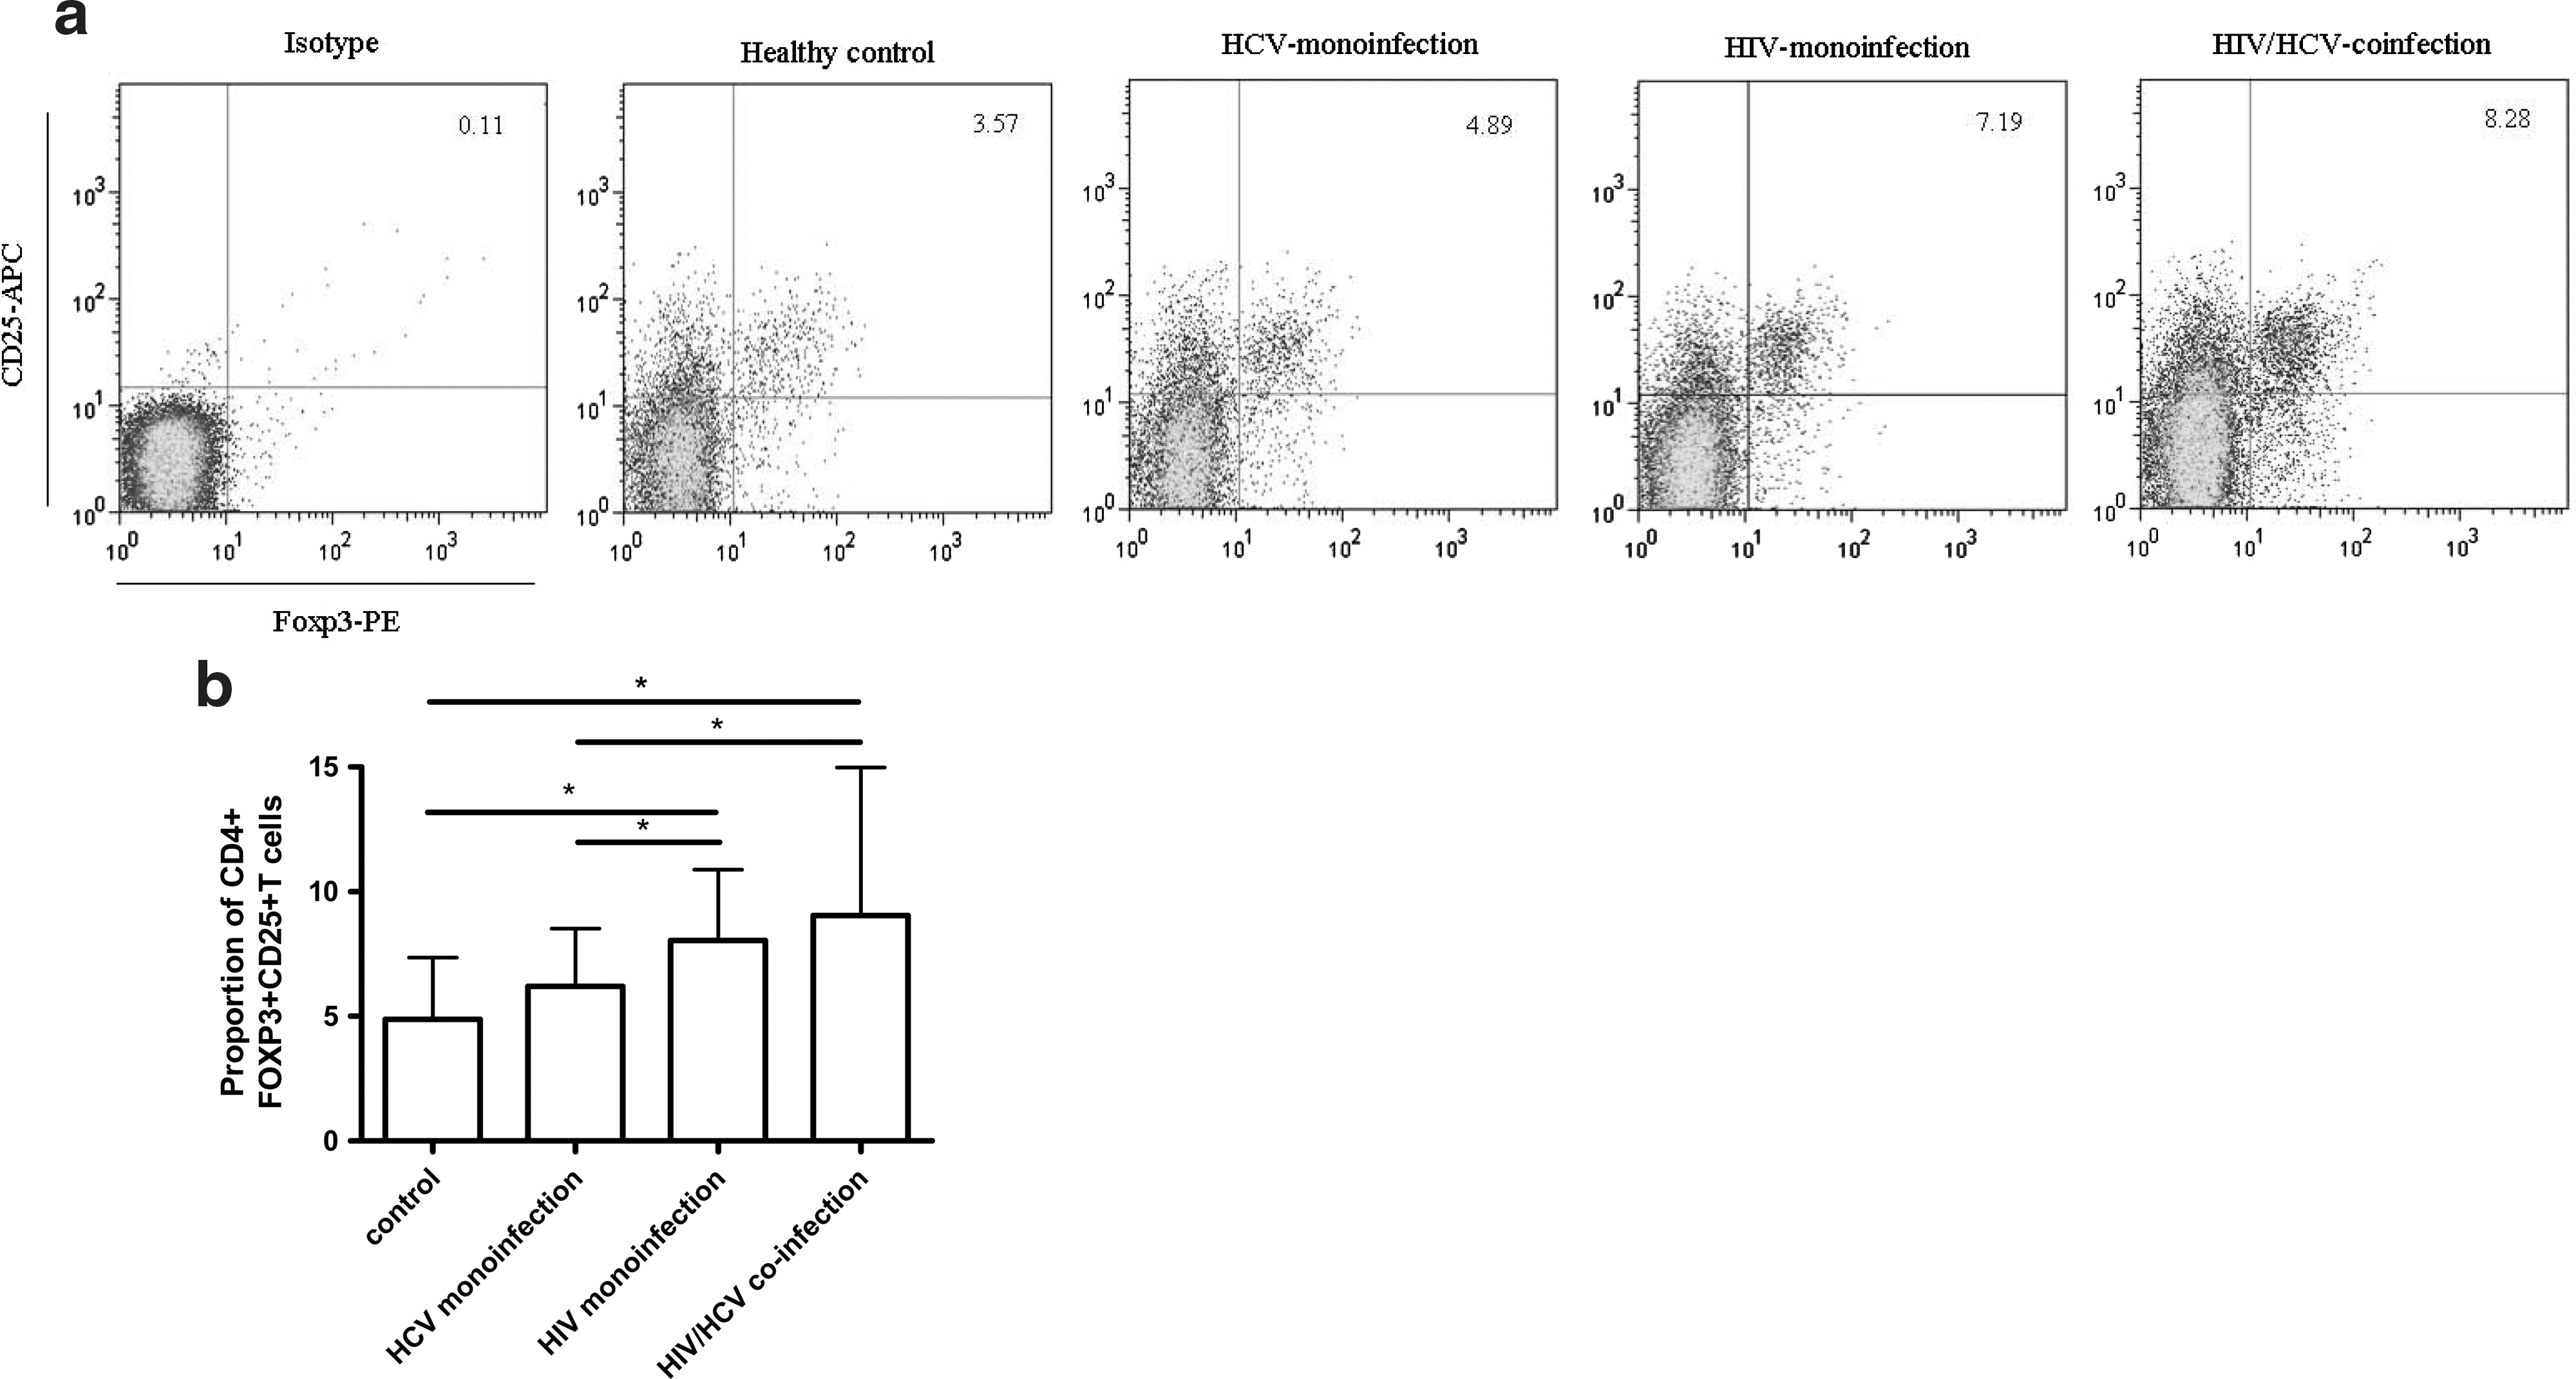
Levels of Treg cells expressing CD4, CD25, and FOXP3 in different groups: healthy control, HCV monoinfection, HIV monoinfection, and HIV/HCV coinfection.
Level of Tregs correlated with HIV disease progression before HAART
Previous studies have documented a decrease in the frequency of Tregs from the peripheral blood of patients with progressive disease. 6,8,18 Herein, in HIV-infected patients, both HIV monoinfection and HIV/HCV coinfection, there was a significantly inverse correlation between CD4 T cell counts and proportions of Tregs (r=–0.392; p=0.012), shown in Fig. 2a. However, when patients were stratified according to CD4 T cell counts, no significant differences were found between Treg proportions in patients with CD4 T cell counts <200 cells/μl and >200 cells/μl (p>0.05). The continuous replication of the virus with a high incidence of tolerable mutations leads HIV-1 to rapidly escape from immunological pressure. 27,28 This high level of viral replication results in abnormal immune activation. Theoretically, Tregs should expand and suppress the activation and proliferation of effector cells. Consistent with this hypothesis, a significant positive correlation was found between HIV-RNA viral load and the proportion of Tregs in HIV-infected patients (r=0.354; p=0.025), as shown in Fig. 2b. This result indicated that HIV disease progression had a positive impact on the upregulation of the level of Tregs in patients with typical progression.
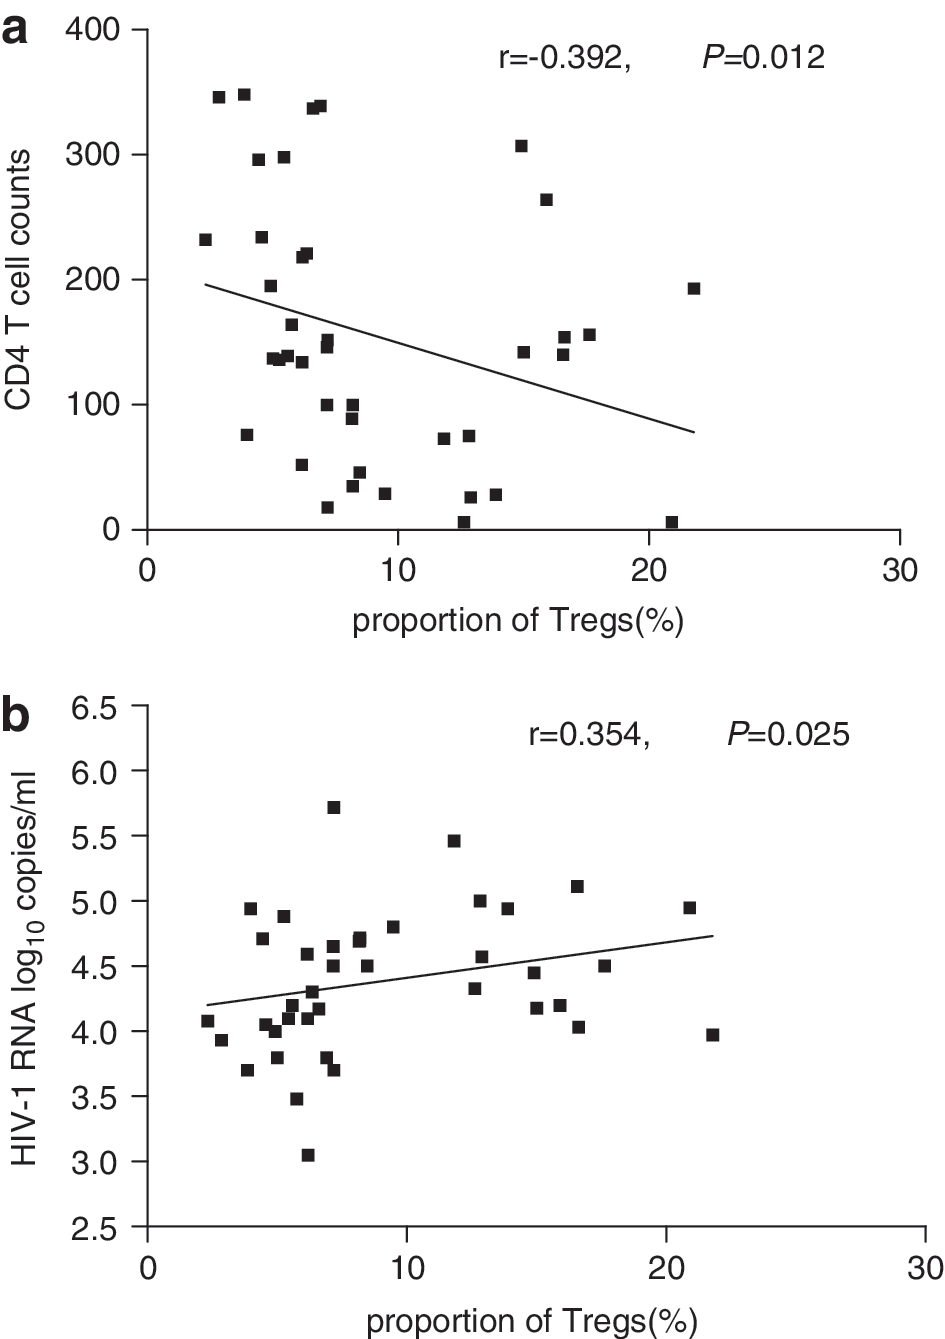
Correlation between the proportion of Treg cells and CD4 T cell counts
The proportion of Treg cells in HIV-infected patient positively correlated with CD8+ T cells activation but not specific responses
HIV-1 infection is characterized by a gradual decline in CD4 T cell numbers and by chronic hyperactivation of the immune system driven by consistent HIV replication. We have shown the positive correlation between HIV-RNA viral load and proportions of Tregs. To further investigate if Tregs in typical progressors could suppress immune activation in vivo, we evaluated the proportion of CD8+ T cells expressing CD38 and HLA-DR. We observed considerably elevated expression of CD38 and HLA-DR on CD8+ T cells in HIV-infected subjects but not in HCV-infected patients in comparison to that in healthy controls (p=0.018 and 0.027, respectively). We did not observe any significant difference on the proportion of CD8+ T cells expressing CD38 or HLA-DR between HIV-1-monoinfected and HIV/HCV-coinfected patients (both of them p>0.05).
As shown in Fig. 3, the proportion of Tregs was positively correlated with the percentage of activated CD38+CD8+ T cells and HLA-DR+CD8+ T cells in HIV patients without any antiretroviral treatment (r=0.432, p=0.005 and r=0.350, p=0.027, respectively). This result indicated that in order to inhibit hyperactivation of the immune system, the level of Tregs was upregulated. However, this upregulation could not control this immune activation in typical HIV progressors. Furthermore, we determined whether the upregulated proportion of Tregs would affect the magnitude of HIV-specific cytotoxic T cell (CTL) responses in HIV-infected individuals. Interestingly, we did not observe any positive or negative correlation between the proportion of Tregs at baseline and HIV-specific CTL responses detected using an IFN-γ ELISpot assay (r=–0.131, p=0.421). The possible reason for this result might be the complexity of HIV-specific CTL responses we have discussed before. 29

Immune activation of CD8+ T cells in HIV infection. Correlation between proportion of Treg cells and the percentage of activated CD38+CD8+ T cells
Influence of antiretroviral therapy on proportion of Tregs
In the present study, all the HIV patients had CD4 T cell counts <350 cells/μl and accepted antiretroviral therapy after baseline evaluation. After 12 weeks of HAART, the plasma viral loads in 70% (28/40) of HIV patients were under a detectable level, and there was no significant difference between the change of viral loads in HIV monoinfection and HIV/HCV coinfection (p=0.378). Next, we compared the changes of percentage of Tregs over 12 weeks of HAART in chronically HIV-monoinfected and HIV/HCV-coinfected individuals. After 4 weeks of therapy, the Treg level began to reduce following the drop in HIV plasma viral load (data not shown). Twelve weeks later, a significant decrease in the proportion of Tregs was detected in these HAART-treated patients [6.73% (2.89–10.34%)] compared with the data at baseline (p=0.034), shown in Fig. 4a. However, after this drop in the proportion of Tregs, the level did not reach the normal level in healthy controls.
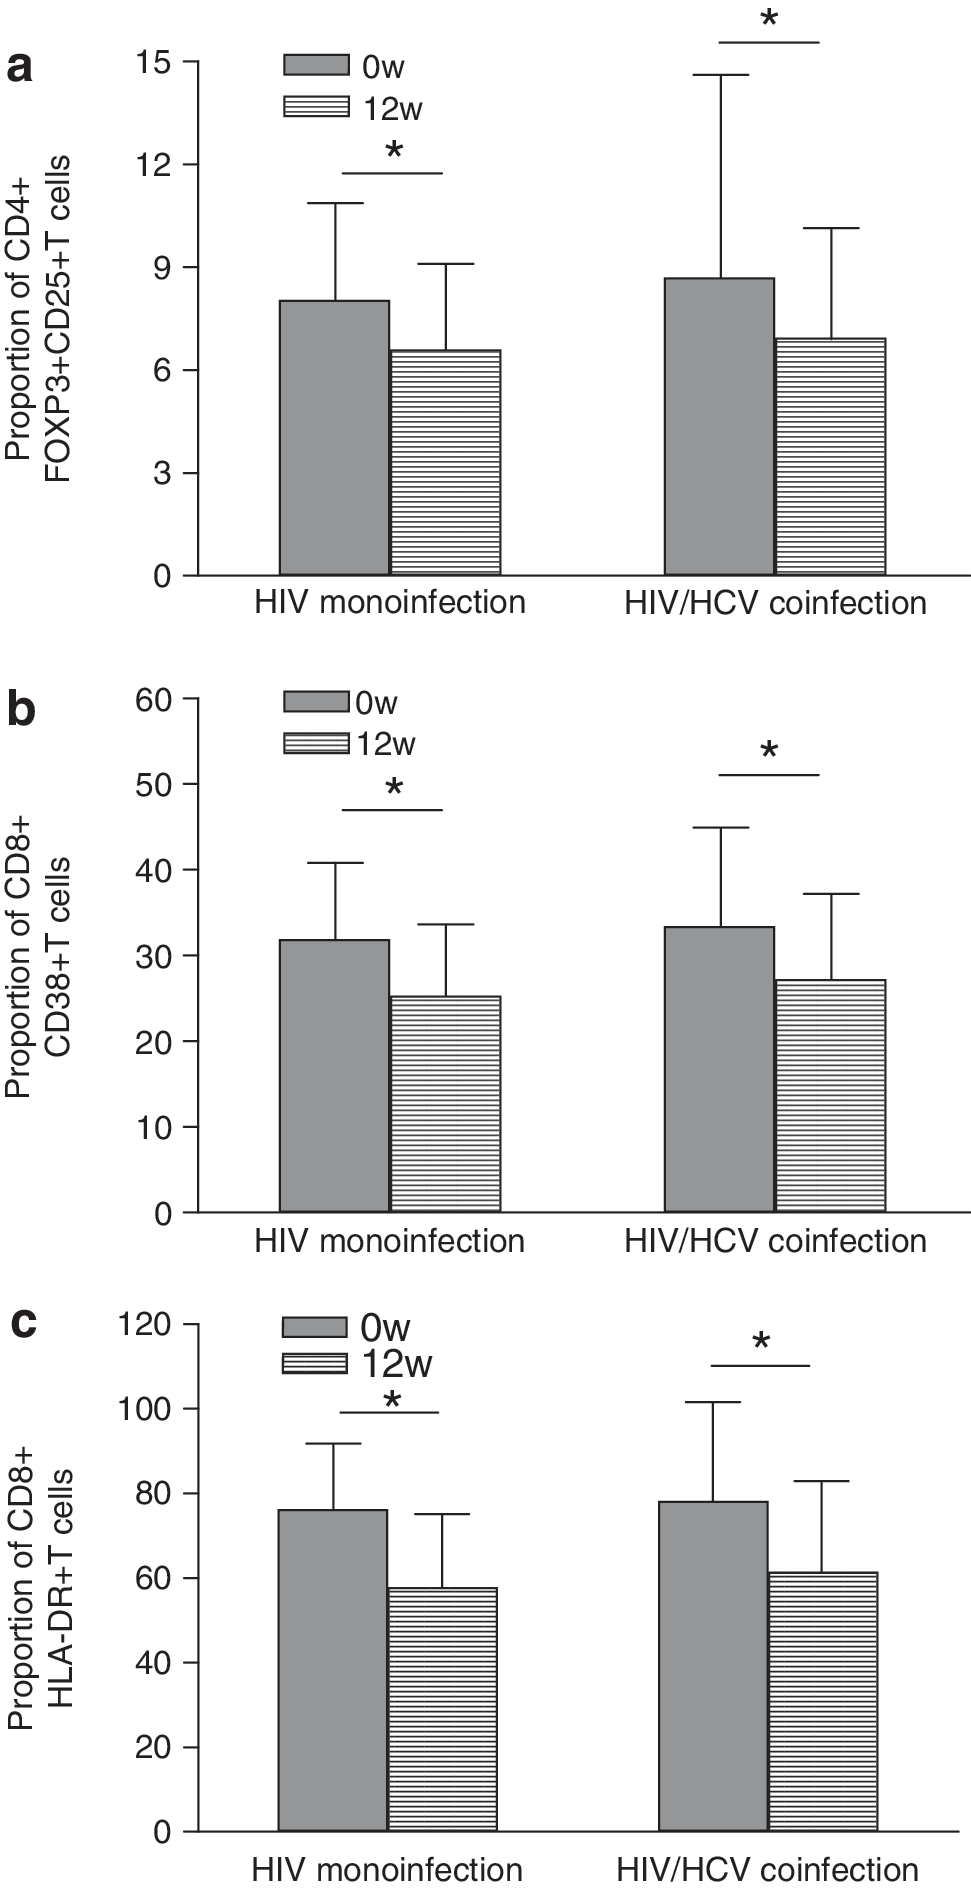
Comparison of levels of Treg cells
There was still no significant difference between the proportion of Tregs in HIV monoinfection [6.61% (2.25–15.98%)] and HIV/HCV coinfection [6.92% (3.19–17.52%)] after 12 weeks of HAART (p=0.875). Furthermore, we observed that the proportion of CD8+ T cells expressing CD38 or HLA-DR was significantly decreased after 12 weeks of HAART [CD38 from 31.52% (19.89–57.30%) to 26.43% (18.91–42.71%), p=0.016; HLA-DR from 77.15% (65.87–89.12%) to 72.20% (59.32–88.32%), p=0.002] (Fig. 4b and c). Interestingly, contrary to baseline, we did not find a positive correlation between the proportion of Tregs and the percentage of CD8+ T cells expressing CD38 or HLA-DR any more after 12 weeks of HAART (p>0.05). Our results indicated that the reduction in the level of Tregs and proportion of activated CD8+ T cells was driven by HAART-mediated HIV suppression. But the decrease in Tregs was not parallel to that of activated CD8+ T cells.
Discussion
Previous studies indicated that HIV/HCV coinfection was associated with accelerated progression of liver disease and decreased survival rate among HCV-infected individuals comparing with mono-HCV infection. 30 –32 However, studies of the impact of HCV on HIV infection have reached an opposite conclusion. Some indicated HCV infection has a significant effect on the progression of HIV to AIDS-defining illness and AIDS-related mortality, 33 –36 while others found no significant evidence that HCV has a negative effect on HIV progression. 3,4,37 –40 Neither of their mechanisms has been defined.
In the present study, the level of Tregs was examined in patients with chronic HIV and/or HCV infection. Tregs were defined as those CD4+ T cells expressing CD25 and FOXP3. 41,42 We found significantly increased Treg levels in HIV monoinfection and HIV/HCV coinfection, but not in HCV monoinfection. We did not find a significant difference between the proportion of Treg cells in HIV monoinfection and HIV/HCV coinfection. This result suggested that HCV coinfection had no distinct influence on the number of Tregs. There have been conflicting data regarding the level of Tregs during chronic HIV infection. Most studies have reported that the proportion of Tregs was upregulated 14,15,25 or kept at a normal level 17,43 in HIV-infected individuals compared with that in healthy controls. However, several groups declared that the proportions of Tregs were decreased in HIV-infected individuals. 26,44,45 These differences most probably reflect the different methods used for quantification of Tregs as well as the heterogeneity of the patient population investigated. Furthermore, Tregs were often simply classified as CD4+CD25+ cells, with no additional markers such as FOXP3 for regulatory activity taken into consideration.
A previous study has also shown that the decrease in CD4+ Tregs was associated with a decrease in total CD4+ T cell numbers, but no correlation was found between CD4+ Tregs and CD4 counts. 45 However, in our study, we found a significant inverse correlation between the proportion of Tregs and CD4+ T cell counts in untreated chronic HIV-infected patients. Furthermore, Tregs were observed to increase with HIV viral load in these study subjects.
As we have shown, CD4+ T cell counts gradually dropped with the progression of HIV infection. The continuous replication of the virus with a high incidence of tolerable mutations leads HIV-1 to rapidly escape from immunological pressure, 27,28 and causes continuous immune activation. As we have shown here, the percentage of CD8+CD38+ T cells and CD8+HLA-DR+ T cells was increased in HIV-infected individuals compared with healthy controls, and significantly positively correlated with HIV viral loads (data not shown). The increased proportion of Tregs indicated that the immune system tried to suppress overactivation in chronic HIV infection. However, even though the percentage of Tregs increased, Treg cell absolute counts remained stable or dropped throughout HIV disease progression. 14,45,46 Moreover, the suppressive activity of Tregs in HIV typical progressors appeared to be somewhat diminished. 21 Therefore, the immune activation in HIV progression could not be substantially controlled by Tregs suppression.
Furthermore, we also observed that there was no positive influence on the level of activation of CD8+ T cells burdened with HCV infection. Few studies focused on the impact of HCV infection on the activation of CD8+ T cells. 47,48 The results from different kinds of study populations were still inconsistent. In adults, Cacoub et al. did not observe any immune activation of peripheral blood CD8+ T cells in patients with HCV infection. 47 This result was consistent with the present data that we showed here. However, in another study focused on children with vertically transmitted HCV infection, an upregulated percentage of CD8+HLA-DR+ T cell in HCV-infected children was reported. 48 These different conclusions may be due to the different populations in different studies. Further comparisons need to be done in the future.
Recent studies observed higher level of CD8+ T cell activation in HIV/HCV-coinfected individuals than that in HIV-monoinfected individuals, 9,49,50 even after HAART therapy. 49 However, we did not observe this extra upregulation of activated CD8+ T cells in HIV/HCV-coinfected patients before HAART. Is this due to different population backgrounds or the limited number of study subjects? More work need to be done in Chinese patients with HIV/HCV coinfection.
It has been demonstrated that successful antiretroviral therapy could control HIV viremia and induce Treg reconstitution, which caused a reduction of immune activation. 46 We observed that the proportion of Tregs was significantly decreased after HAART therapy. Andersson et al. also showed Tregs recovering to levels similar to those measured in uninfected donors' blood, 44 although they detected that mRNA expression in purified T cells reflected the amount of Tregs. These results suggested that the level of viral particles had indeed an influence on the level of Tregs in peripheral blood. Even though we do not know the exact causal relationship between levels of virus and Tregs, the clearance of HIV virus could lead to the down regulation of the proportion of Tregs in blood. This conclusion corresponds to the previous observation that Tregs increased with HIV viral load.
The efficient inhibition of the activation and apoptosis of CD8+ T cells by Treg may be beneficial in terms of blocking HIV-1 disease progression. Consistent with previous studies, 51 we observed that levels of HIV-specific CD8+ T cells steadily declined following suppression of viral replication with HAART. Although the proportion of Tregs decreased after HAART therapy in our study, the absolute Tregs count increased after successful suppression of the virus. 46 The decline of CD8+ T cell responses may be partially due to this absolute increase in Treg number, but the main reason for this drop should be the depletion of HIV virus. 52 It has been shown that an increase of CD8+ T cell responses occurred following viral rebound upon treatment removal.
Conclusions
Our study showed that the proportion of Tregs was upregulated in HIV-infected individuals, and HCV infection could not enhance this kind of upregulation significantly. However, this upregulation of Tregs could not control the abnormal immune activation of CD8+ T cells in typical HIV progressors. We did not find a significant influence of HCV on the status of CD8+ T cell activation in HIV-infected individuals. After HAART therapy, the proportion of Tregs dropped, but it was still more than the level in healthy controls. The high level of immune activation of CD8+ T cells was reversed after HAART therapy. The decrease of Tregs did not change the downregulation of HIV-1-specific CTL responses in these HIV-infected patients after HAART therapy.
Footnotes
Acknowledgments
We thank all the subjects who agreed to participate in this study. We are also grateful to researchers at the 8th hospital of Guangzhou for their great help and cooperation. This work is supported by two Grand Programs on Key Infectious Disease 2008ZX10001-008 and 2008ZX10001-002 project 2 and one National Science and Technology Major Project on Key Drug Development 2009ZX09301-009-BD25.
Author Disclosure Statement
No competing financial interests exist.