
Abstract
We assessed metabolic changes for darunavir/ritonavir (DRV/r) once daily (qd) versus atazanavir/ritonavir (ATV/r) qd with fixed-dose tenofovir/emtricitabine. This was a phase 4, multicenter, open-label, randomized exploratory study. Treatment-naive, HIV-1-infected adults received DRV/r 800/100 mg qd or ATV/r 300/100 mg qd, both with emtricitabine/tenofovir 200/300 mg qd. Primary end point: change in triglyceride levels from baseline to week 12. Secondary end points: week 12 and week 48 changes in lipid parameters, insulin sensitivity, inflammatory/coagulation/bacterial translocation biomarkers, viral load, CD4+ cell count, and week 48 changes in adipose tissue distribution and subjects' perceptions of body changes. In the DRV/r arm, 32/34 and 29/34 subjects completed weeks 12 and 48, respectively; in the ATV/r arm, 30/31 and 25/31 subjects completed weeks 12 and 48, respectively. Small changes in lipid parameters from baseline to weeks 12 and 48 were observed in both arms. Differences were noted between arms in mean changes in total cholesterol (DRV/r, 20.3 mg/dl; ATV/r, 4.6 mg/dl) and apolipoprotein A1 (DRV/r, 10.7 mg/dl; ATV/r, –0.7 mg/dl) at week 12. At week 48, no clinically relevant differences between arms were noted for changes in any lipid parameter, fasting glucose, or insulin sensitivity. Biomarkers generally decreased and efficacy parameters improved in both arms over 48 weeks. Changes in adipose tissue were small and comparable between arms. Subjects' perceptions of body changes generally improved in both study arms. This first pilot comparison in HIV-1-infected subjects suggests that DRV/r has a metabolic profile similar to ATV/r over 48 weeks of treatment. Further randomized studies are warranted.
Introduction
HIV-
Thymidine analogs and, to a lesser degree, PIs and nonnucleoside reverse transcriptase inhibitors have also been associated with lipoatrophy and lipodystrophy. 5,19 –22 In the HIV-1-infected population, lipodystrophy is an umbrella term that encompasses all changes in fat distribution, including lipohypertrophy, which can include accumulation of fat in the neck, chest, back, breasts, and/or abdomen, and lipoatrophy, which may include fat loss from the limbs, buttocks, and/or face. 23 –25 HIV-1-associated changes in body shape have the potential to impact a subject's quality of life and well-being, and several studies have linked quality of life to survival of HIV-1-infected subjects. 26 –28 Interestingly, subjects' perceptions of the changes to their body during ARV therapy are not always in accordance with the objective changes measured in a clinical setting. 29 Despite this, few studies have specifically investigated subjects' perceptions of changes in their bodies due to ARV therapy. 30,31
Darunavir (DRV; PREZISTA, Janssen Therapeutics, Division of Janssen Products, LP, Titusville, NJ), a PI, combined with low-dose ritonavir (DRV/r), has a favorable lipid profile in healthy and treatment-naive subjects. 32,33 Another PI, atazanavir (ATV; REYATAZ, Bristol-Myers Squibb, Princeton, NJ), boosted with low-dose ritonavir (ATV/r), has also demonstrated a favorable metabolic profile in treatment-naive subjects. 34 The metabolic effects of DRV/r have been shown to be comparable with those of ATV/r in HIV-negative subjects. 33 Furthermore, the metabolic effects of these ARVs have not been directly compared in HIV-1-infected, treatment-naive subjects.
Presented here are the week 12 primary end point analysis and the week 48 results of METABOLIK (Metabolic Evaluation in Treatment-naïves Assessing the impact of two BOosted protease inhibitors on LIpids and other marKers), an exploratory study evaluating metabolic outcomes of DRV/r-based therapy compared with those of ATV/r-based therapy in treatment-naive, HIV-1-infected adult subjects. Additionally, we report changes in adipose tissue distribution and subjects' perceptions of body changes over the course of the trial.
Materials and Methods
Study design and treatment
METABOLIK was a 48-week, phase 4, multicenter, open-label, randomized study that assessed changes in fasting lipids, glucose, insulin, insulin sensitivity, biomarkers, and the safety and efficacy of DRV/r-based versus ATV/r-based therapy in HIV-1-infected, treatment-naive adults. Adult subjects were randomized in a 1:1 ratio, stratified by sex, to receive DRV/r 800/100 mg once daily (qd) or ATV/r 300/100 mg qd, both with a fixed-dose combination of emtricitabine/tenofovir disoproxil fumarate (FTC/TDF) 200/300 mg qd. Both DRV and ATV, with ritonavir, were administered within 30 min of a meal to maximize drug exposure.
Subject population
Eligible subjects were at least 18 years old and naive to ARV therapy (≤10 days' previous ARV therapy at any point) with HIV-1 RNA 1000 copies/ml or higher; there were no CD4+ count restrictions. Subjects were required to have demonstrated sensitivity to DRV, ATV, TDF, and FTC by resistance testing (DRV, ATV, and TDF susceptibility determined by Antivirogram, Virco Lab, Inc., Raritan, NJ; FTC susceptibility determined by virco® TYPE HIV-1, Virco Lab, Inc., Raritan, NJ). Exclusion criteria included body mass index greater than 30 kg/m2; fasting glucose greater than 110 mg/dl; low-density lipoprotein (LDL) greater than 130 mg/dl; triglycerides greater than 200 mg/dl; alanine aminotransferase greater than 2.5 times the upper limit of normal; creatinine clearance 50 ml/min/m2 or lower; evidence of significantly decreased hepatic function or decompensation; presence of any Centers for Disease Control and Prevention active AIDS-defining illness (Category C conditions), except stable cutaneous Kaposi's sarcoma or wasting syndrome; acute or chronic hepatitis A, B, or C; grade 3 or 4 laboratory abnormalities; history of significant cardiac, vascular, pulmonary, gastrointestinal, endocrine, neurologic, hematologic, rheumatologic, psychiatric, or metabolic disturbances; use of any non-ARV investigational agents within 90 days of screening; receipt of anabolic steroids, atypical antipsychotics, or growth hormones; use of disallowed concomitant therapy; and pregnancy or breastfeeding. Use of lipid-lowering medications, either prescription (e.g., statins or fibrates) or over-the-counter (e.g., fish oil), was prohibited from 28 days before baseline through week 12 of the trial. The use of lipid-lowering medications was allowed after week 12. All subjects provided written informed consent.
Study evaluations
The primary end point was the change in triglyceride levels from baseline to week 12. Secondary end points included week 12 and week 48 changes in other lipid parameters that included total cholesterol (TC), high-density lipoprotein (HDL), LDL, and apolipoproteins (apo) A1 and B. Lipid parameters were tested for normality. Additional secondary end points assessed at week 12 and week 48 included changes in glucose and insulin levels, insulin sensitivity (as measured by the homeostasis model assessment of insulin resistance [HOMA-IR] method),
35
inflammatory biomarkers (interleukin [IL]-1 beta, IL-6, tumor necrosis factor receptor II [TNF RII], high sensitivity C-reactive protein [hs-CRP]), coagulation biomarkers (fibrinogen,
For measuring insulin sensitivity, HOMA-IR was calculated using the following formula: {[fasting insulin (μU/ml)]×[fasting glucose (mmol/liter)]}/22.5.
36
The lower limits of quantification (laboratory variability; normal reference range) for the biomarker assays are as follows: IL-1 beta, 0.125 pg/ml (6.7%; <0.201 pg/ml); IL-6, 0.2 pg/ml (4.3%; <11.83 pg/ml); TNF RII, 1 pg/ml (2.6%–4.8%; 1003–3170 pg/ml); hs-CRP, 0.15 mg/liter (<2%; <5.00 mg/liter); fibrinogen, 42 mg/dl (<4%; 211–372 mg/dl); and
For analysis of fat redistribution, computed tomography (CT) scans were performed at the L4–L5 level and mid-thigh at baseline and week 48, and centrally analyzed for total (TAT), subcutaneous (SAT), visceral (VAT), and peripheral (PAT) adipose tissue by BioClinica Imaging Technologies, Inc. (Newtown, PA). The 27-item, self-reported Assessment of Body Change and Distress (ABCD) questionnaire 37 was administered at baseline and at weeks 12 and 48 and was composed of three parts. The categorical portion of the questionnaire asked subjects to assign one of five answers, ranging from ”all of the time” to ”none of the time,“ to questions encompassing a wide range of disease-related issues. The yes/no portion of the questionnaire asked subjects to indicate whether they had noticed changes in aspects of their physical appearance. Finally, the questionnaire asked subjects to rate their overall satisfaction with their body. The questionnaire had a recall period of 4 weeks and measured subjects' perceived body changes, physical and emotional distress, social concerns, and health behavioral changes. Responses to the ABCD questionnaire were not considered or reported as adverse events (AEs).
Fasting (at least 8 h) blood samples for laboratory assessments, lipids, and efficacy parameters were taken at weeks 0, 4, 8, 12, 24, 36, and 48, and for biomarker tests at weeks 0, 4, 12, 24, and 48. Lipid parameters, glucose, and insulin assessments were analyzed by ICON Central Laboratories (Farmingdale, NY). Biomarkers were analyzed by Rush University Medical Center (Chicago, IL) and ICON Central Laboratories. The incidence and type of all AEs and serious AEs (SAEs) were recorded from the signing of the informed consent form through the completion of the last study-related procedure. All procedures followed were in accordance with the ethical standards of the responsible committee on human experimentation (institutional and national) and with the Helsinki Declaration of 1975, as revised in 2000.
Statistical analysis
The primary end point for this study was change in triglyceride levels from baseline to week 12. Assuming a standard deviation (SD) of 75 mg/dl for the primary end point and a two-sided 95% confidence interval (CI) with a precision of 42 mg/dl on each side of the estimated difference, it would be required that at least 50 subjects complete the study (25 subjects per treatment arm). To allow for dropouts, an overall sample size of 60 subjects was planned. Descriptive statistics for the preplanned analyses of the primary and secondary end points at week 12 and week 48 are reported. The lipid-evaluable population used for the week 12 and week 48 lipid end points includes subjects completing week 12 who had a baseline value and at least one postdose fasting lipid value and no relevant protocol deviations or violations; lipid analyses were completed using observed values. All other end points use observed values for the intent-to-treat (ITT) population. The lipid and biomarker end points were estimated using mean values with 95% CIs. Response rates were derived using the confirmed virologic response (CVR; HIV-1 RNA<50 copies/ml, confirmed by two consecutive assessments at least 14 days apart) algorithm for the ITT population.
Results
Subject population and baseline characteristics
In total, 34 subjects (29 men) received DRV/r-based regimens and 31 (27 men) received ATV/r-based regimens. In the DRV/r arm, 32 subjects completed week 12 and 29 subjects completed week 48; in the ATV/r arm, 30 and 25 subjects completed week 12 and week 48, respectively. The lipid-evaluable populations included 28 and 27 subjects in the DRV/r and ATV/r arms, respectively. Of five (14.7%) subjects in the DRV/r arm who discontinued prior to week 48, two withdrew consent, one was noncompliant, one was lost to follow-up, and one relocated. Of six (19.4%) subjects in the ATV/r arm who discontinued early, two discontinued due to AEs (one with grade 3 leukocytoclastic vasculitis and one with grade 1 increased blood creatinine), one discontinued due to pregnancy, one discontinued because of investigational product dispensing error, one was lost to follow-up, and one withdrew consent. At baseline, DRV/r subjects had higher mean log10 baseline viral loads, lower median CD4+ counts, and lower TC and LDL levels compared with ATV/r subjects (Tables 1 and 2).
DRV/r, darunavir/ritonavir; ATV/r, atazanavir/ritonavir; BMI, body mass index; SD, standard deviation.
Sample size varies by time point and parameter.
Lipid-evaluable population.
Intent-to-treat population.
DRV/r, darunavir/ritonavir; ATV/r, atazanavir/ritonavir; CI, confidence interval; BL, baseline; SD, standard deviation; TG, triglyceride; TC, total cholesterol; LDL, low-density lipoprotein; HDL, high-density lipoprotein; Apo, apolipoprotein; HOMA-IR, homeostasis model assessment of insulin resistance; IL, interleukin; hs-CRP, high-sensitivity C-reactive protein; TNF RII, tumor necrosis factor receptor II; LPS, lipopolysaccharide.
Over the course of the study, the median duration of exposure to DRV or ATV was similar in the DRV/r (337 days) and ATV/r (336 days) arms. No subjects received lipid-lowering medications after week 12.
Lipid evaluations
Primary end point: week 12 change in triglyceride levels
From baseline to week 12, triglyceride levels increased by a mean of 22.0 mg/dl (SD: 62.7) in the DRV/r arm and 8.1 mg/dl (SD: 81.2; Table 2) in the ATV/r arm. The difference in week 12 mean change (95% CI) between the DRV/r and ATV/r arms was 13.8 (–25.8, 53.4). A sensitivity analysis was conducted on the changes in triglyceride levels using normalized (natural log) triglyceride data, yielding similar results.
Secondary end points
Small changes in other lipid parameters were noted with DRV/r therapy from baseline to week 12 (Table 2). Between arms, differences in lipid changes were seen only in TC and apoA1, with the DRV/r arm experiencing greater changes in both parameters than the ATV/r arm. The difference in week 12 mean change between arms (95% CI) was 15.7 mg/dl (0.0, 31.3) for TC (20.3 mg/dl in the DRV/r group and 4.6 mg/dl in the ATV/r group) and 11.4 mg/dl (0.7, 22.1) for apoA1 (10.7 mg/dl in the DRV/r group and –0.7 mg/dl in the ATV/r group) (Table 2). The actual mean TC values at week 12 were 161.5 mg/dl and 169.7 mg/dl for DRV/r and ATV/r, respectively, while the actual mean apoA1 values at week 12 were 125.6 mg/dl and 126.8 mg/dl for DRV/r and ATV/r, respectively. Consistent with the week 12 results, no clinically meaningful difference was seen between arms for mean changes in triglyceride levels at week 48. In contrast to the week 12 results, changes in TC and apoA1 were similar between arms by week 48 (Table 2). Additionally, no clinically relevant differences between arms were noted for changes in the other fasting lipid parameters, including the apoB/apoA1 ratio, at week 48 (Table 2). Changes from baseline for the lipid parameters were generally normally distributed.
Other laboratory evaluations and biomarkers
No clinically relevant changes were seen from baseline to week 12, or baseline to week 48, in glucose, insulin, and insulin sensitivity with DRV/r or ATV/r therapy (Table 2). Biomarkers of inflammation, coagulation and microbial translocation generally decreased from baseline to week 12 in both treatment arms (Table 2). From baseline to week 48, fibrinogen,
Adipose tissue distribution
At baseline, subjects in the ATV/r arm had higher mean values for all CT scan parameters compared with subjects in the DRV/r arm (Table 3). Changes in TAT, VAT, SAT, and the SAT/VAT ratio from baseline to week 48 were small and comparable between the DRV/r and ATV/r arms (Table 3). Although the mean change in PAT over 48 weeks was larger in the DRV/r arm than in the ATV/r arm (Table 3), none of the changes in adipose tissue distribution over 48 weeks was considered clinically relevant.
DRV/r, darunavir/low-dose ritonavir; ATV/r, atazanavir/low-dose ritonavir; CI, confidence interval; BL, baseline; TAT, total adipose tissue; SD, standard deviation; VAT, visceral adipose tissue; SAT, subcutaneous adipose tissue; PAT, peripheral adipose tissue.
Assessment of Body Change and Distress questionnaire
Subjects' perceptions of body changes generally improved from baseline to week 48 in both study arms. Overall, higher proportions of subjects in both arms were “satisfied” or “very satisfied” with their bodies after 48 weeks compared with baseline (Fig. 1A). Within each study arm, responses to the categorical portion of the ABCD questionnaire were similar at baseline and at week 48, with few subjects switching categories. Furthermore, these categorical responses were also similar between the DRV/r and ATV/r arms at both time points.
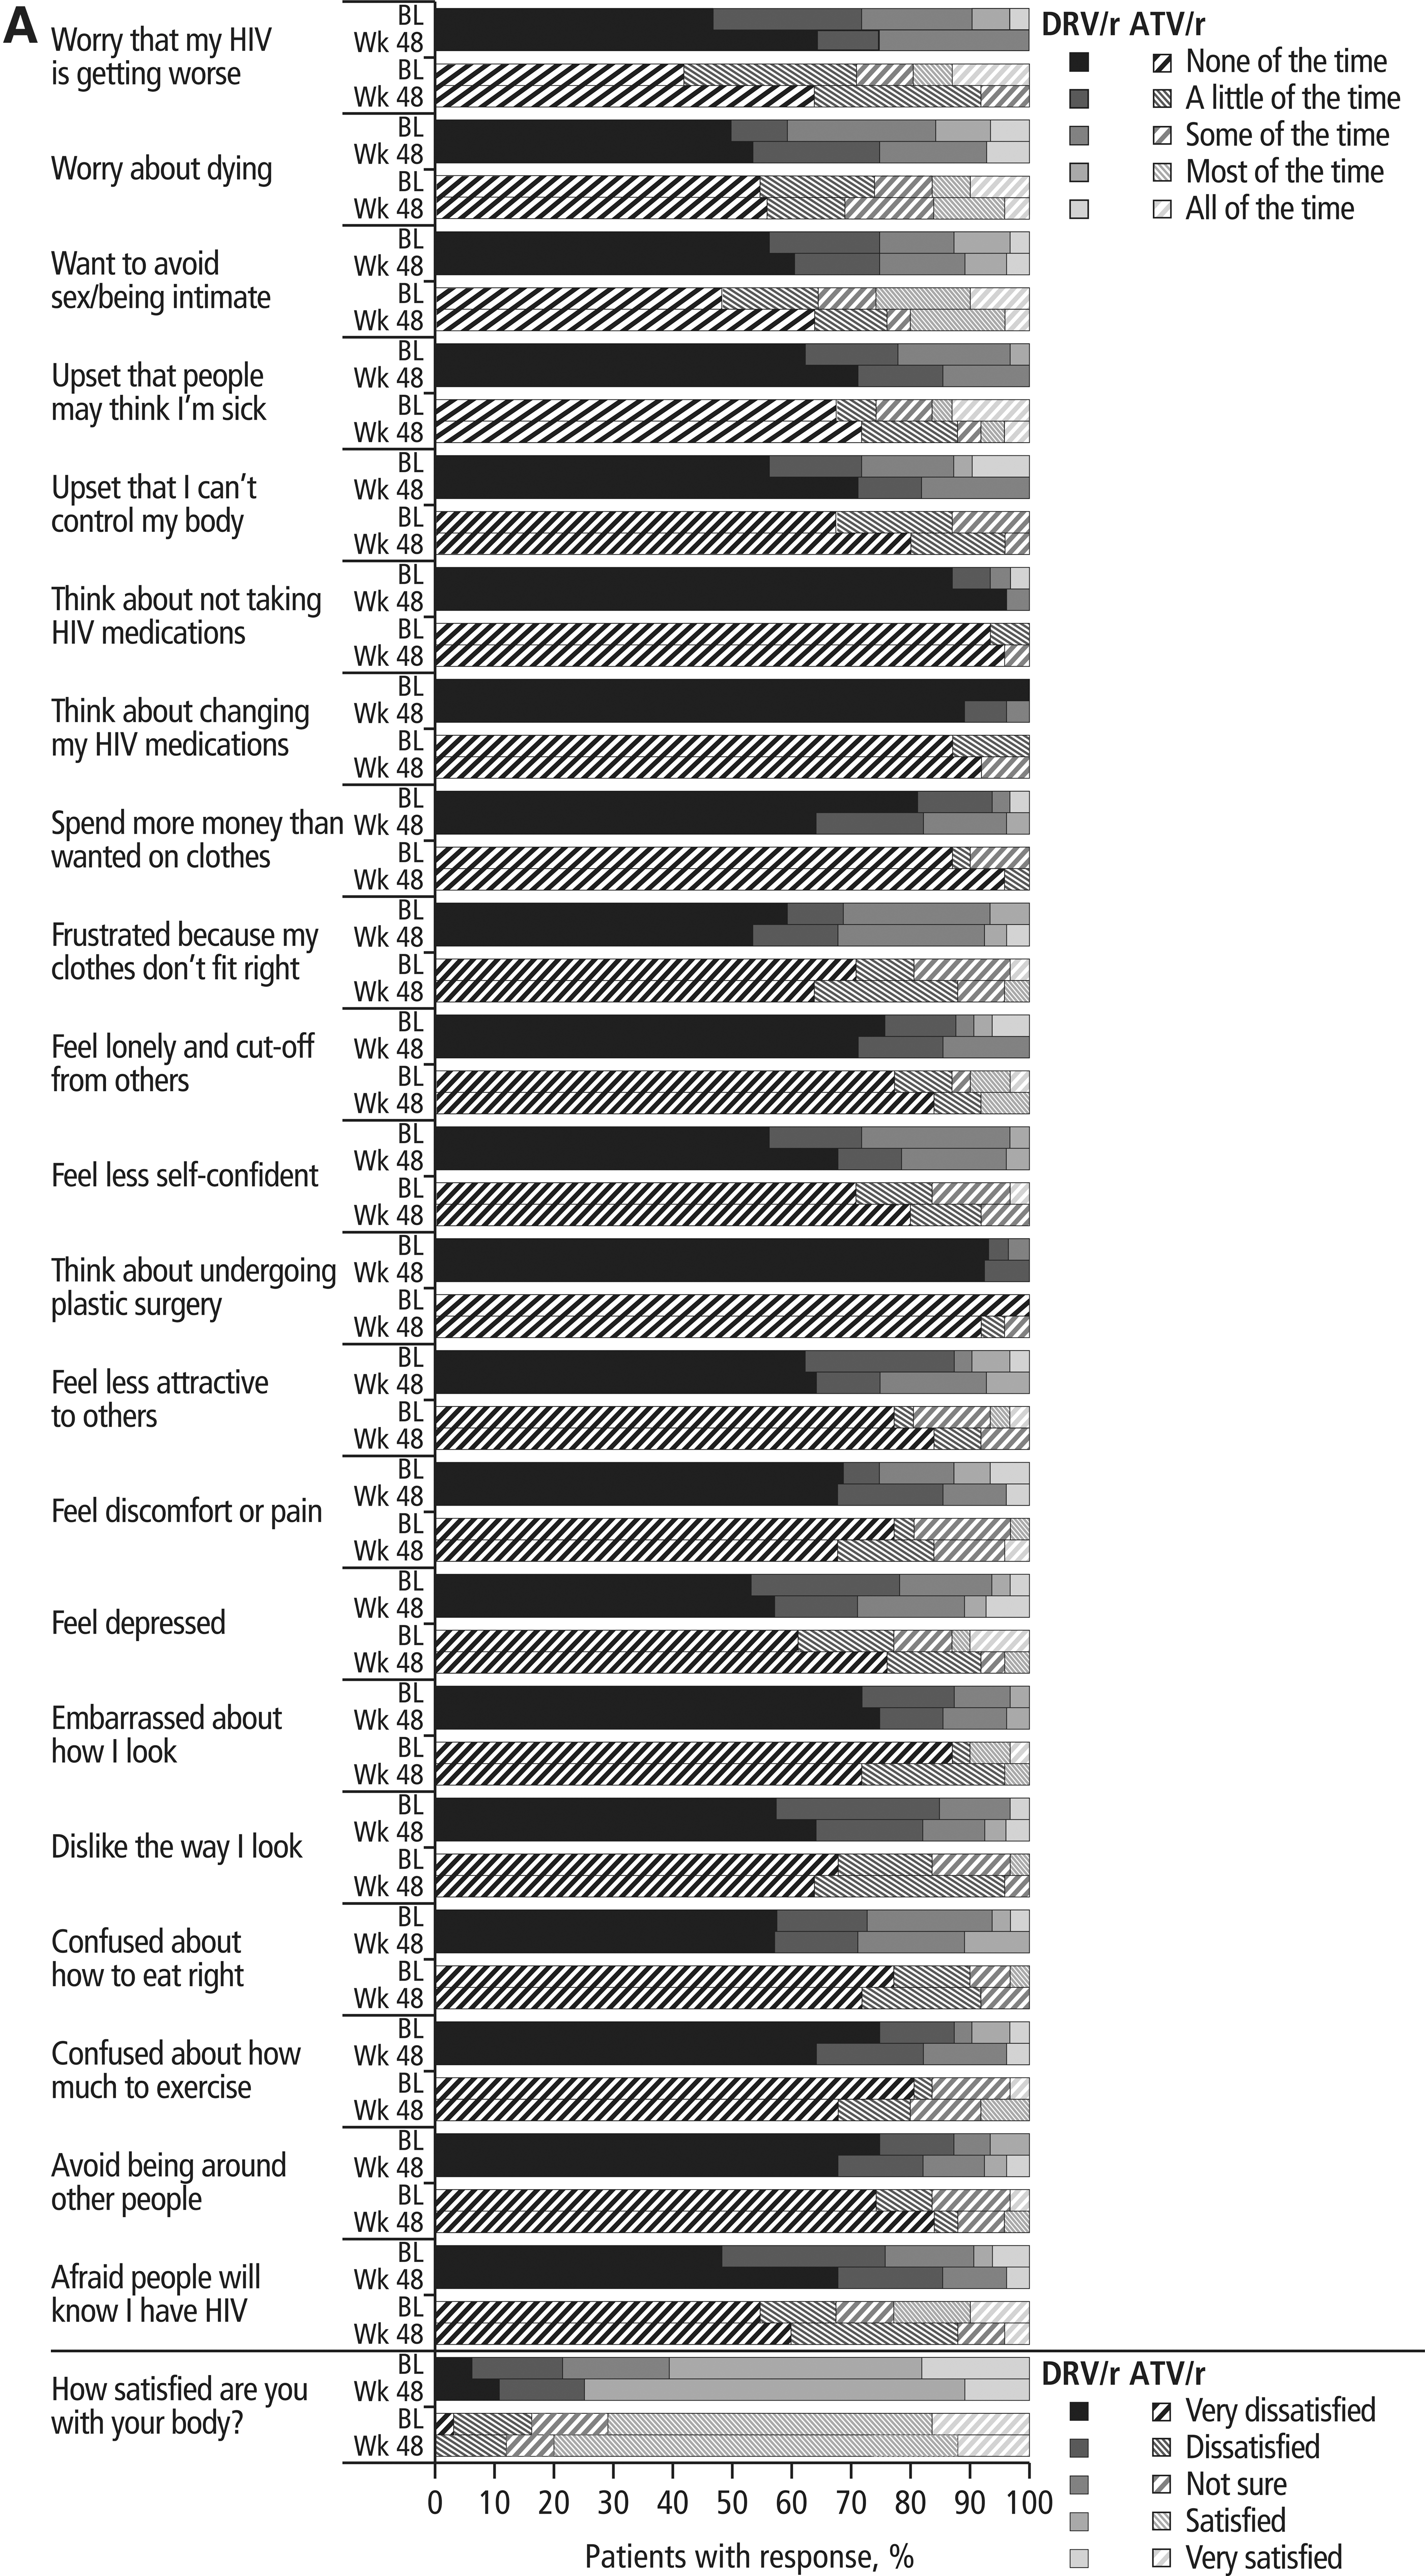
Results of the Assessment of Body Change and Distress questionnaire: (A) categorical and (B) yes versus no. *Data were missing from one ATV/r subject at week 48; DRV/r, darunavir/lowdose ritonavir; ATV/r, atazanavir/low-dose ritonavir; BL, baseline; Wk, week.
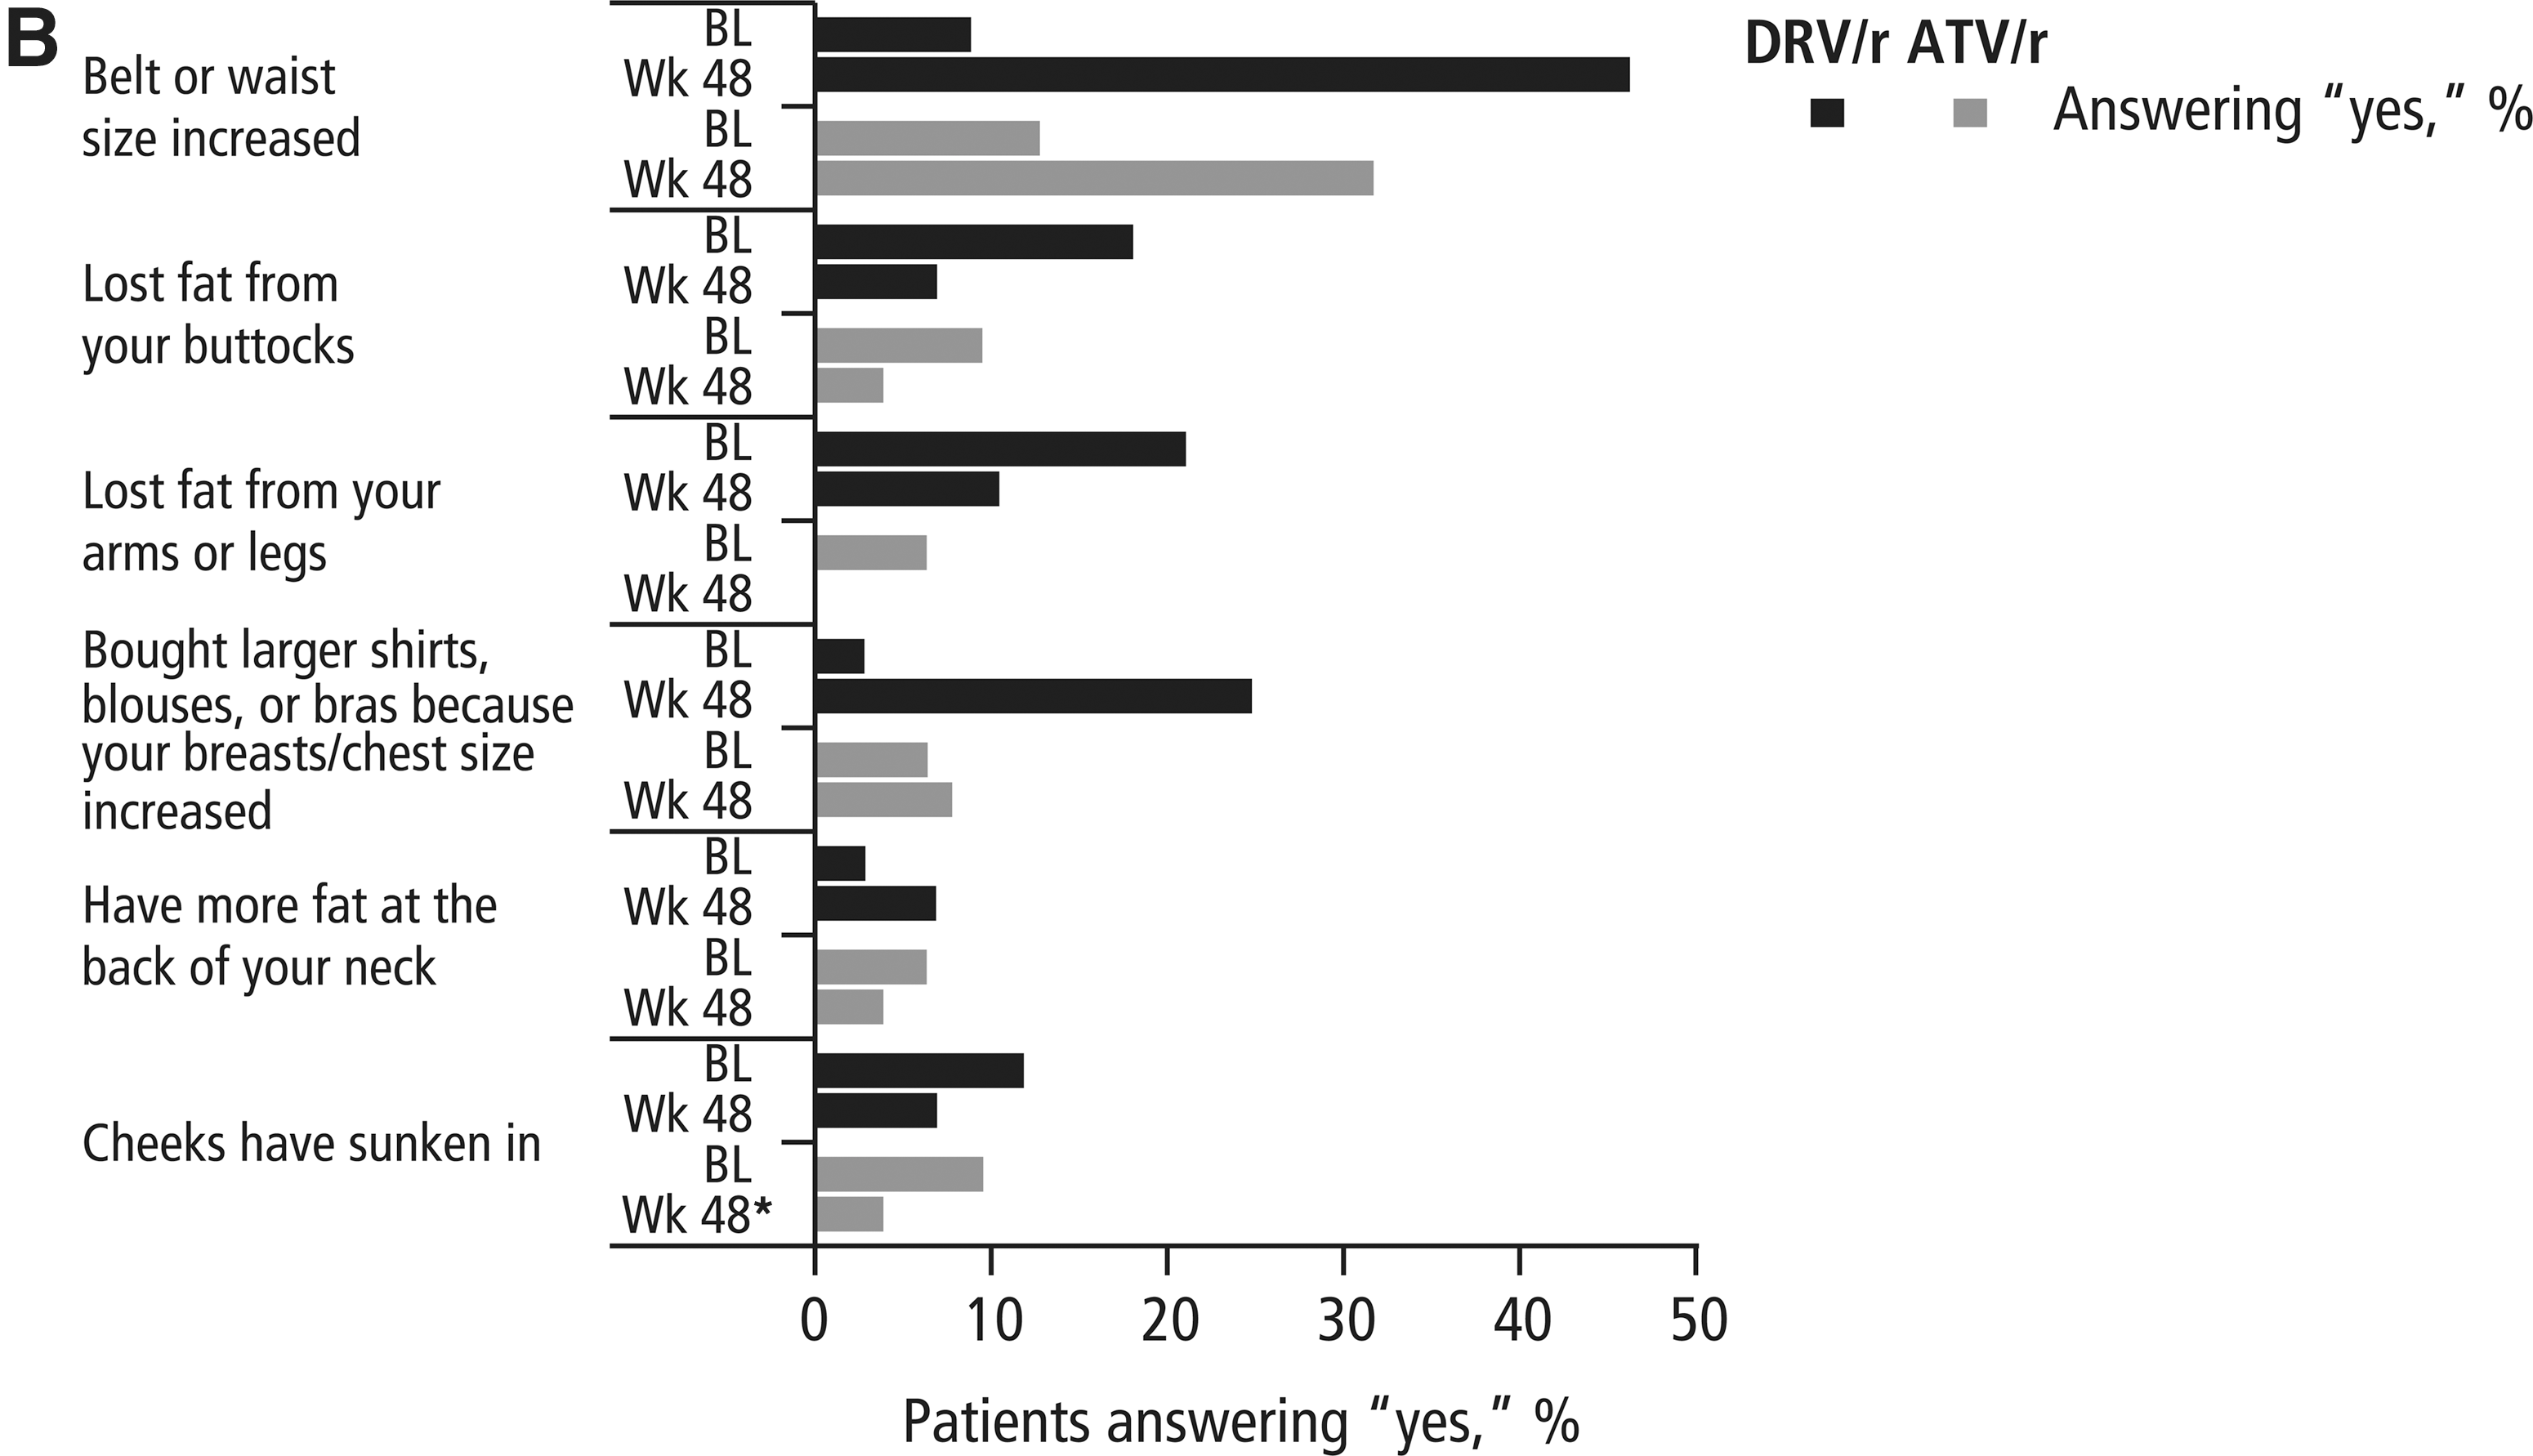
In the yes/no portion of the ABCD questionnaire (Fig. 1B), more subjects in both the DRV/r and ATV/r arms reported increases in waist size at week 48 compared with baseline (DRV/r, 46.4% vs. 9.1%; ATV/r, 32.0% vs. 12.9%). Fewer subjects in both the DRV/r and ATV/r arms reported that they had lost fat in their buttocks or in their arms and legs or that their cheeks had sunken in at week 48, compared with baseline. Slightly more subjects in the DRV/r arm and slightly fewer subjects in the ATV/r arm reported gaining fat at the back of their neck at week 48 compared with baseline. Although responses to this portion of the questionnaire were generally similar between arms, more subjects in the DRV/r arm reported increases in waist and chest size at week 48 compared with subjects in the ATV/r arm (Fig. 1B).
Efficacy evaluations
Viral load and CD4+ cell count improved over the course of the study. Mean viral load decreased and mean CD4+ count increased from baseline to week 48 in both the DRV/r (change in log10 viral load, –3.3 copies/ml; change in CD4+ count, +217.4 cells/mm3) and ATV/r arms (change in log10 viral load, –2.9 copies/ml; change in CD4+ count, +205.3 cells/mm3). At week 48, 76.5% of DRV/r and 71.0% of ATV/r subjects (CVR) achieved virologic response.
Cellular activation and senescence
The proportion of CD4+ and CD8+ cells displaying markers of cellular activation (HLADR+/CD38+), proliferation (Ki67+), and senescence (CD28−/CD57+) generally decreased from baseline to week 48 (Table 4). There was also a general increase in the percent of naive CD4+ and CD8+ T cells in both treatment arms.
Sample size varies by time point and parameter.
CD8+ cell subpopulations were based on CD8+ percentages and were not directly measured.
SD, standard deviation; DRV/r, darunavir/ritonavir; ATV/r, atazanavir/ritonavir; BL, baseline; HLADR, human leukocyte antigen-DR.
Safety evaluations
Over 48 weeks, rates of AEs were generally low and comparable between the DRV/r and ATV/r arms (Table 5), except grade 2–4 hyperbilirubinemia (considered at least possibly related to study drug), which was observed in more ATV/r subjects than DRV/r subjects. Increased total bilirubin reported as a grade 2–4 laboratory abnormality was observed far more frequently in the ATV/r arm compared with the DRV/r arm (Table 5). No other major differences in grade 2–4 safety parameters were noted between arms. A total of 10 subjects (Table 5) experienced 16 SAEs. Three events, chronic obstructive pulmonary disease with respiratory distress (DRV/r arm), diabetes mellitus (DRV/r arm), and mitral valve incompetence (ATV/r arm), were grade 4 in severity; all three were considered not related to study medication. Of the 16 SAEs, only one event, grade 3 pancreatitis in a subject in the DRV/r arm, was considered possibly related to study medication. No clinically relevant changes in creatinine clearance were seen from baseline to week 48 in the DRV/r [mean (SD) change: –0.00 (0.288) ml/min] or ATV/r [mean (SD) change: –0.03 (0.244) ml/min] arm.
Adverse events reported as laboratory abnormalities are not included.
DRV/r, darunavir/ritonavir; ATV/r, atazanavir/ritonavir; AE, adverse event; SAE, serious adverse event.
Discussion
These results illustrate that changes in triglyceride levels over 12 weeks of treatment were similar in subjects treated with DRV/r-based and ATV/r-based regimens. Additionally, small changes in lipids and insulin sensitivity, decreases in biomarkers, small changes in body fat, improvements in efficacy parameters, and a low incidence of AEs were seen over 48 weeks in both treatment arms. In the DRV/r arm, the increase in apoA1, the major component of HDL, indicates favorable lipid changes that support the return-to-health phenomenon observed in subjects with lower CD4+ cell counts initiating ARV therapy. 38 The small changes in lipids seen in this trial with DRV/r are in agreement with results from the ARTEMIS (AntiRetroviral Therapy with TMC114 ExaMined In naïve Subjects) trial of 689 treatment-naive subjects, which showed that once-daily DRV/r had a more favorable metabolic profile compared with that of lopinavir (LPV)/r. 39
Subjects infected with HIV-1 have increased levels of hs-CRP, TNF alpha (TNF-α), IL-6,
During HIV infection, chronic viremia induces progressive immune dysregulation characterized broadly by a decrease in CD4+ cells and an increase in CD8+ cells and specifically by elevated expression of CD38 and HLADR. This persistent immune activation yields rapid and elevated lymphocyte turnover and a shift to an immunosenescent phenotype (CD28−/CD57+ T cells). 49,50 As expected, based on the results of previous studies demonstrating the mitigating effect of ARV therapy on these processes, 51 –53 the current study found reductions in the proportion of activated T cells (CD38−/HLADR+) in both the DRV/r and ATV/r arms. Furthermore, the decline in the proportion of cells with an immunosenescent phenotype (CD28−/CD57+) illustrates the relationship between immune activation and immunosenescence and a critical immunologic benefit of ARV therapy.
Individuals infected with HIV-1 have a higher risk of serious, non-AIDS conditions than do uninfected subjects. 1 Given that HIV infection is now considered a manageable chronic disease, there is a growing level of attention focused on the need for identification of metabolically favorable ARVs. Atazanavir has generally been considered to have the most favorable metabolic profile among PIs 34 and was, therefore, chosen as a comparator drug for this study. In the study presented here, changes in metabolic parameters and biomarkers from baseline with DRV/r were comparable to changes observed with ATV/r. These results are in agreement with those seen in the TMC114-C159 trial, which investigated metabolic changes in healthy subjects treated with DRV/r or ATV/r over 28 days and observed similar mean changes in lipid and glucose parameters between treatment groups. 33 The TMC114-C159 trial did report significant differences in the changes between treatment arms for insulin and the TC/HDL ratio; these results, however, were not observed in METABOLIK, which noted differences between arms only in changes in TNF RII over 48 weeks.
The effect of some boosted PIs on insulin sensitivity remains controversial. In contrast to some other PIs, 8,10,11 no clinically significant changes were seen in insulin sensitivity in either the DRV/r or ATV/r arm of this study. Treatment with indinavir and treatment with LPV/r have both been associated with the development of insulin resistance in healthy subjects 9 –11 ; however, other studies have demonstrated that LPV/r does not affect insulin sensitivity in healthy subjects. 12,13 Atazanavir has generally had little effect on insulin sensitivity in previous trials of HIV-negative subjects, 10,12 and switching from other PI-based therapies to ATV/r has been shown to improve insulin sensitivity in HIV-1-infected subjects. 54 The results from this trial suggest that DRV/r, likewise, has little impact on insulin sensitivity. It should be noted that unlike the other studies cited here, which used the euglycemic, hyperinsulinemic clamp technique, this study used HOMA-IR as a measure of insulin resistance. However, several studies have demonstrated that results obtained using HOMA-IR correlate well with results using the euglycemic, hyperinsulinemic clamp technique. 36,55
Slight reductions in creatinine clearance were seen from baseline to week 12 in both treatment arms of this study; however, these reductions were no longer apparent after 48 weeks of treatment. A previous study suggested an association between the use of ATV, TDF, or indinavir and creatinine clearance, as indicated by a persistent reduction in glomerular filtration rate over time. 56 The biological explanations for these findings are unclear, but may include glomerular dysfunction, high renal excretion rates, and/or crystalluria. 56 Though the current study observed modest changes over 48 weeks, the ARTEMIS study did not show any changes in creatinine clearance over 96 weeks, 39 suggesting that long-term use of DRV/r has little effect on creatinine clearance.
The small increases in TAT and SAT seen in this study are similar to those seen in previous trials of boosted PIs and nucleoside reverse transcriptase inhibitors (NRTIs) in treatment-naive subjects. 19 –22,24 Increases in abdominal fat and waist size have been associated with increased cardiovascular risk factors in HIV-1-infected subjects, suggesting a need to monitor even small changes in fat distribution in this population. The increase in PAT seen with DRV/r treatment in this study was in contrast to data from other studies, which have reported decreases in PAT in HIV-1-infected individuals receiving other ARVs. 19,20,22 Although some studies have demonstrated an association between lipoatrophy and use of specific PIs or NRTIs, 19,22 others have shown no ARV-specific effects, 20 and it has been observed that HIV-1-infected subjects, in general, have lower levels of PAT compared with uninfected control subjects. 57 The increase in PAT in the DRV/r arm of this study, which had more advanced disease at baseline compared with the ATV/r arm, can be considered as potentially favorable; however, the small sample size and short duration of this trial limit clinical interpretation of these data.
In this study, despite slight increases in VAT and SAT, subjects' perceptions of their body changes generally improved or remained constant over time. The results from the ABCD questionnaire are in line with those from a previous study, which demonstrated improvements in ABCD scores over 48 weeks of DRV/r-based therapy. 30 In both treatment arms, the question “In the past 4 weeks has your belt or waist size increased?” had the greatest increase in subjects answering “yes” at 48 weeks compared with baseline; this result is consistent with the increases in VAT and SAT seen during the trial. Although changes in adipose tissue distribution over the study period were similar between arms, more DRV/r subjects reported increases in waist and chest size compared with ATV/r subjects. This discrepancy may indicate subtle differences in lipodystrophy and lipoatrophy between the two treatment regimens, or may have been partially due to the differences in racial distribution between the two study arms.
Both regimens had favorable safety profiles, with low incidences of AEs and laboratory abnormalities; the increased incidence of grade 2–4 hyperbilirubinemia or grade 2–4 increased total bilirubin in the ATV/r arm was expected, as they are known side effects of ATV/r-based therapy. 34,58 Similar to the results obtained here, safety results from ARTEMIS suggested low rates of grade 2–4 AEs, including gastrointestinal and renal AEs, in subjects receiving DRV/r over 96 weeks. 39 Subjects receiving DRV/r in ARTEMIS had a significantly lower rate of diarrhea compared with LPV/r subjects (4% vs. 11%, respectively) and, in line with results from this trial, no clinically relevant changes were seen in creatinine clearance in either treatment arm.
Interpretation of the data reported in this pilot study may be limited by the small sample size, as well as the fact that the trial was not powered to test for statistical significance, but was rather intended to be an exploratory analysis. The variation seen between arms in certain baseline characteristics, despite the randomized study design, is likely related to the small sample size. Somewhat larger changes in TC and apoA1 with DRV/r versus ATV/r, particularly at week 12, are likely due to lower baseline values of these parameters in the DRV/r arm. Likewise, the larger reduction in TNF RII is likely due to the higher baseline value in the DRV/r arm. Additionally, it should be noted that subjects with abnormal lipid or glucose levels were excluded from the trial and may not, therefore, be reflective of the overall HIV-1-infected population. Despite these limitations, the equally favorable metabolic profile observed with DRV/r-based therapy when compared with ATV/r-based therapy warrants further investigation. It is noteworthy that the ACTG is conducting a large study of approximately 1800 treatment-naive, HIV-1-infected subjects receiving DRV/r, ATV/r, or raltegravir (all receiving fixed-dose FTC/TDF in the background regimen); end points from this study include changes in metabolic parameters over 144 weeks (clinicaltrials.gov identifier: NCT00811954). This study is statistically powered to definitively evaluate whether DRV/r-based therapy and ATV/r-based therapy are characterized by similarly favorable metabolic profiles.
Footnotes
Acknowledgments
The authors would like to thank the subjects and their families, the study sites, and the principal investigators for their participation in the trial. The authors would like to acknowledge Gilead for supplying emtricitabine, tenofovir, and emtricitabine/tenofovir. The authors would additionally like to acknowledge internal study support staff, as well as Cali Howitt, PhD, Medicus International New York, for her editorial assistance. Funding for the study and for editorial support was provided by Janssen Therapeutics.
Original Presentations of These Data
Aberg J, et al.: METABOLIK (Metabolic Evaluation in Treatment-naïves Assessing the impact of two BOosted protease inhibitors on LIpids and other marKers): Comparison of the Metabolic Effects of Darunavir/Ritonavir versus Atazanavir/Ritonavir over 12 Weeks. XVIII International AIDS Conference (IAC), Vienna, Austria, July 18–23, 2010. Poster WEPE011.
Overton T, et al.: METABOLIK: Week 48 Comparison of Metabolic Parameters and Biomarkers in Subjects Receiving Darunavir/Ritonavir or Atazanavir/Ritonavir. Presented at the 10th International Congress on Drug Therapy and HIV Infection (HIV10), Glasgow, UK, November 7–11, 2010. Poster P74
Tebas P, et al.: METABOLIK (Metabolic Evaluation in Treatment-naïves Assessing the impact of two BOosted protease inhibitors on LIpids and other marKers): Week 48 Comparison of Body Fat Changes in ARV-Naïve Subjects Receiving Darunavir/Ritonavir- or Atazanavir/Ritonavir-Based Therapy. Presented at the 12th International Workshop on Adverse Drug Reactions and Co-morbidities in HIV (ADRL), London, UK, November 4–6, 2010. Poster P07.
Author Disclosure Statement
J.A.A. has served as a scientific advisor to Abbott Laboratories, Bristol-Myers Squibb, Gilead Sciences, Inc., GlaxoSmithKline, Merck & Co, Inc., Pfizer Inc., Theratechnologies Inc., Janssen Therapeutics, and ViiV Healthcare and has received research support from Gilead Sciences, Inc., GlaxoSmithKline, Merck & Co, Inc., Pfizer Inc., Schering-Plough Corp, Theratechnologies Inc., Janssen Therapeutics, Virco Lab, Inc., and Wyeth. P.T. has received grant support from Bristol-Myers Squibb, Gilead Sciences, Inc., GlaxoSmithKline, Inovio Pharmaceuticals, Inc., Merck & Co, Inc., Janssen Therapeutics, and VIRxSYS. E.T.O. has served as a consultant, on a speakers bureau or on an advisory board for Gilead Sciences, Inc., Bristol-Myers Squibb, GlaxoSmithKline, Janssen, Merck & Co., Inc., Monogram Sciences, and Boehringer Ingelheim and has received research support from Abbott Laboratories, Gilead Sciences, Inc., Bavarian Nordic, GlaxoSmithKline, Boehringer Ingelheim, and Janssen. S.K.G. has received grant/research support from Janssen Therapeutics, Merck & Co., Inc., and Gilead Sciences, Inc. and is the site Principal Investigator on trials sponsored by TaiMed, Pfizer Inc., and GlaxoSmithKline. P.E.S. has served as a consultant for Abbott Laboratories, Bristol-Myers Squibb, Gilead Sciences, Inc., GlaxoSmithKline, Merck & Co, Inc., and Janssen Therapeutics and has received grant support from Gilead Sciences, Inc., GlaxoSmithKline, Merck & Co, Inc., and Janssen Therapeutics. A.L. has served as a scientific advisor to Merck, Pfizer, and Tobira and has received research support from Merck & Co., Inc., Abbott Laboratories, and Janssen Therapeutics. R.F. is an employee of Janssen Therapeutics and a Johnson & Johnson stockholder. R.R. is an employee of Janssen R&D and is a Johnson & Johnson stockholder. G.D.L.R. is an employee of Janssen Global Services and is a Johnson & Johnson stockholder.