




Abstract
Atazanavir is a first-line HIV protease inhibitor commonly co-dosed with ritonavir. Ritonavir inhibits atazanavir metabolism, decreasing variability and increasing plasma concentrations. However, ritonavir use results in higher costs and increased drug-related adverse events. Elucidating atazanavir pharmacokinetics might allow for individualized ritonavir boosting. We previously demonstrated that genetically determined CYP3A5 nonexpression was associated with slower atazanavir clearance CL/F and higher trough concentrations. This effect was prominent in non-African-American men but absent in African-Americans. The present study considers additional genetic predictors of atazanavir CL/F with a focus on race differences. Nine polymorphisms in CYP3A4, ABCG2, NR1I2 (PXR), and SLCO1B1 were evaluated; 330 plasma samples from 30 HIV-negative volunteers, balanced by sex, race, and CYP3A5 expressor status, were available. Analyses were performed using nonlinear mixed-effects modeling (NONMEM). The following factors were univariately associated with atazanavir CL/F (% effect) : African-American race (decreased 35%), female sex (decreased 25%), older age (decreased 1.7%/year), CYP3A5 nonexpressors (decreased 26%), ABCB1 CGC haplotype carriers (1236C/2677G/3435C) (decreased 33%), and CYP3A4*1B carriers (decreased 31%). However, an independent genetic explanation for the differential race effect could not be identified. An interaction was observed with PXR 63396 C>T and CYP3A5 expressor status (p=0.0002). CYP3A5 nonexpressors with a PXR 63396 CC genotype had 37% slower CL/F versus those with CT or TT genotypes. For CYP3A5 expressors, those with a PXR 63396 CC genotype had 63% faster CL/F versus those with CT or TT genotypes. Although this study has as its main limitation a small overall sample size, these results nonetheless provide new leads and impetus to evaluate ways to individualize the need for ritonavir boosting using demographic and genetic predictors of atazanavir pharmacokinetics.
Introduction
A
Several potential sources of pharmacokinetic variability have been described for atazanavir. Among these, genetic variation in the drug efflux transporter, ABCB1 (P-glycoprotein), and the metabolic enzyme transcription factor Pregnane X Receptor (PXR, NR1I2) were shown to correlate with atazanavir concentrations in vivo. 6 –8 We previously showed that genetically determined CYP3A5 expression and noncarriers of the ABCB1 CGC haplotype (1236C/2677G/3435C) were associated with faster atazanavir clearance and lower C min. 9 This effect was prominent in non-African-American men, but was not present in African-Americans. The present study builds upon this previous study using the same dataset, but now including additional pharmacogenetic information. The objective was to develop a population pharmacokinetic model that incorporates genetic and clinical factors, and to further evaluate this racial difference in CYP3A5 expressor status effect. The additional genes include CYP3A4*1B, ABCG2, NR1I2 (PXR), and SLCO1B1. Table 1 describes the genotypes evaluated and the rationale for the selected genes and polymorphisms. 8 –18
Materials and Methods
Study population
This study builds upon the analysis reported by Anderson et al. 9 Briefly, the study was an open-label, parallel group, observational pharmacokinetic study. HIV-negative volunteers were enrolled balanced by genetically determined CYP3A5 expression, African-American versus non-African-American race, and sex. Volunteers were given a 7 day supply of atazanavir and were instructed to take 400 mg (two 200 mg capsules) by mouth each morning with breakfast. On day 3 a morning trough was collected. On day 7, a 24 h pharmacokinetic study was conducted following a standardized breakfast (500 kcal; 40% fat; 15% protein; 45% carbohydrates). Five milliliters of blood was collected at baseline and 0.5, 1, 2, 3, 5, 8, 12, 18, and 24 h after observed dosing. The subjects then began atazanavir/ritonavir (300 mg/100 mg) and the same pharmacokinetic assessment was repeated after 7 days of this regimen. However, the CYP3A5 expressor effect was not observed when atazanavir was codosed with ritonavir; therefore this part of the assessment was not included in the present study. 9 The protocol was approved by the institutional review board. Thirty of the original 31 participants signed an addendum consent for the study of additional genetic determinants of atazanavir pharmacokinetics and pharmacodynamics. The revised dataset therefore consisted of 30 volunteers (14 men and 16 women), of whom 14 were CYP3A5 expressors (7 men) and 16 were CYP3A5 nonexpressors (7 men).
Model-based pharmacokinetic analysis
The population pharmacokinetic analysis was performed using first-order conditional estimation (FOCE) with interaction in the NONMEM program 19 (version 7.2, Icon Inc.). This program employed a nonlinear mixed effects regression to estimate population pharmacokinetic parameters. To obtain the pharmacokinetic structural model, the NONMEM analysis subroutines ADVAN 2, TRANS 2, ADVAN 4, and TRANS 4 were utilized for the one- and two-compartment models, respectively. Intersubject as well as residual variability were characterized by a proportional error model. Statistical and graphic methods were used to select the Base Model (pharmacokinetic structural model with no covariates), including Akaike information criterion (AIC), plots of observed versus predicted concentrations over time, and the plot of weighted residuals versus predicted concentrations over time. The COVARIANCE step in NONMEM was incorporated for the calculation of (asymptotic) standard errors. Bootstrapped medians and 95% confidence intervals are reported for model coefficients.
Model selection
Once the overall population Base Model was selected, potential covariates were considered individually. Subset analyses, which stratified by CYP3A5 expressor status (i.e., expressor versus nonexpressor), and graphic analyses were used as an exploratory method to identify potential interactions with CYP3A5. Continuous covariates, age and weight, were median centered for numerical stability. For dichotomous predictors, wild-type homozygotes (zero variant alleles), males, and non-African-Americans were coded to be the reference groups. Because of the small sample size, variant allele carriers were combined into one group (heterozygotes and homozygous variants) unless graphic analyses suggested better ways to combine groups. The analyses for SLCO1B1 genotypes focused on 521T>C. Diagnostic plots were evaluated and the decrease in the objective function value (ΔOFV), which asymptotically approximates a chi-square distribution under regularity conditions, was used to determine significance.
Results
Base model
Table 2 provides a breakdown of demographic and genetic characteristics by race and CYP3A5 expression status. Eleven concentrations were available for each of the 30 subjects providing 330 observations. A two-compartment model was an improvement over a one-compartment model based on a decrease of 54.7 in AIC. The pharmacokinetic parameters used to characterize the two-compartment Base Model were clearance (CL/F), an intersubject variability (ISV) value on CL/F, central compartment volume (V2/F), peripheral compartment volume (V3/F), intercompartmental clearance (Q/F), and first-order absorption rate (K a). The introduction of a lag time significantly improved model fit (ΔOFV=339.3, p<0.0001), as did the addition of an ISV value on V3/F (ΔOFV=15.1, p=0.0001). Assigning an ISV value to V2/F did not significantly improve the description of the data (ΔOFV=0.17, p=0.68).
BMI, body mass index; HET, heterozygous.
The final pharmacokinetic estimates of the overall population Base Model without covariates were a CL/F of 16.7 liters/h (95% CI: 14.3 19.1), an ISV on CL/F of 0.146 (% CV: 38), a V2/F of 32.2 liters (95% CI: 2.6, 61.8), a V3/F of 69.3 liters (95% CI: 47.9, 90.7), an ISV on V3/F of 0.216 (% CV: 46), a Q/F of 7.29 liters/h (95% CI: 4.55, 10.0), a K a of 0.394 h–1 (95% CI: 0.147, 0.641), and an LAG of 1.15 h (95% CI: 1.14, 1.18).
Univariate and bivariate analyses
Once the Base Model was defined, the individual influence of each covariate on atazanavir CL/F was tested (Table 3). The subject demographics significantly associated with atazanavir CL/F (α=0.05, ΔOFV≥3.84) were sex (decreased 25% in women; p=0.039), African-American versus non-African-American race (decreased 35% in African-Americans; p=0.0011), and age (decreased 1.7% per year over age 30; p=0.0095; although the corresponding bootstrapped confidence interval includes zero). The influence of weight did not significantly improve the model fit when tested individually on CL/F (p=0.15), V2/F (p=0.96), and V3/F (p=0.12). Genotypes that were significantly associated with atazanavir CL/F were CYP3A5 (decreased 26% in nonexpressors; p=0.034), ABCB1 (decreased 33% in those with one or more copies of the CGC haplotype; p=0.039), and CYP3A4 (decreased 31% in CYP3A4*1B variant carriers; p=0.0074). Adjusting for CYP3A5 expression status in bivariate analyses did not attenuate the significant effect of race (p=0.0004), CYP3A4*1B genotype (p=0.0005), or ABCB1 haplotype (p=0.01) on atazanavir CL/F (Table 4).
The 2.5th and 97.5th percentiles of 1000 bootstrap distribution of parameter estimates.
CL/F, clearance; CI, confidence interval.
The 2.5th and 97.5th percentiles of 1000 bootstrap distribution of parameter estimates.
CL/F, clearance; CI, confidence interval.
Models with CYP3A5 interaction terms
A primary goal of this study was to identify genetic factors that contribute to race differences in CYP3A5 expressor effects.
9
A preliminary analysis split data by CYP3A5 expressor status and a Base Model was determined for each strata. For each CYP3A5 strata, predictors were then considered individually. A visual inspection of the CL/F estimates by CYP3A5 subgroup highlighted possible interactions of interest and possible collinearity between CYP3A5 and individual covariates (Fig. 1). Covariates that appeared to exhibit a possible interaction with CYP3A5 were sex, race, CYP3A4*1B, PXR 63396 C>T, PXR 44477 T>C, and ABCG2 34G>A. Models incorporating an interaction with sex, race, CYP3A4*1B, and PXR 63396 C>T were examined (Table 4), but the final two genotypes (PXR 44477 T>C and ABCG2 34G>A) contained a subgroup with only a single subject, therefore these higher level models were not considered. Additionally, race by CYP3A5 expressor status appeared nearly collinear with ABCB1 and CYP3A4*1B (Fig. 1), which prevented an analysis of race-independent effects of ABCB1 and CYP3A4*1B. The interaction between CYP3A5 expressor status and PXR 63396 C>T was significant (p=0.0002, Table 4), providing CL/F estimates of 10.2 liters/h for CYP3A5 nonexpressor/PXR 63396 CC genotype, 16.3 liters/h for CYP3A5 nonexpressor/PXR 63396 T allele carriers, 24.9 liters/h for CYP3A5 expressors/PXR 63396 CC genotype, and 15.3 liters/h for CYP3A5 expressors/PXR 63396 T allele carriers. Other interactions considered with CYP3A5 failed to reach statistical significance (ΔOFV<2.42 corresponding to p>0.12, Table 4). These interactions are described in detail in the supplementary material, as are associations observed among covariates; (Supplementary Table S1; Supplementary Data available online at
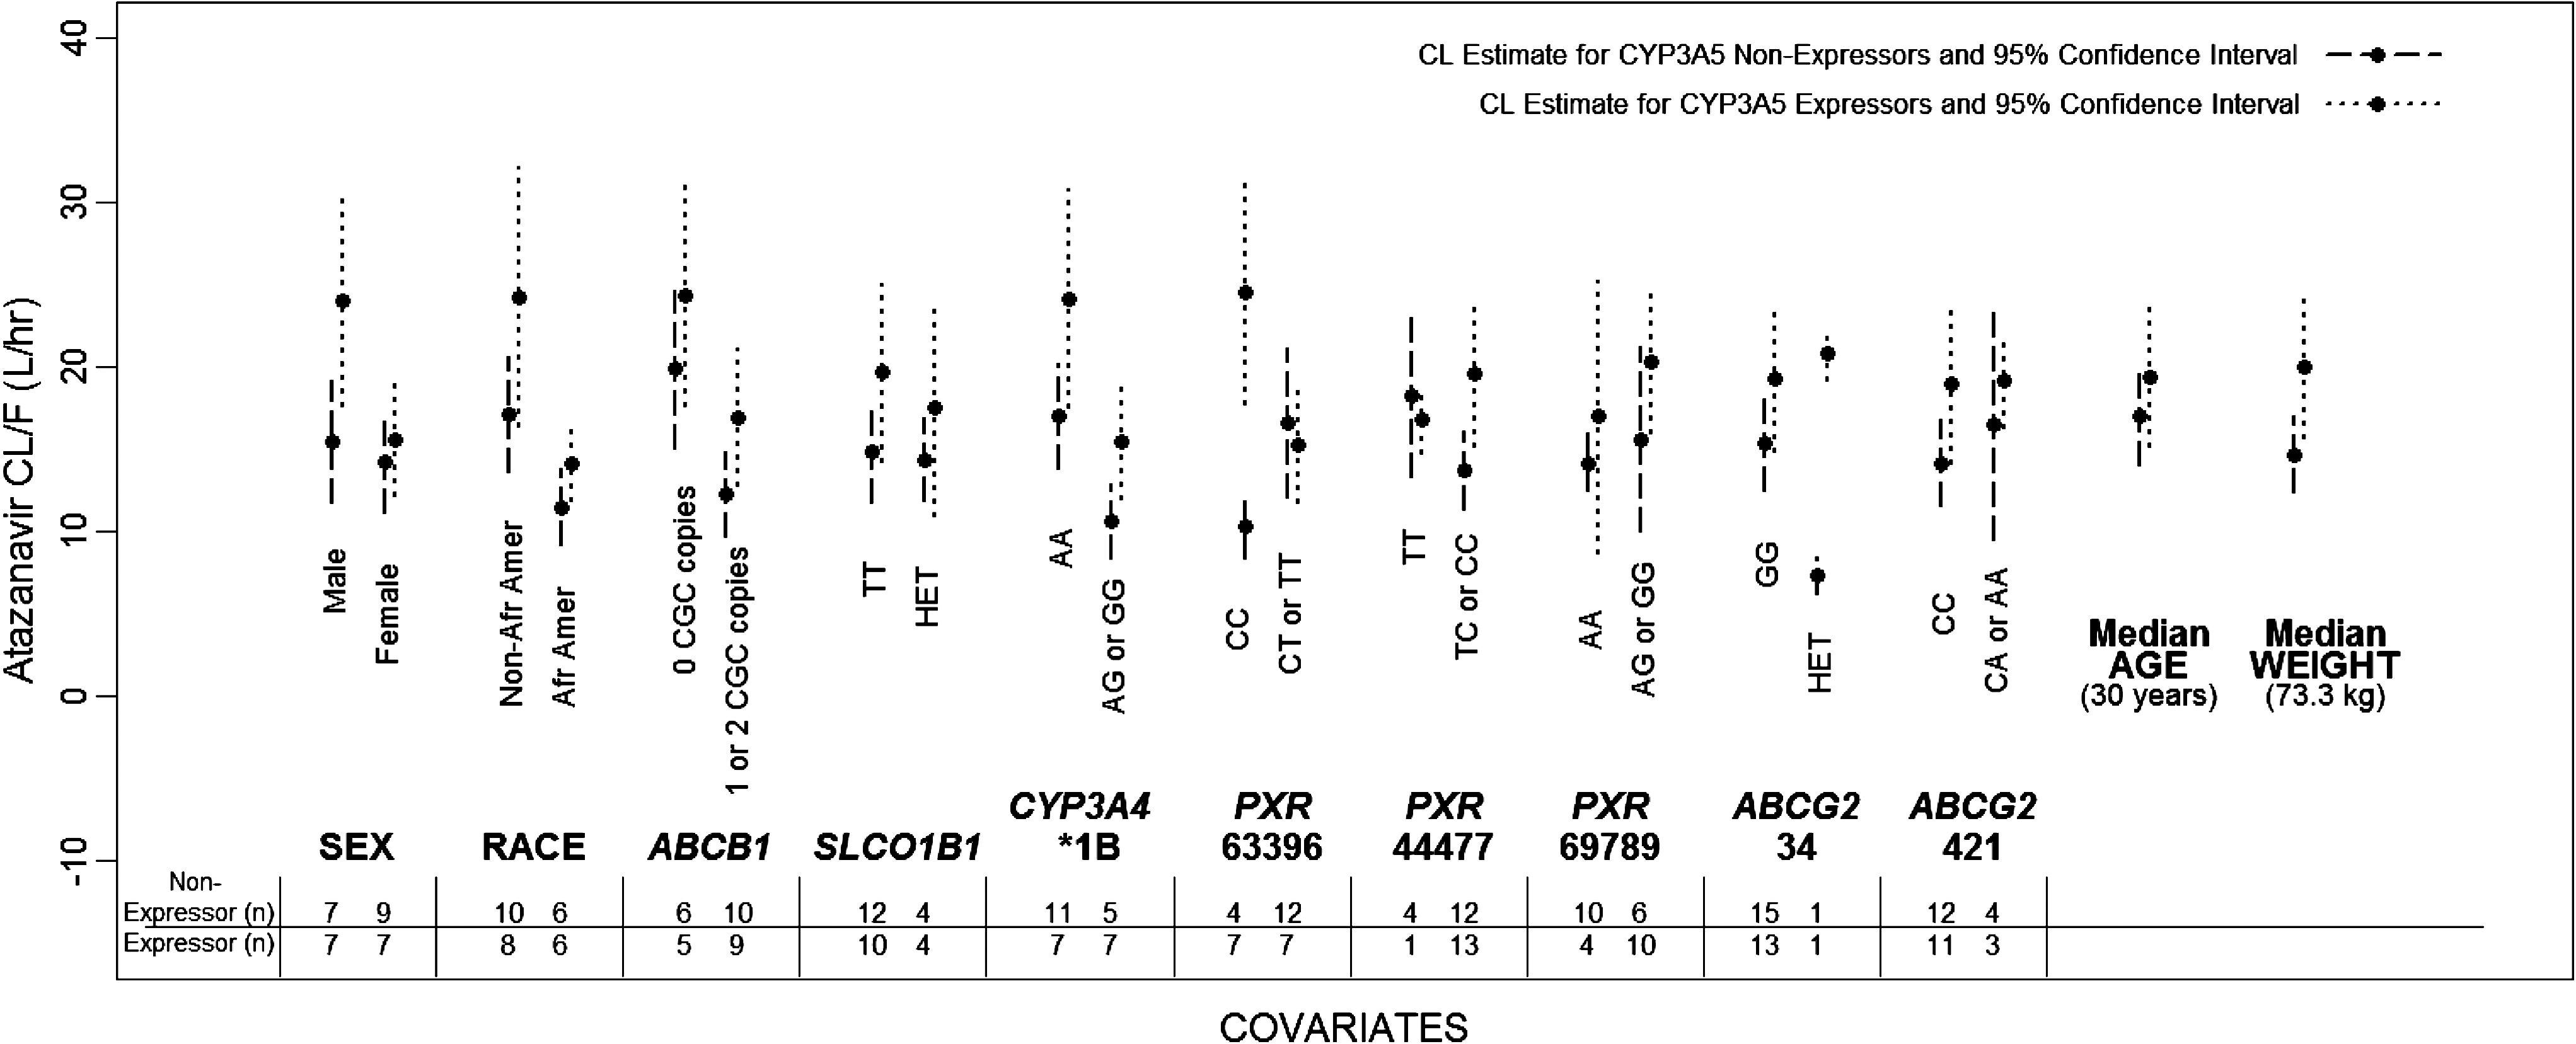
Comparison of atazanavir clearance estimates for CYP3A5 expressors versus nonexpressors.
Exploratory models
A number of exploratory models were fit to evaluate combinations of covariates of interest. Combinations were decided a priori and were designed to probe for genetic correlates of the different CYP3A5 effects according to sex and African-American versus non-African-American race. Given the exploratory nature of this analysis, the threshold was relaxed to a significance level of 0.20 (corresponding to a ΔOFV of ≥1.64) to generate hypotheses for future studies. Nevertheless, covariates were significant at p<0.05. Given the small sample size, only three covariates were considered in each model. These models used pharmacokinetic parameter estimates obtained from the overall population Base Model as initial estimates. If the addition of a single covariate to the Base Model caused a decrease in OFV of greater than 1.64, then the initial covariate remained in the model, a second covariate was added, and change in OFV was evaluated. This step was repeated for the addition of a third covariate, resulting in the estimation of 12 parameters (nine fixed effects and three random effects). If the addition of a single covariate did not contribute significantly to model fit as reflected by change in OFV then the investigation into that particular set of three covariates was discontinued. In four of the exploratory models, each of which contained CYP3A5 and sex as the first and second fitted covariates, the addition of the third predictor race, age, CYP3A4*1B, and ABCB1 each significantly improved model fit, resulting in an overall change in OFV of 5.7 to 13.8 and reducing intersubject variability on CL/F 8% to 13%. Model estimates (Supplementary Tables S2) and goodness of fit plots (Supplementary Figs. S1–S4) are provided. In these models, the typical value of CL/F increased with CYP3A5 expression (range 3.07 to 4.96 liters/h) and decreased for women (range −3.94 to −3.10 liters/h). After adjusting for both CYP3A5 and sex, typical values of CL/F were 6.56 liters/h lower for CYP3A4*1B variant carriers, 6.37 liters/h lower for African-Americans, 6.95 liters/h lower for ABCB1 CGC haplotype carriers, and 2.7 liters/h lower for every 10 year increase in age over 30 years.
Discussion
This population pharmacokinetic study built upon a previously published comparison of atazanavir pharmacokinetics according to genetically determined CYP3A5 expression. 9 The previous study showed that genetically determined CYP3A5 expression had faster atazanavir clearance and lower C min but the effect was reduced in African-Americans. We followed up the previous study with a metabolite study that showed similar atazanavir metabolite patterns in African-American and non-African-American CYP3A5 expressors. 3 This suggested that CYP3A5 expressor status had an effect on atazanavir metabolism in both African-Americans and non-African-Americans, therefore some other biological/genetic difference likely underlies the previous findings. The present study evaluated CYP3A4*1B, ABCG2 (421C>A, and 34G>A), PXR (63396C>T, 44477T>C, 69789A>G), and SLCO1B1 (−11187G>A, 521T>C, 388A>G) as additional predictors of atazanavir pharmacokinetics. A population pharmacokinetic approach was used, which showed that African-American race (decreased 35%), female sex (decreased 25%), older age (decreased 1.7%/year over 30 years), and CYP3A4*1B carriers (decreased 31%) were all univariately associated with reduced atazanavir CL/F. CYP3A5 nonexpressors (decreased 26%) and ABCB1 CGC haplotype carriers (1236C/2677G/3435C) (decreased 33%) were confirmed from the previous study to be associated with atazanavir pharmacokinetics with the NONMEM model in this study. Unfortunately, the present study could not conclusively identify a genetic predictor that independently explained the race differences by CYP3A5 expression status observed in the previous study. This was likely because of the small numbers of African-Americans (n=6) and non-African-Americans (n=8), and because the additional genotypes were not evenly distributed between the races. For example, CYP3A4*1B variant carriers were almost all African-American (Table 2), similar to other studies. 20
This study identified an interaction with PXR 63396 C>T and CYP3A5 expressor status. CYP3A5 nonexpressors with the PXR 63396 CC genotype had 37% slower CL/F versus those with the CT or TT genotypes, but for CYP3A5 expressors, those with the PXR 63396 CC genotype had 63% faster CL/F versus those with CT or TT genotypes. The finding in CYP3A5 nonexpressors (slower CL/F for the PXR 63396 CC genotype) is consistent with other studies that included mainly whites, of whom 50–90% would be expected to be CYP3A5 nonexpressors based on allele frequency. 8,21 The PXR 63396 C>T genotype frequency was not significantly different between African-Americans (n=5 for the PXR 63396 CC genotype and n=7 for the PXR 63396 CT or TT genotypes) and non-African-Americans (n=6 for the PXR 63396 CC genotype and n=12 for the PXR 63396 CT or TT genotypes, p=0.71, Fisher's exact test), but among non-African-Americans CYP3A5 nonexpressors were more likely to be PXR 63396 T allele carriers (n=1 for the PXR 63396 CC genotype and n=9 for the PXR 63396 T allele carriers in CYP3A5 nonexpressors, and n=5 for the PXR 63396 CC genotype and n=3 for the PXR 63396 T allele carriers in CYP3A5 expressors, p=0.04, Fisher's exact test). A three-way interaction model between race, CYP3A5 expressor status and PXR 63396 C>T was not investigated due to the small sample sizes within the non-African-American group with the PXR 63396 CC genotype who were CYP3A5 nonexpressors (n=1) and the African-American group with the PXR 63396 CC genotype who were CYP3A5 expressors (n=2).
This study found that women had 25% slower atazanavir CL/F. Similar sex findings have been reported for atazanavir in HIV-negative volunteers and for other HIV protease inhibitors. 22 The present results were not explained by body weight, which was not a significant predictor in the NONMEM model. Additionally, the original study used body weight corrected atazanavir CL/F and still reported the same sex effect. 9 The effect of sex on CYP3A metabolized drugs has been reported to vary by drug, but the preponderance of data suggest that women have faster weight-adjusted CL/F compared with men for CYP3A substrates. 23 The mechanism for slower CL/F in women for HIV protease inhibitors merits additional study.
A 17% decline in atazanavir CL/F was predicted for every 10 years above age 30. Previously, the effect of older age on a single dose of atazanavir was evaluated in HIV-negative adults >65 year olds compared with 19–40 year olds. The C max and AUC were ∼17% higher in older adults (90% CI −5% to 45%), but this was deemed clinically unimportant. 24 Median centered age and log transformed age were each modeled during the univariate analysis. Log transforming age resulted in a less stable model and did not improve model fit over median centered age (AIC: 4082.0 vs. 4048.3, respectively). This is likely due to the narrow age range of the subjects (20 years to 51 years). As the number of older HIV-infected persons rapidly grows, it will be important to determine the effect of older age on antiretroviral drug pharmacokinetics. This is because a predictable consequence of aging is declined end-organ efficiency, slowed drug elimination, and elevated drug exposures with one-size-fits-all dosing.
The present study did not identify an association between SLCO1B1 polymorphisms (−11187G>A, 521T>C, 388A>G) with atazanavir pharmacokinetics. The study focused on the 521T>C polymorphism, as this SNP was associated with lopinavir pharmacokinetics (in combination with ritonavir) in a previous study. 16 Additional research with larger cohorts is required to verify whether SLCO1B1 polymorphisms or polymorphisms in other drug-metabolizing enzymes or drug transporters are associated with atazanavir pharmacokinetics.
Subjects with one or two copies of the wild-type CGC haplotype (1236C/2677G/3435C) had slower atazanavir CL/F. 9 As discussed in the original study, lower function for the wild-type carriers is consistent with in vitro data, and previous studies that found higher atazanavir concentrations in subjects with the C/C genotype at 3435 versus those carrying the T variant at this position. 6,9 However, more study is needed to elucidate a consistent pharmacologic profile for HIV protease inhibitors as it relates to p-glycoprotein genetics in vivo.
The population pharmacokinetic model used in this study underwent significant evolution to arrive at the final models. This study found that a two-compartment model provided a better fit to the data compared with a one-compartment model, which has been used more often in atazanavir population pharmacokinetic studies. 8,25 This is likely because of the intensive sampling in the present study (11 concentrations per subject). The CL/F value in this study (16.7 liters/h) was comparable to that of the other studies (19.7 liters/h and 12.9 liters/h). 8,25 During the univariate inclusion process, both additive and multiplicative covariate inclusion models were tested. The additive models tended to have less convergence issues than those for which the covariates were included multiplicatively. Additional factors influencing model minimization were choice of initial starting estimates and corresponding boundaries. The choice of initial estimates and bounds for the pharmacokinetic parameter LAG most strongly affected model convergence and plausibility of final parameter values. Placing a tight upper bound on the initial estimate for LAG tended to minimize convergence issues. The final population estimate for LAG in the Base Model was found to be 1.15 h (95% CI: 1.14, 1.18), similar to other studies. 8,26 Throughout most model building, the initial estimate for LAG was set at 1.15 h with lower and upper bounds of 0 and 1.2, respectively. Convergence issues were encountered when these LAG parameter bounds were implemented during model building for the CYP3A5 nonexpressor subgroup. Increasing the upper bound on LAG to 2 led to model convergence for this subgroup and a final LAG parameter estimate of 1.53 h (95% CI: 1.13, 1.93). Lower and upper bounds placed on the initial estimates for the central and peripheral compartments for volume also aided in model convergence to the appropriate local minimum. In all models discussed, the lower and upper bounds on V2/F were set at 0 and 50, respectively; the lower and upper bounds on V3/F were set at 30 and 200, respectively.
The strengths of the present study were the intensiveness of the controlled pharmacokinetic evaluations in the 30 volunteers and the enrollment balanced on CYP3A5 expressor status, sex, and race. This allowed for adequate estimates of K a and LAG, in addition to CL/F, Q/F, V2/F, and V3/F, and an even distribution of expression levels across strata of interest. This study had as its main limitation a small overall sample size (N=30), which limited the number of covariates that could be tested simultaneously and the ability to test for collinearity. Other possibly important predictors of atazanavir clearance (or bioavailability) were not assessed in this study including protein binding and gastric pH, which are known to be important for optimal dissolution and absorption for atazanavir. 27,28 Additionally, novel findings in HIV-negative persons should be evaluated and confirmed in HIV-infected individuals. Nevertheless, this study identified or confirmed several factors that predicted atazanavir pharmacokinetics including older age, sex, African-American race, CYP3A5 expressor status, CYP3A4*1B, PXR 63396 C>T genotype, and ABCB1 CGC haplotype. Combinations or patterns of these factors may one day predict the need for ritonavir boosting, thereby providing an individualized approach that could lower pill burden, adverse events, and cost.
Footnotes
Acknowledgments
We wish to thank Julie Predhomme, Patrick McDaneld, Lane Bushman, Jia-Hua Zheng, Michelle Ray, Dallas Hill, Elizabeth Connick, Courtney Fletcher, Jason Hindman, Kenny Utz, Catherine Lai, and Richard Brundage for contributions to this project. Funding was through the University of Colorado Denver Skaggs School of Pharmacy and Pharmaceutical Sciences Department of Pharmaceutical Sciences.
Author Disclosure Statement
No competing financial interests exist.
References
Supplementary Material
Please find the following supplemental material available below.
For Open Access articles published under a Creative Commons License, all supplemental material carries the same license as the article it is associated with.
For non-Open Access articles published, all supplemental material carries a non-exclusive license, and permission requests for re-use of supplemental material or any part of supplemental material shall be sent directly to the copyright owner as specified in the copyright notice associated with the article.
