




Abstract
Tenofovir (TFV) disoproxil fumarate (TDF)±emtricitabine (FTC) are widely used for HIV treatment and chemoprophylaxis, but variable adherence may lead to suboptimal responses. Methods that quantify adherence would allow for interventions to improve treatment and prevention outcomes. Our objective was to characterize the pharmacokinetics of TFV-diphosphate (TFV-DP) and FTC-triphosphate (FTC-TP) in red blood cells (RBCs) and peripheral blood mononuclear cells (PBMCs); to extend the RBC analysis to dried blood spots (DBSs); and to model how RBC/DBS monitoring could inform recent and cumulative drug exposure/adherence. Blood samples were collected from 17 HIV-negative adults at 5 visits over a 30-day pharmacokinetics study of daily oral TDF/FTC. Dosing was discontinued on day 30 and blood was collected on days 35, 45, and 60 during the washout period. Plasma/RBCs/PBMCs/DBSs were all quantified by liquid chromatography/tandem mass spectrometry. DBSs were paired with RBCs and plasma for comparisons. The median (interquartile range) RBC TFV-DP half-life was 17.1 (15.7–20.2) versus 4.2 (3.7–5.2) days in PBMCs. At steady state, TFV-DP was 130 fmol/106 RBCs versus 98 fmol/106 PBMCs. FTC-TP was not quantifiable in most RBC samples. TFV-DP in RBCs versus DBSs yielded an r2 =0.83. TFV-DP in DBSs was stable at −20°C. Simulations of TFV-DP in RBCs/DBSs, when dosed from one to seven times per week, demonstrated that each dose per week resulted in an average change of approximately 19 fmol/106 RBCs and 230 fmol/punch. TFV and FTC in plasma versus DBSs was defined by y=1.4x; r2 =0.96 and y=0.8x; r2 =0.99, respectively. We conclude that DBSs offer a convenient measure of recent (TFV/FTC) and cumulative (TFV-DP in RBCs) drug exposure with potential application to adherence monitoring.
Introduction
S
Tenofovir (TFV) and emtricitabine (FTC) are nucleos(t)ide reverse transcriptase inhibitors (NRTIs) broadly used in the treatment and prevention of HIV infection. As nucleoside analogs, these drugs are phosphorylated in cells to TFV-diphosphate (TFV-DP) and FTC-triphosphate (FTC-TP). TFV-DP and FTC-TP, which are pharmacologically active, demonstrate longer intracellular half-lives compared with the parent drug in plasma and may exhibit different pharmacokinetic characteristics according to specific cell types (e.g., red blood cells vs. peripheral blood mononuclear cells). 8 These differing half-lives could be used to predict recent and long-term drug exposure (adherence). 8,9 TFV-DP was found in a small study to be present in red blood cells (RBCs), but the half-life in RBCs was not elucidated. 9
The potential presence of TFV-DP in RBCs suggests that dried blood spots (DBSs), which contain millions of RBCs, may be a suitable matrix for TFV-DP testing. Dried blood spots, which have been historically used for neonatal screening of inborn errors of metabolism with consistent results, 10 have multiple advantages over traditional blood sampling techniques including simple collection, minimal volume, and easy transportation and storage.
The objective of this study was to characterize the pharmacokinetics of TFV-DP and FTC-TP in RBCs versus PBMCs; to determine the feasibility of measuring TFV-DP, FTC-TP, TFV, and FTC in DBSs; and to model drug exposure in DBSs as a potential tool for quantifying adherence.
Materials and Methods
Blood for plasma, PBMC, RBC, and paired DBS samples was collected from HIV-seronegative volunteers enrolled in an intensive 30-day pharmacokinetic study of daily oral TDF/FTC (NCT0104009;
For DBS testing, 25 μl of blood from EDTA tubes was spotted five times onto 903 Protein Saver Cards (Whatman/GE Healthcare, Piscataway, NJ) (125 μl in total). After spotting, the cards were dried for at least 2 h, and then placed in plastic bags and stored in a sample box with desiccant and humidity indicators at room temperature, 4°C, −20°C, and −80°C to assess the effect of storage conditions on drug levels. Acceptable stability was defined as±15% from the −80°C concentration, on average including at for least half of the samples. For the extraction of analytes from DBS, a 3-mm diameter disk was punched with micropuncher from the blood spot. A punch from a clean Protein Saver Card was performed in between each DBS sample in order to avoid analyte contamination from the DBS punch. Three punches were available from each 25-μl blood spot. One DBS punch was used to extract TFV/FTC parent drugs, and a second punch was used to extract TFV-DP/FTC-TP.
The punched disk for TFV/FTC was placed in a microcentrifuge tube and extracted with 200 μl of 100% methanol and 20 μl of internal standard (isotopic TFV and FTC). Extraction included 10 min of sonication and 2 min of centrifugation. Supernatants were then dried and reconstituted in 100 μl of ultrapure H2O for LC-MS/MS analysis [Thermo Scientific (Waltham, MA) TSQ Vantage triple quadrupole mass spectrometer coupled with a Thermo Scientific Accela UHP pump and CTC Analytics (Zwingen, Switzerland) HTC PAL autosampler]. Standards in DBSs ranged from 2.5 to 1000 ng/ml for TFV and from 2.5 to 5000 ng/ml for FTC. Quality controls (QCs) in DBSs, made independently, were TFV/FTC 2.5/2.5, 5/5, 15/15, 200/400, and 800/4000 ng/ml. Five analytical runs were performed with five sets of QCs in each run. Accuracy and precision based on the QCs met validation criteria. 13
Another 3-mm punch was extracted from the same 25-μl DBS for TFV-DP/FTC-TP. The disk was placed in a microcentrifuge tube with 500 μl of 70:30 methanol–H2O. This constituted a “lysed cell” matrix that was previously validated for PBMCs and RBCs. 12 After a 10-min sonication, the supernatants were stored at −80°C until analysis. The quantifiable linear range for TFV-DP was 2.5–2000 fmol/sample and that for FTC-TP was 0.1–200 pmol/sample (the sample in this case was a 3-mm punch). Stable labeled isotopic internal standards facilitated accuracy and precision in various cell matrices. 12 Paired RBC samples from the same blood draw as the DBS were used to qualify the DBS results. Other variables important to sampling through DBSs (effects of punch location, spot volume, hematocrit, multipunch extraction, and dilution tests) were also evaluated but did not influence the current study, and will therefore be detailed in another publication.
TFV-DP steady state concentration (C ss) in RBCs was determined with a one-compartment first-order model fit to all available concentration data for each participant with ADAPT (version 5). Pharmacokinetic parameters were then used to simulate 1000 subjects in ADAPT to estimate the C ss of TFV-DP in RBCs on day 180. This was required because TFV-DP accumulation was not complete by day 30, when dosing was stopped. Elimination rate constants (k e) in RBCs and PBMCs were determined by fitting a linear regression to the natural log-transformed concentrations over the 30-day washout period; half-life was derived as ln 2/k e. The effect of various nonadherence patterns on intracellular RBC/DBS levels was estimated for 1000 simulated subjects with ADAPT, using the pharmacokinetic estimates from the analyses described above, and the variability from observed day 30 concentrations in RBCs. Patterns included (1) 6/7 doses/week (dose missed at random), (2) 5/7 doses/week (doses missed on the weekend), (3) 4/7 doses/week (doses missed on Wednesday, Saturday, Sunday), (4) 3 doses/week (doses missed Tuesday, Thursday, Saturday, Sunday), (5) 2 doses/week (doses missed Thursday to Monday), and (6) 1 dose/week (doses missed Tuesday to Sunday). Nonadherent dosing patterns were implemented while at steady state (100% adherence at daily dosing) to demonstrate the time course of intracellular concentration changes with each level of nonadherence over the ensuing 6 months.
Results
RBC and PBMC kinetics
Samples from 17 HIV-seronegative individuals were available for analyses. Table 1 shows the demographics of the study participants. FTC-TP concentrations in RBCs were below the lower limit of quantification (LLOQ) in 80% of the samples tested; therefore FTC-TP was not analyzed further. The half-life and day 30 concentrations for TFV-DP in PBMCs and RBCs are shown in Table 2. The half-life of TFV-DP in RBCs was more than 4-fold longer than that in PBMCs, 17.1 versus 4.2 days, respectively. The day 30 concentration in PBMCs was considered at steady state, but steady state was not assumed for RBCs given the 17 day half-life. Therefore, the C ss in RBCs was extrapolated to steady state, yielding an estimate of 130 fmol/106 RBCs. The ratio at steady state between TFV-DP in RBCs (fmol/106 RBCs) versus PBMCs (fmol/106 PBMCs) was 1.3.
TFV-DP in RBCs was quantifiable in all subjects at 30 days, but was below the lower limit of quantification (LLOQ) in PBMCs in 9/17 subjects during the same period.
IQR, interquartile range; SD, standard deviation; PBMCs, peripheral blood mononuclear cells; RBC, red blood cells; TFV-DP, tenofovir diphosphate.
TFV-DP in PBMCs was below the LLOQ of the assay in 9 of 17 subjects 30 days after TDF/FTC discontinuation. In comparison, TFV-DP in RBCs was still quantifiable in all subjects at a level more than 30-fold above the LLOQ (2 to 5 million RBCs per sample), as shown in Fig. 1.
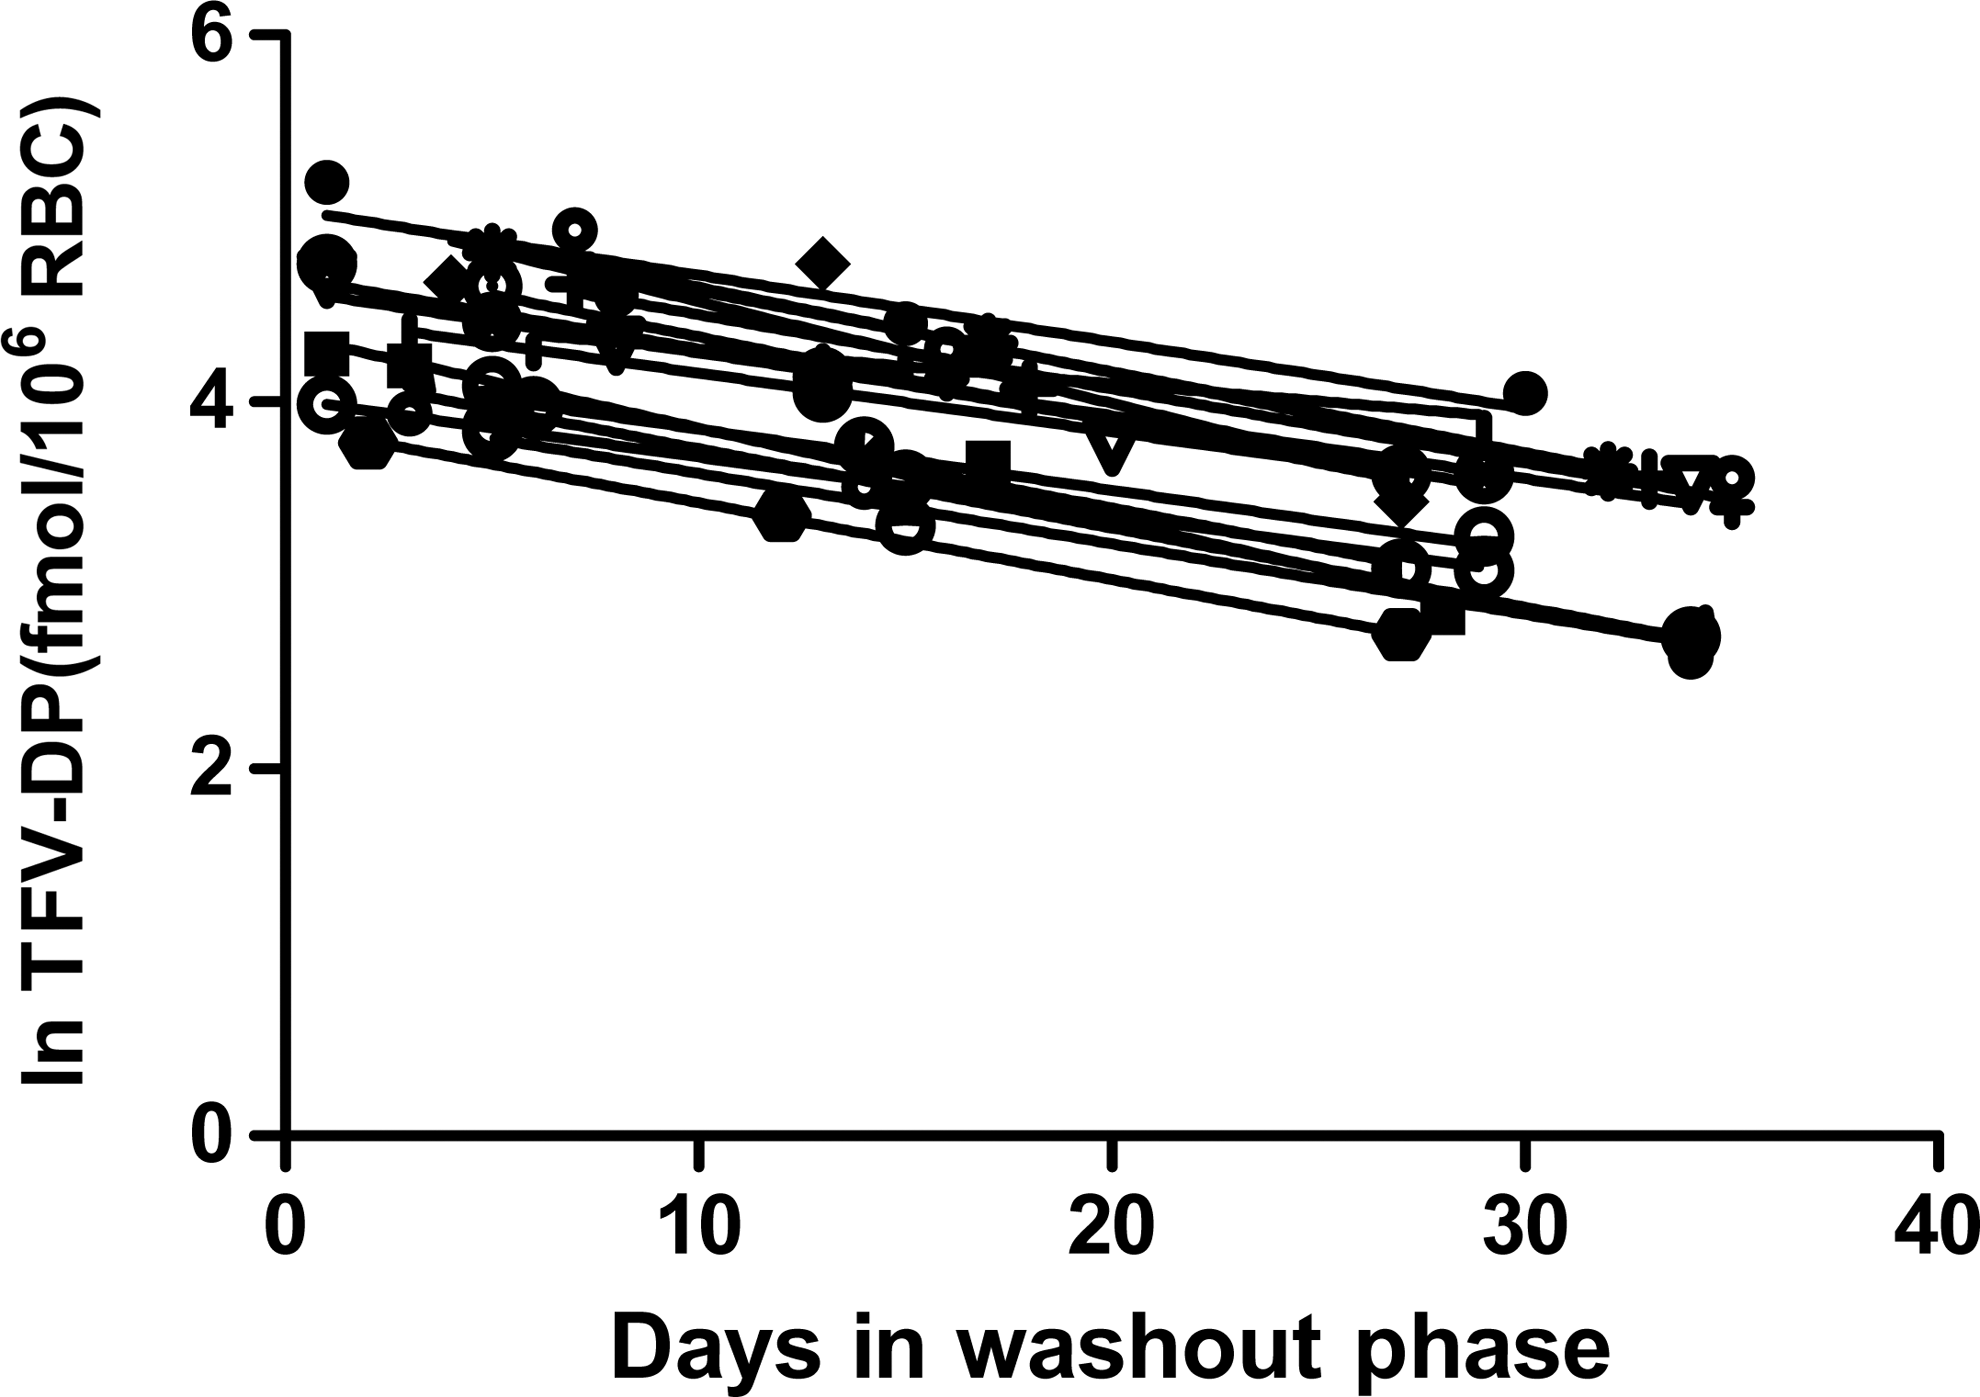
Natural log tenofovir-diphosphate (TFV-DP) concentrations in red blood cells (RBCs) according to days after discontinuation of TDF-FTC from 17 HIV-seronegative participants. Two to five million RBCs were analyzed per sample.
Dried blood spots
TFV and FTC in DBSs
To evaluate TFV/FTC parent drug in plasma versus DBSs, a total of 30 plasma/DBS pairs arising from 3 participants were analyzed. The samples were from the two intensive pharmacokinetic visits, on day 1 (first dose) and day 30 (steady state). Samples from both visits were 1, 2, 4, 8, and 24 h postdose. Figure 2 depicts the relationship between plasma and DBS TFV and FTC. The DBSs provided simple regression equations to estimate plasma concentrations and demonstrated r 2 ≥0.96. The hematocrit range validated was 35–63%, which encompasses the range of the participants.
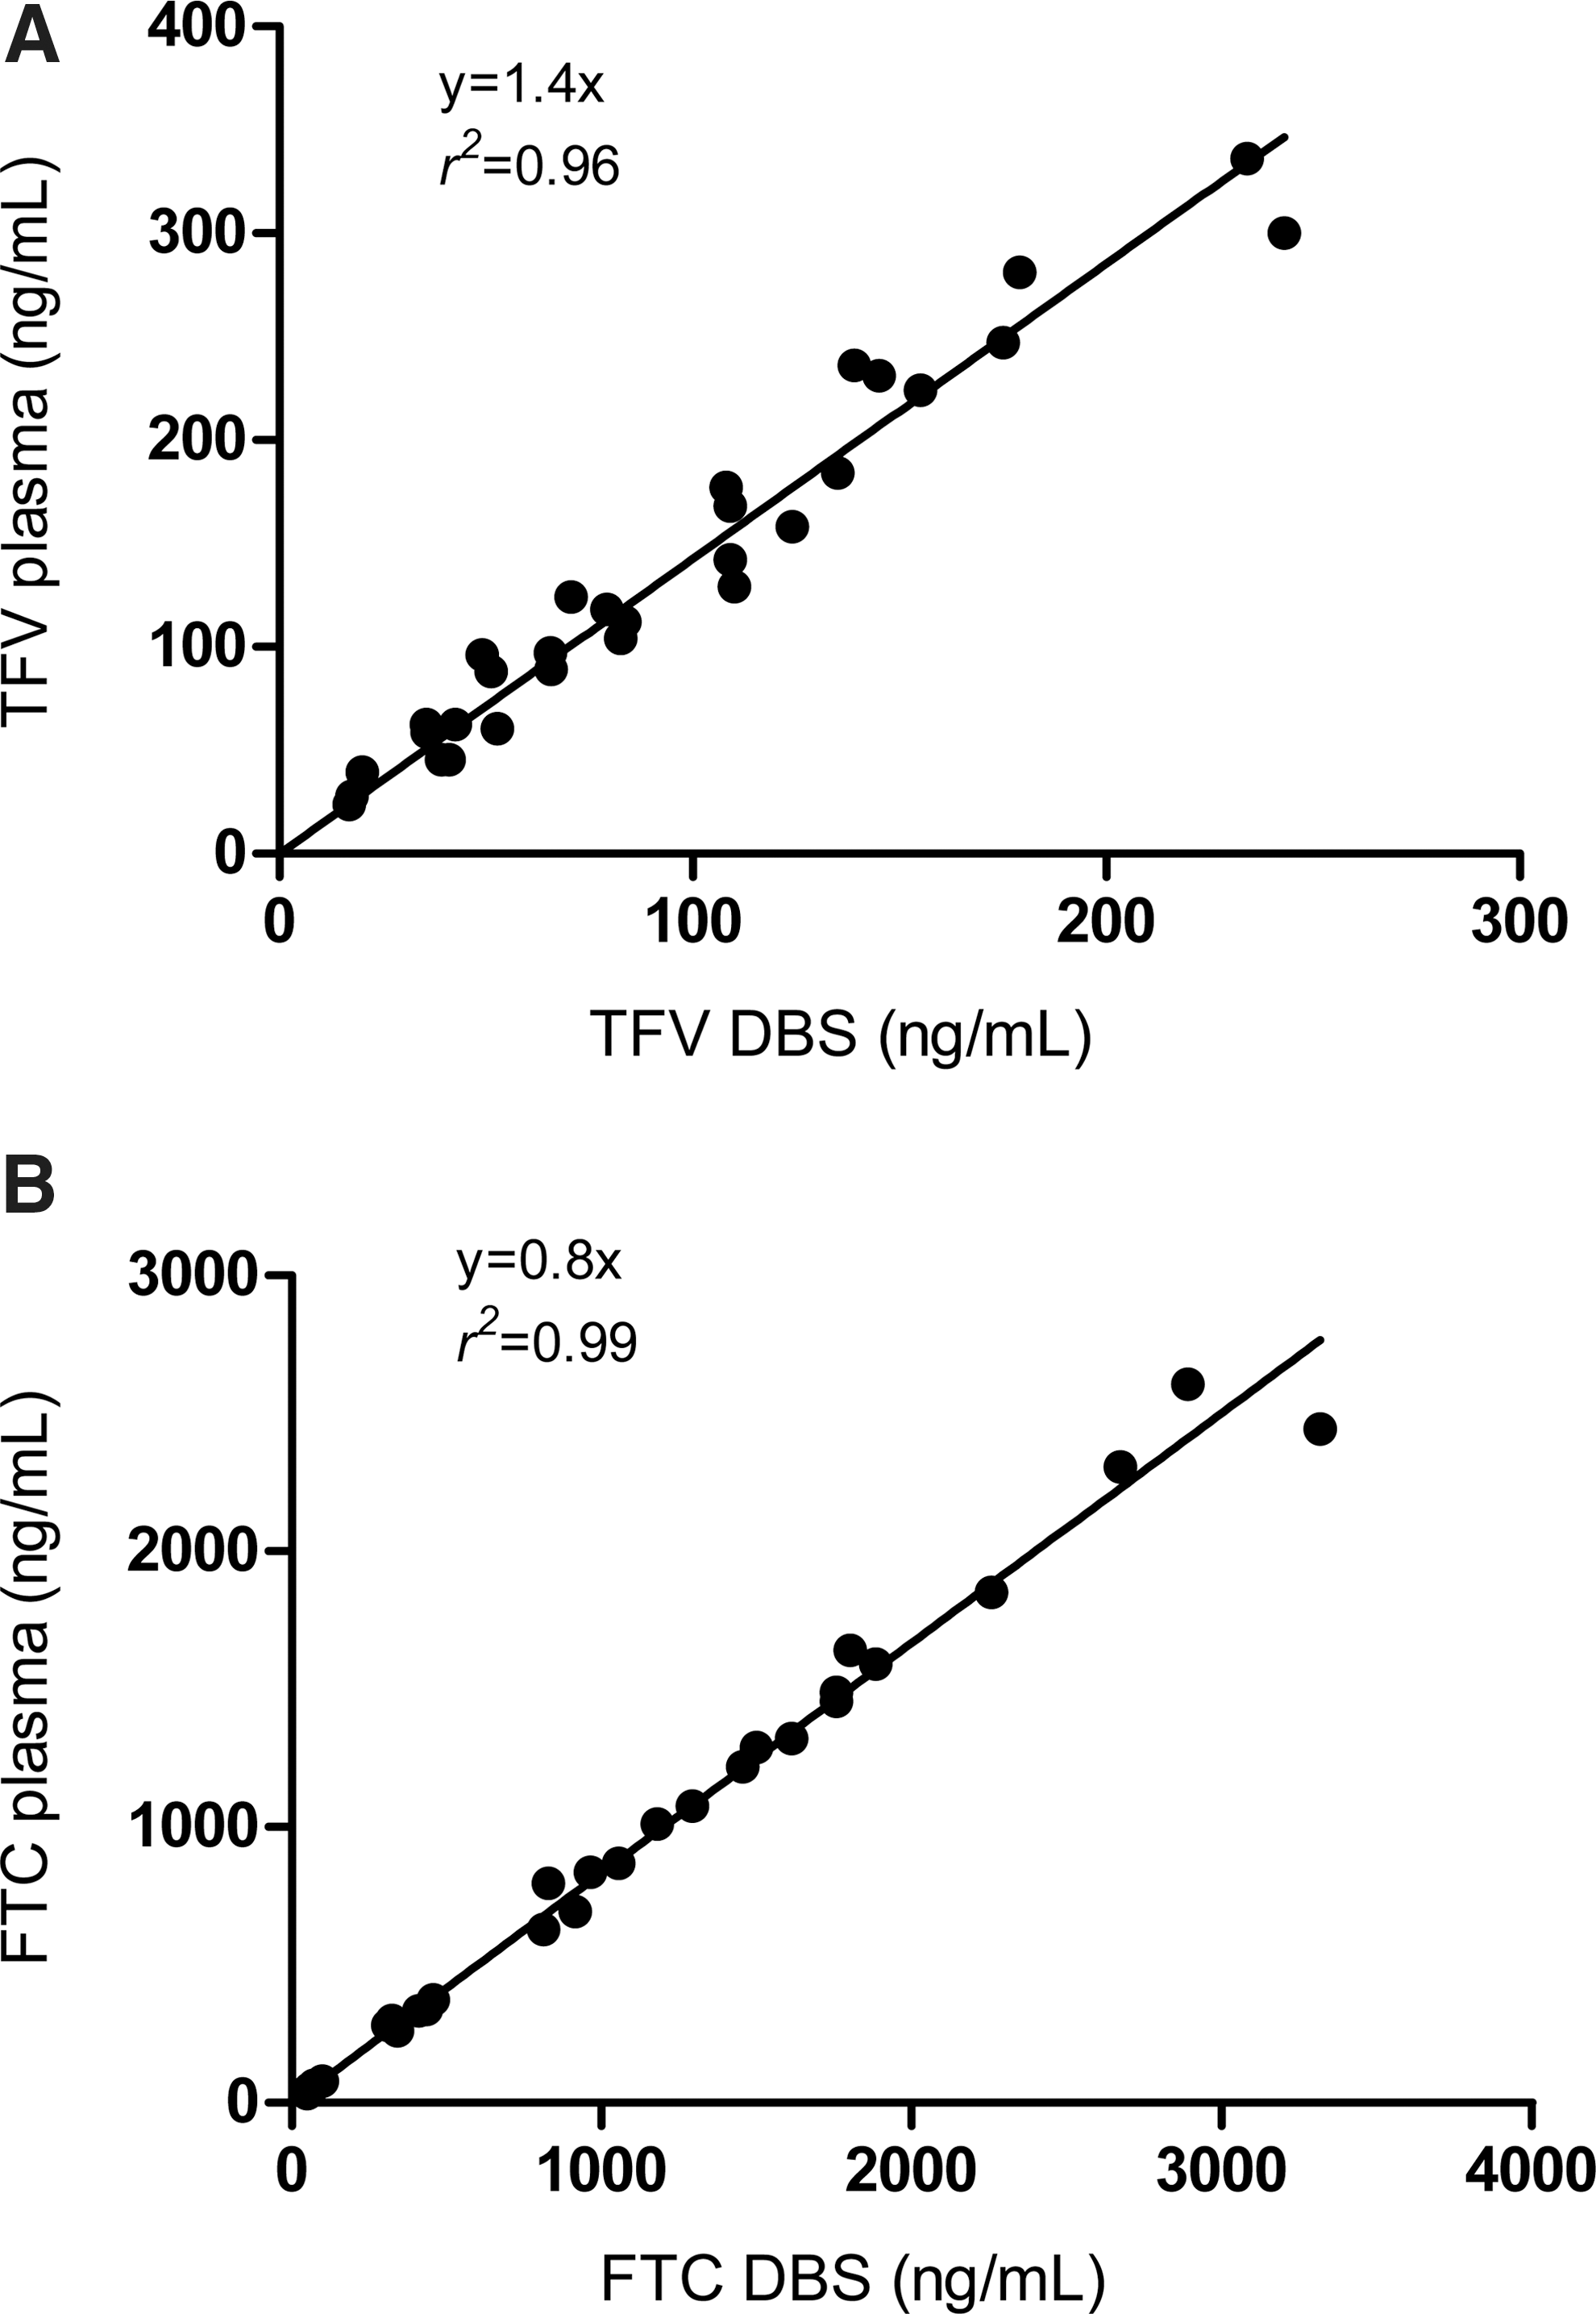
TFV-DP in DBSs
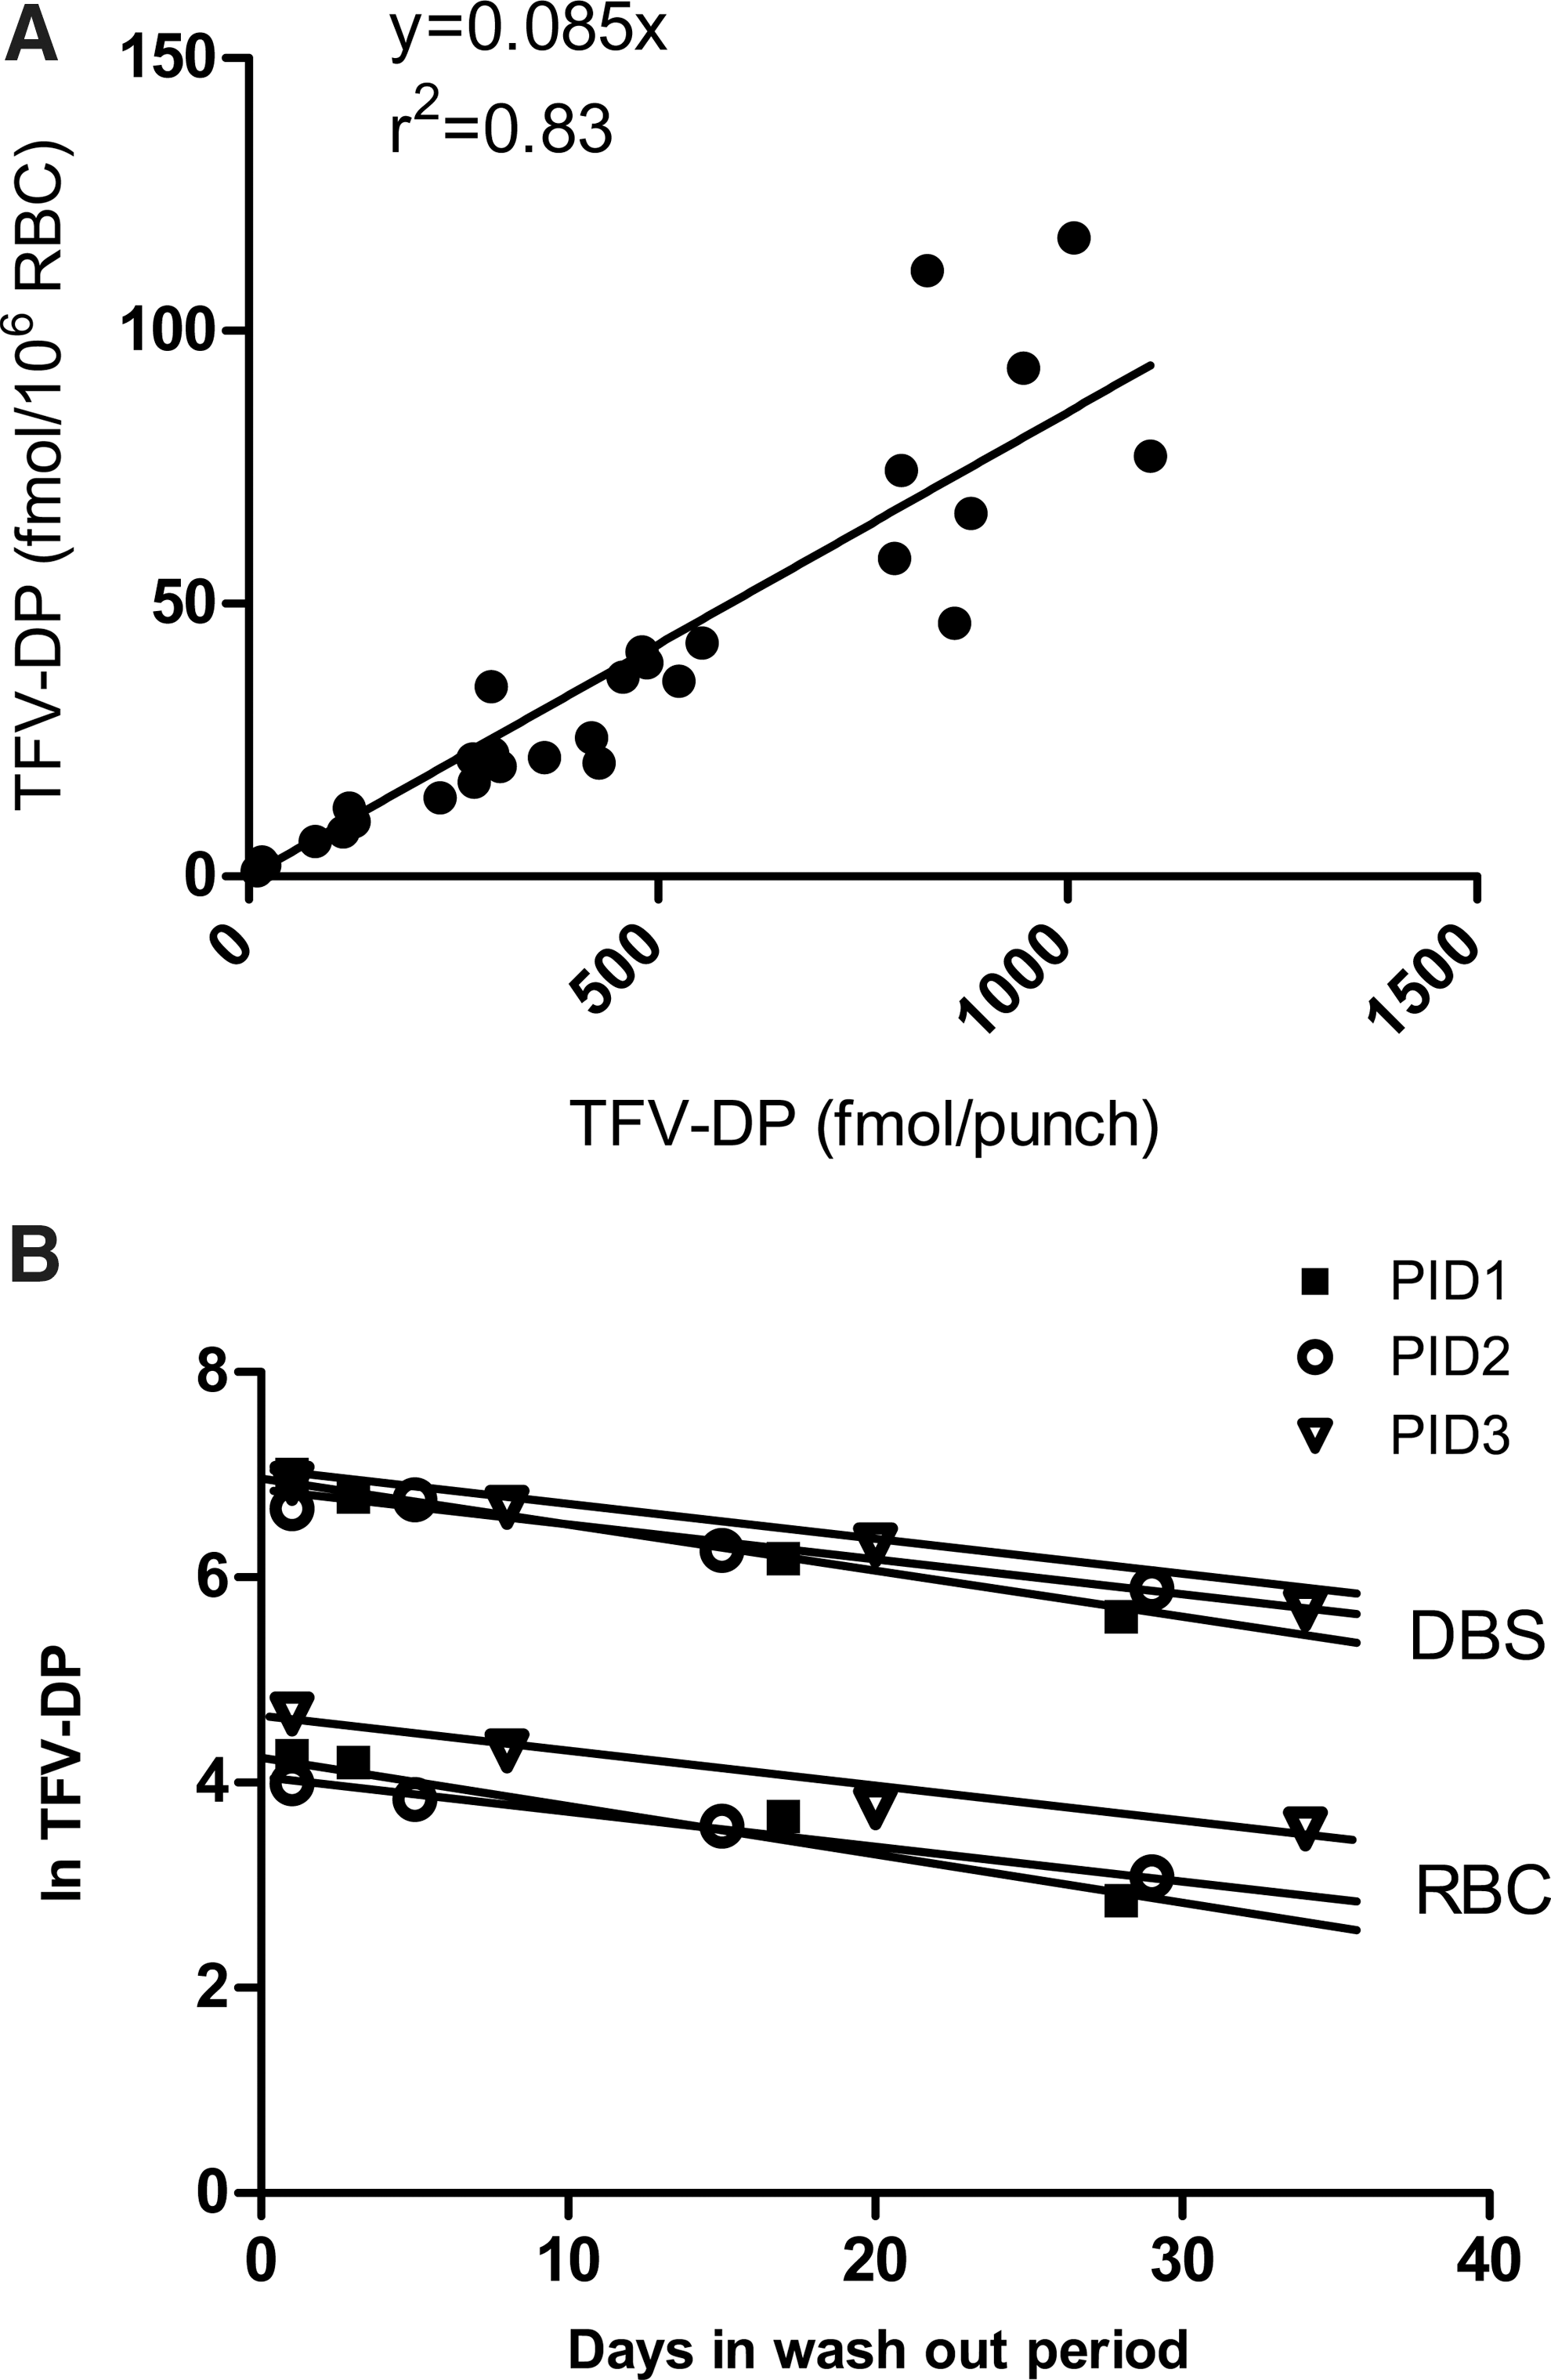
For TFV-DP analysis, a total of 29 paired RBC/DBS samples from 5 subjects were extracted and analyzed. Samples in the washout phase (days 30, 35, 45, and 60) were available from three participants. TFV-DP was higher in DBSs (fmol/punch) versus the paired RBCs (fmol/106 RBCs) by approximately 12-fold, suggesting that the 3-mm punch contained approximately 12 million RBCs. The lowest and highest hematocrits from the five participants were 36 and 46%, and the corresponding average number of RBCs per punch was 12.2 million and 12.9 million cells, respectively. The relationship between paired DBS and RBC concentrations was defined by y=0.085x with r 2 =0.83, as shown in Fig. 3. Also shown in Fig. 3 are the DBS and RBC pairs from the three participants in the washout phase, demonstrating parallel decay rates in DBSs and RBCs. The half-lives were 14, 20, and 22 days in RBCs and 14, 19, and 22 days in DBSs, respectively. After 30 days of washout, the TFV-DP levels in DBSs were 296, 275, and 361 fmol/punch in the three participants, more than 100-fold above the LLOQ for the assay.
DBS stability
Compared with storage at −80°C, TFV-DP in DBS samples stored at 4°C showed a mean (range) difference of −6% (−25% to 22%), and samples stored at −20°C showed no change, −0.3% (−16% to 16%) up to 7 months in storage. However, samples stored at room temperature were −47% (−70% to 11%) compared with samples at −80°C, and fell outside the±15% range after approximately 2 weeks (Fig. 4).
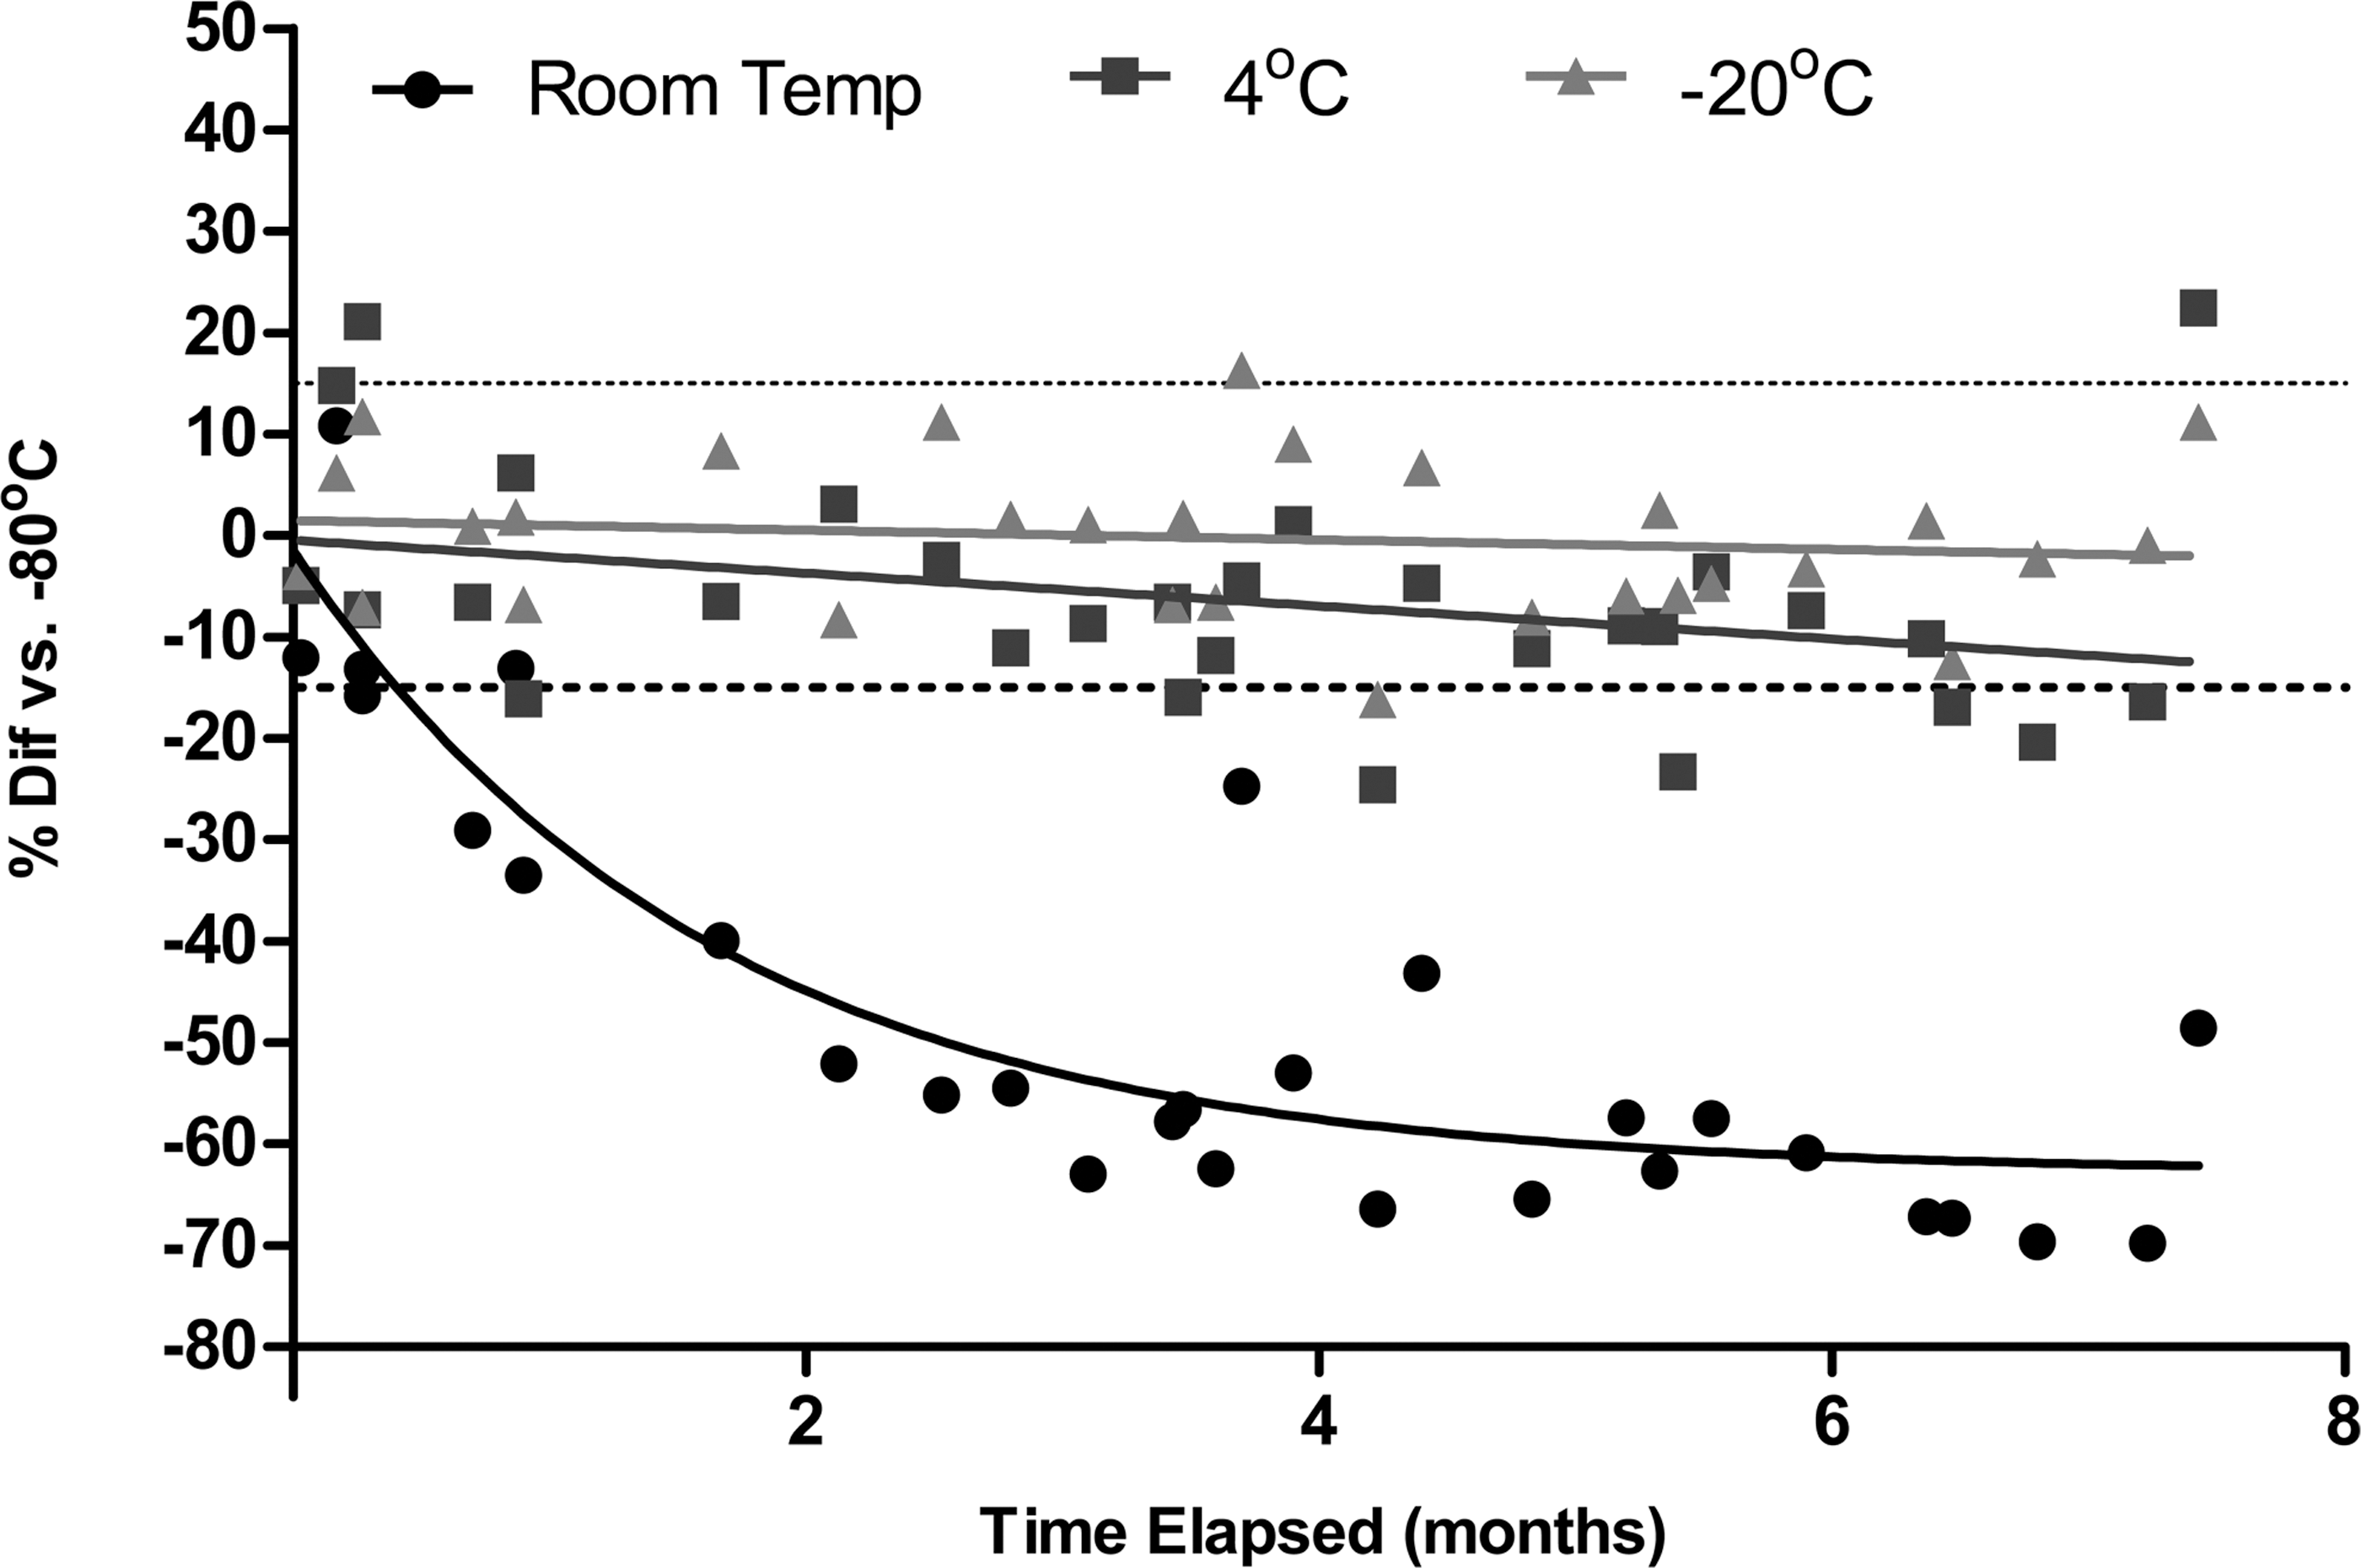
The effect of storage conditions on tenofovir-diphosphate (TFV-DP) concentrations in DBSs over time. Samples stored at room temperature (circles), 4°C (squares), and −20°C (triangles) were compared with samples from the same DBS spot stored at −80°C. The dashed lines represent a 15% difference from −80°C. Samples stored at room temperature were >15% below the level at −80°C after approximately 2 weeks.
Adherence simulations
Simulations of TFV-DP in RBCs when dosed 1, 2, 3, 4, 5, 6, and 7 times weekly demonstrated that each dose per week contributed approximately 19 fmol/106 RBCs. This translates to approximately 230 fmol/punch, using a mean of 12 million RBCs per DBS punch. Figure 5 shows the relationship between doses per week to TFV-DP in DBSs and RBCs, starting from an initial daily dosing steady state, and showing the effects of fewer doses per week over time.
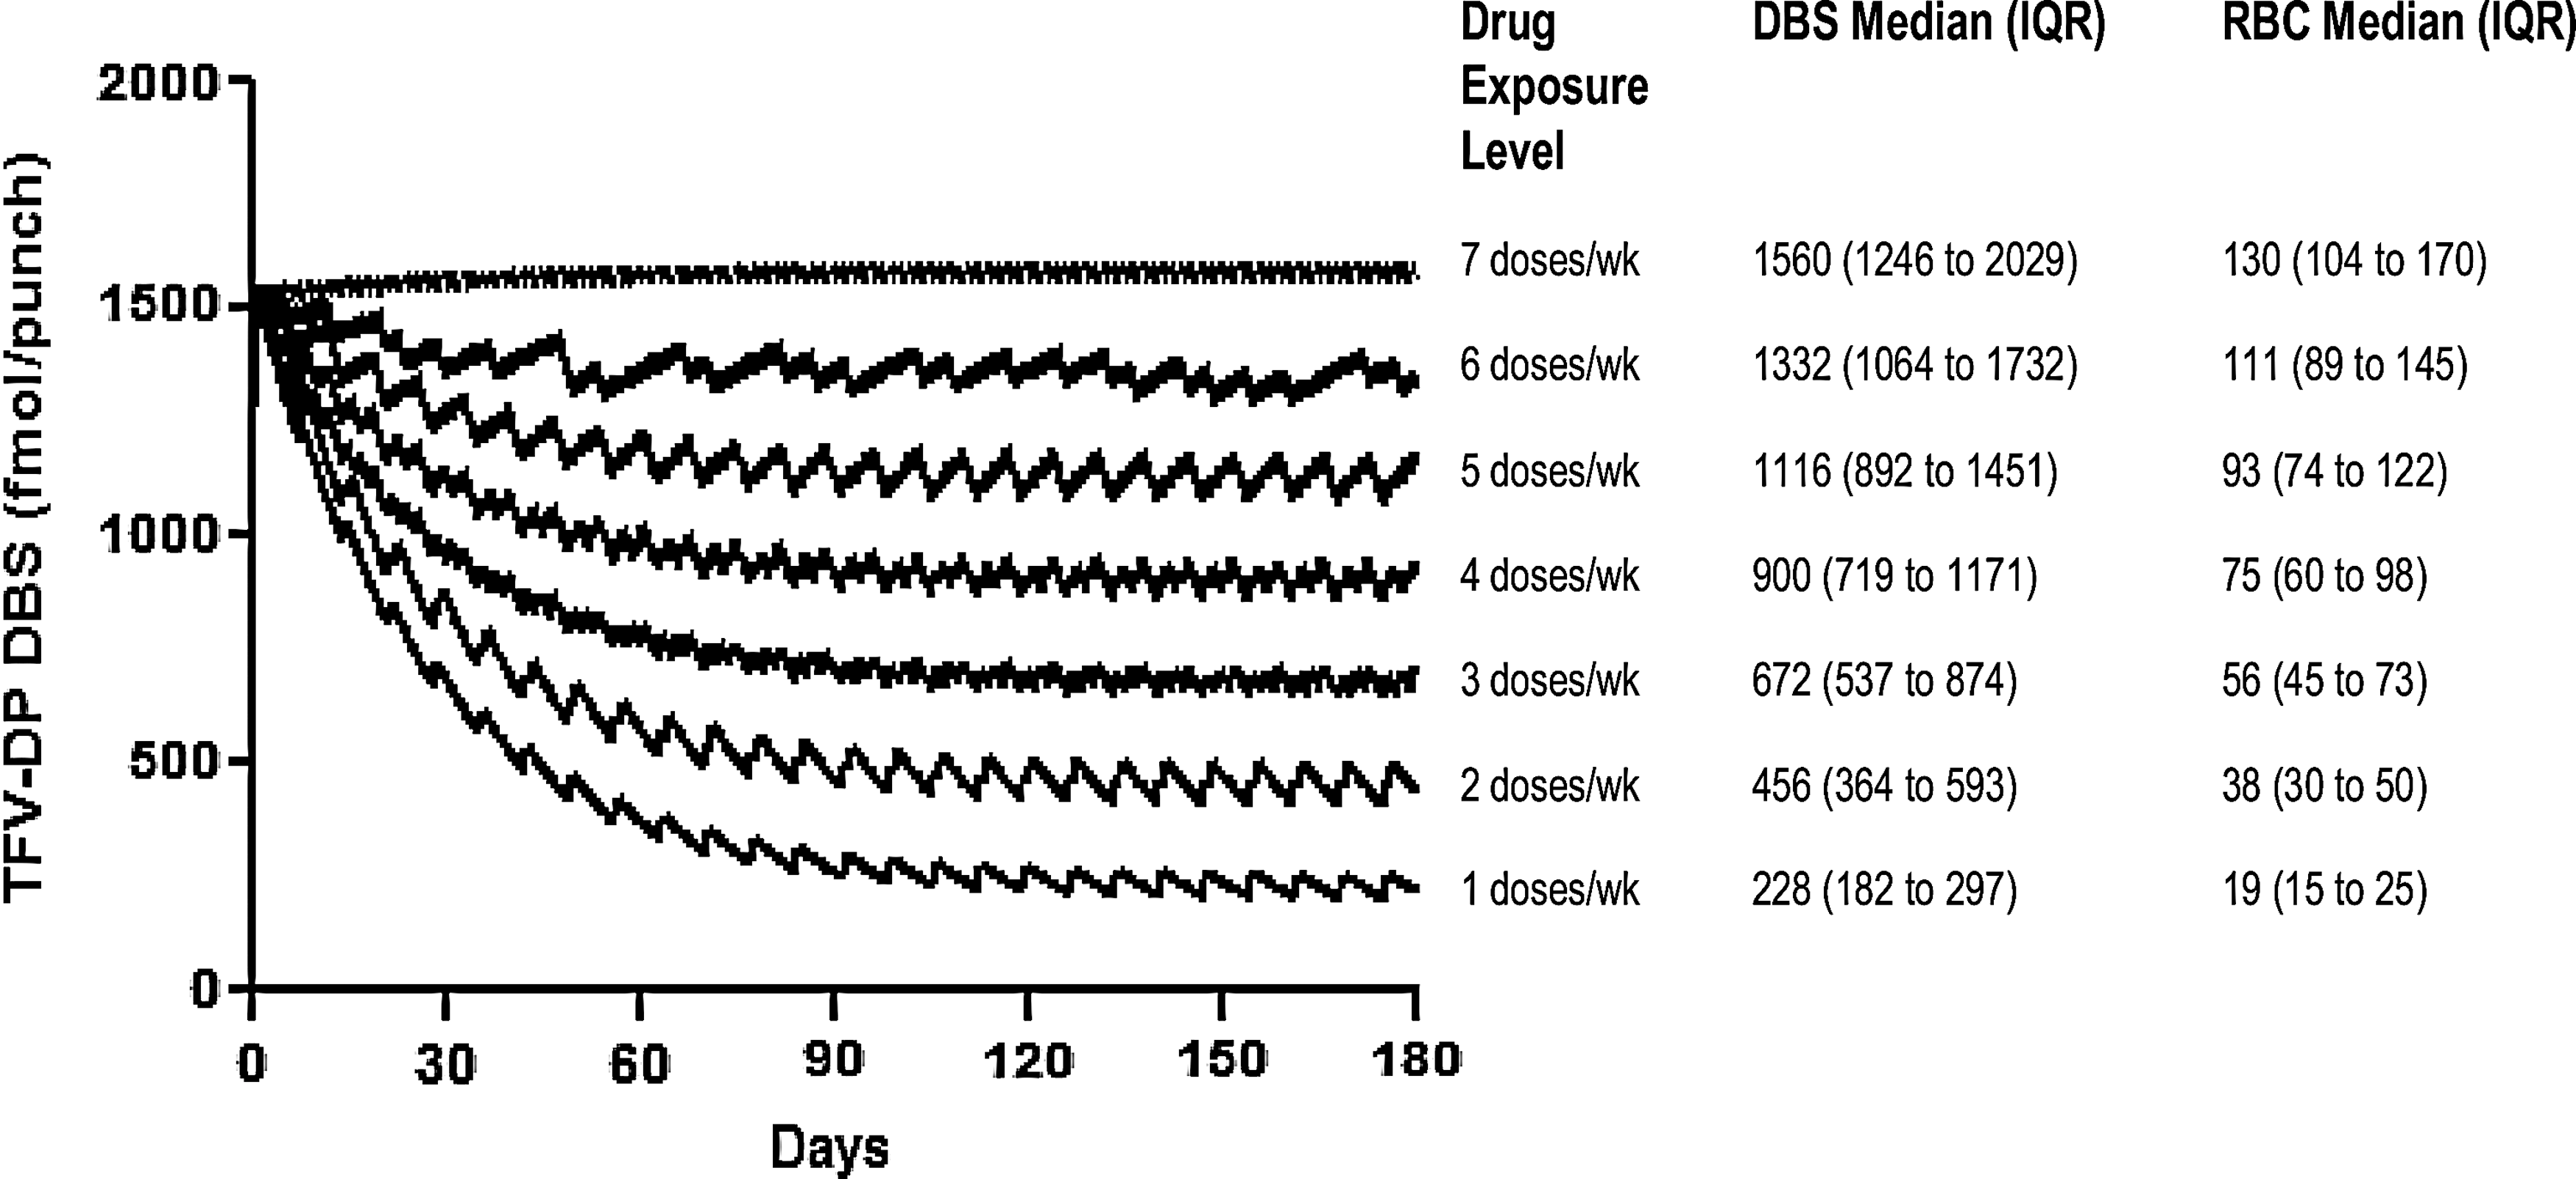
Simulated tenofovir diphosphate (TFV-DP) levels in DBSs and RBCs following different patterns of drug exposure. TFV-DP levels start from steady state associated with daily dosing to show the rate of change over time.
Discussion
This study compared the pharmacokinetics of TFV-DP in RBCs versus PBMCs among HIV-seronegative volunteers. In PBMCs, the average TFV-DP concentration at steady state was approximately 100 fmol/106 cells, which is within the range of levels reported among HIV-infected patients (90 to 200 fmol/106 cells). 14 –16 The TFV-DP half-life in PBMCs (100 h) was also consistent with that in HIV-infected patients (90 to 180 h). 15,17,18 In RBCs, the TFV-DP half-life was 17 days (approximately 400 h) and steady state levels in RBCs were 130 fmol/106 cells, 1.3-fold above that in PBMCs.
For TFV-DP in RBCs, a 17-day half-life with a relatively low coefficient of variation (30% observed on day 30) is a characteristic well suited for monitoring average dose exposure over time (depicted in Fig. 5). There was an approximately 230-fmol/punch decrement in C ss average for each dose per week missed, and the 17-day half-life smooths the pharmacokinetic curve so that a TFV-DP level represents an average drug exposure over time. This is analogous to monitoring drug levels in hair, or hemoglobin A1C for average glucose exposure over time in diabetics, both highly informative clinical measures. 19,20 A benefit of monitoring RBCs is the easy access to this tissue, where one 25-μl drop of blood contains about 100 million RBCs. An advantage of DBSs is the ability to measure both TFV/FTC parent drug (recent dosing) and intracellular TFV-DP (cumulative dosing). This suggests that TFV/TFV-DP monitoring in RBCs/DBSs might be applied to a wide array of clinical/research settings including infants/pediatrics or TFV vaginal gel trials, where low levels of TFV are absorbed into the systemic circulation from the vagina. 21
Other implications of a 17-day half-life are that TFV-DP in RBCs will accumulate by 25-fold from the first dose to steady state, which is consistent with low TFV-DP levels in RBCs (∼5 fmol/106 RBCs) observed after one dose. 22 On the other hand, TFV-DP in PBMCs, with a 4-day half-life, would be expected to accumulate approximately 6-fold. Although this is also consistent with low TFV-DP levels observed after single dose (∼15 fmol/106 PBMCs), 22 this half-life difference illustrates that the ratio between TFV-DP in RBCs and PBMCs will change until steady state is achieved, when levels in RBCs will reach approximately 1.3-fold those in PBMCs. The 1.3-fold ratio described here is similar to the 1.2-fold ratio (at presumed steady state) described previously in five HIV-infected subjects. 9
A potential application for TFV-DP in RBCs/DBSs would be to quantify drug exposures as a routine measure of average adherence over time. The possibility is enhanced by the widespread use of TFV in nearly all HIV treatment and chemoprevention scenarios, including as a component of numerous coformulated products. 23 TFV-DP in RBCs/DBSs, as shown in Fig. 5, would provide complementary information along with plasma parent drug concentrations or, as shown in this study, with parent drug DBS concentrations, where the short half-life of TFV and FTC (∼15 and ∼10 h, respectively) provides information on recent drug exposure. 8 The 17-day TFV-DP half-life in RBCs/DBSs would inform whether “white coat” dosing was masking remote nonadherence. In fact, white coat adherence occurs in as many as 50 to 80% of subjects in HIV treatment trials. 24 Such a quantitative adherence tool could apply to numerous HIV treatment scenarios, including pediatric studies, routine HIV management, and HIV prevention trials. In the HIV prevention field, mounting evidence suggests that variable adherence is the main driving force for variable effectiveness of TFV-based regimens. 25 As an example application, the iPrEx trial [a randomized double-blind trial of TDF/FTC versus placebo to prevent HIV in men who have sex with men (MSM)] modeled the number of doses per week estimated to confer high preexposure prophylaxis (PrEP) efficacy, and predicted that four and more doses lowered the risk of HIV acquisition by more than 95%. 26 This drug exposure level (>4 doses/week) would correspond with >75 fmol/106 RBCs or >900 fmol/punch at steady state (see 4 doses/week in Fig. 5). A similar rationale could be developed for HIV treatment scenarios. Previous data in HIV-infected individuals demonstrated that a level of average adherence ≥80% is associated with sustained viral suppression. 27 This level of exposure would correspond to >104 fmol/106 RBCs or >1248 fmol/punch at steady state. Once validated, such a quantitative value could be used to monitor PrEP or antiretroviral treatment in clinical trials or practice.
This study showed the feasibility of using DBSs for monitoring TFV-DP in RBCs and parent TFV/FTC in plasma. The linear regression between TFV-DP in RBCs versus DBS, and TFV/FTC in plasma versus DBSs were defined by simple equations and r 2 =0.83, 0.96, and 0.99, respectively (Figs. 2 and 3). These plasma-versus-DBS results are at the high end of other published plasma–DBS data for antiretroviral drugs, where r 2 ranged from 0.69 to 0.98; the TFV-DP RBC versus DBS results are also well within this r 2 range. 28 –32
The usefulness of DBSs as a simple approach to collect laboratory data has become a topic of great interest given the many advantages it has over traditional whole blood and plasma sampling, which include the low blood volume required, easier collection technique, less intensive labor, fewer cumbersome storage and transportation requirements, and a substantial reduction in cost. 10,33,34 In contrast to regular phlebotomy, DBS collection is minimally invasive and does not require specific skills, sterile equipment, or rigorous storage conditions. 10 This study demonstrated that TFV-DP in DBSs remained stable at room temperature or typical refrigerator temperatures (4°C) short term and under typical freezer conditions long term (−20°C), which could allow for use in diverse settings. DBSs also minimize the potential for occupational exposure during collection and transportation and could have a beneficial impact on HIV care costs. Last, DBSs could be self-obtained by the subjects, which has been already proposed in non-HIV scenarios. 35,36
Along with the promise of DBS monitoring for adherence come some limitations, and the need for additional research. The TFV-DP levels in RBCs change relatively slowly over time (depicted on the x axis in Fig. 5), which creates a lag time between adherence changes and changes in TFV-DP in RBCs. In addition, the 17-day TFV-DP half-life may not allow for elucidating specific nonadherence patterns over the preceding period of time. For example, in an individual with a TFV-DP RBC concentration of ∼75 fmol/106 RBCs (∼900 fmol/punch in DBSs), the average adherence would be approximately 60%, or 4 doses per week, over the preceding 120 days (Fig. 5), but the subject may have exhibited episodes of sustained low adherence, followed by compensatory periods of high adherence. However, the measure of parent TFV/FTC in DBSs would provide information regarding recent dosing to offset these limitations. It should also be noted that our study evaluated DBSs obtained via venipuncture; the comparability between this approach and DBSs obtained via fingerstick will require further validation. Finally, the simulations used in Fig. 5 assumed normal distribution, dose proportionality, and a 30% coefficient of variation. Further characterization of dose proportionality and variance in TFV-DP in DBSs is needed.
In conclusion, RBCs/DBSs offer a convenient measure of recent adherence via TFV/FTC levels and cumulative adherence over time via TFV-DP levels in RBCs. This methodology requires prospective validation in the field, including HIV-infected persons, before it can be widely used to monitor adherence and drug exposure in clinical trials and routine patient care. The present study provides the framework to guide these future endeavors.
Footnotes
Acknowledgments
The authors thank the NIH AIDS Research and Reference Reagent Program for the reference standards used for the assays; the study personnel and nursing staff who assisted with the clinical protocol; and the subjects who participated. This work was supported by grants from the NIH: U01 AI84735 (P.L.A.) and UL1 RR025780 (University of Colorado Clinical and Translational Sciences Institute). Study drug was donated by Gilead Sciences.
Author Disclosure Statement
No competing financial interests exist.