
Abstract
Human T cell lymphotropic virus type 1 (HTLV-1) proviral load (PVL) in peripheral blood mononuclear cells (PBMCs) is high in patients with adult T cell leukemia/lymphoma or HTLV-1-associated myelopathy/tropical spastic paraparesis (HAM/TSP) and in some asymptomatic carriers, but fluctuates. Our objectives were to document ranges of HTLV PVL across a broader spectrum of diseases and tissues, to quantify the normal range of intrapatient PVL variability, and to identify which PVL values and changes deserve further investigation. PVL was measured in 191 patients with HTLV-1-associated diseases and in 211 asymptomatic carriers, using real-time quantitative PCR. The intraassay variability increases as viral load decreases: 8% at high load, 17% at medium load, and 33% at low load. The interassay variability is not different from the intraassay. Mean intrapatient CV is 65% (SD 21) in asymptomatic carriers and 59% (SD 22) in HAM/TSP. PVL values varied widely between individuals, but were relatively constant within individuals. High PVL in cerebrospinal fluid (CSF) and lymph nodes (LN) was associated with disease but 57% of asymptomatic carriers had a PVL greater than 1% in PBMCs. Our results suggest that (1) PVL changes falling outside a coefficient of variation of 100% require more detailed assessment, (2) asymptomatic carriers with PVL higher than 10% should undergo more frequent clinical and laboratory monitoring, and (3) HTLV-1 PVL in blood and tissue is helpful in the diagnosis and monitoring of HTLV-1 infection.
Introduction
H
HTLV-1 integrates into the host cell genome and predominantly infects activated memory CD4 T cells. 15 While the contribution of infectious spread (from infected to uninfected cells) to viral burden is uncertain, the conservation of the HTLV-1 sequence 16 and the observed clonal expansion of infected cells 17,18 suggest that proviral load (PVL) is mostly sustained through mitotic division of infected cells. Although the interpatient range of PVL is high, several studies have reported that PVL remains relatively stable over time in asymptomatic carriers. 19,20 This suggests an initial expansion of infected cells to a viral load set point, followed by an equilibrium between proliferation and elimination of infected cells. 21
The determinants of the long-term outcome of HTLV-1 infection are not fully defined; however, in other chronic viral infections PVL correlates with the clinical course. 22 Cross-sectional studies have shown median HTLV-1 PVL levels to be higher in patients with ATLL and HAM/TSP than in asymptomatic HTLV-1 carriers. 23 –27 A high level of HTLV-1 PVL in HTLV-1 carriers is considered to be a risk factor for HTLV-1-associated diseases, although there are limited longitudinal data to confirm that high PVL is the cause rather than a consequence of HAM/TSP or ATLL. 24,28 –30
To interpret HTLV-1 PVL at the individual level it is important to know the interassay and intraassay variability as well as the natural variability within and between patients. HTLV-1 proviral load, as described in Materials and Methods, has been measured sequentially as part of routine clinical care for patients attending the National Centre for Human Retrovirology (NCHR) at Imperial College Healthcare NHS Trust, London, UK since 2000. Based on this experience we describe the following:
1. Interassay and intraassay variability of a quantitative HTLV-1 real-time polymerase chain reaction (PCR);
2. Intrapatient and interpatient variability of HTLV-1 PVL in asymptomatic carriers and patients with HAM/TSP;
3. HTLV-1 PVL in peripheral blood mononuclear cells (PBMCs), cerebrospinal fluid (CSF), and lymph node (LN) biopsies;
4. HTLV-1 PVL across the spectrum of HTLV-1-associated conditions;
5. Trends in PVL, over a median of 6.5 years of follow-up, in asymptomatic carriers and in patients with HAM/TSP.
In the analysis of these data, we describe the normal range of intrapatient variability to identify which changes in viral load should be considered significant and deserving of further investigation. In asymptomatic carriers an increase in PVL is potentially associated with a higher risk of developing an HTLV-1-associated disease, therefore defining whether an observed change is within the normal range of variability is important. In patients with HAM/TSP undergoing treatment with antiviral or immunosuppressive therapy HTLV-1 PVL has potential both as a surrogate of efficacy (decreased PVL) and to detect adverse events (increased PVL), while in patients with ATLL PVL provides an additional molecular tool to monitor remission. Furthermore, in addition to describing the natural course of HTLV-1 PVL in patients with and without disease, PVL in PBMCs is compared, in patients with ATLL-lymphoma, with PVL in lymph node, and in patients with neurological symptoms where CSF examination has been indicated, with PVL in nucleated CSF cells.
Materials and Methods
Baseline demographic characteristics
From 2000 to 2011, 402 HTLV-1-infected subjects have been followed-up at the NCHR. Of these, 73% were female with a median age in 2011 of 55.2 years (range 5.6–90.0); the median age for males was 54.6 years (range 8.2–84.5). Of the subjects 56% were of Afro-Caribbean origin, 23% were white, and all the other ethnicities were less than 5%.
Data from 211 HTLV-1 asymptomatic carriers, 85 patients with HAM/TSP, 36 with ATLL-lymphoma, 27 with ATLL-leukemia, and 43 with other conditions (12 with HTLV-1/HIV coinfection, 19 with HTLV-1 and neurological symptoms other than HAM/TSP, eight with other HTLV-1-associated inflammatory symptoms, and four with HTLV-1 and Strongyloides stercoralis infection) were analyzed.
PBMCs were obtained by density gradient centrifugation of 6 ml of EDTA whole blood using Histopaque 1077 (Sigma-Aldrich). Cells were washed in phosphate-buffered saline (PBS) (Sigma-Aldrich) and re-suspended in fetal calf serum (Invitrogen) with 10% dimethyl sulfoxide (Sigma-Aldrich) and stored at −80C°. PBMCs for DNA extraction were resuspended in 200 μl of PBS. Cells from 1 ml of CSF were separated by centrifuging the cerebrospinal fluid at 13,000 rpm for 1 min, and cells were resuspended in 200 μl of PBS.
DNA was extracted from PBMCs, CSF cells, and lymph nodes by using a column extraction QIAamp DNA Mini kit, according to the manufacturer's instruction (QIAGEN, Germany). DNA from the excised lymph nodes embedded in paraffin wax was extracted using the QIAamp DNA FFPE tissue kit (QIAGEN, Germany). A standard curve with a range of 704 to 14 copies (14 being the minimum number of Tax copies that can allow normalization with beta-globin) was generated using 10-fold serial dilution of DNA extracted from an MT-2 cell line, a human leukemia-derived T cell line, containing seven copies of the HTLV-1 provirus per cell, demonstrated by linker-mediated PCR (data not shown). HTLV-1 PVL were quantified by a SYBR Green-based real-time quantitative polymerase chain reaction (qPCR) using a Roche LightCycler 1.5 (Roche-Mannheim, Germany).
Primers SK43 (5’-CGGATACCCAGTCTACGTGT-3’) and SK44 (5’- GAGCCGATAACGCGTCCATCG-3’) were used to amplify a 159-bp fragment of DNA from the Tax region of the HTLV-1 genome. 31
PCR amplification of the beta-globin gene was performed in parallel (Primers: BG84F 5’-GCAAGGTGAACGTGGATG-3’ and BG84R 5’-TAAGGGTGGGAAAATTGACC-3’) to determine the input cell number, and as an endogenous reference to avoid variation due to differences in either the PBMC number or the DNA extraction method used.
As HTLV-1 is not usually found as cell-free virus, viral load is quantified as the number of HTLV-1 DNA copies per 100 PBMCs and referred to as PVL (being almost entirely composed of integrated DNA) and reported as percentage (%). The HTLV-1 PVL (%) was calculated according to the following formula: copy number of HTLV-1 provirus per 100 PBMCs=[(copy number of Tax)/(copy number of beta-globin/2)]×100. A PVL greater than 100% is considered to indicate average integration of more than one provirus per PBMC.
When Tax could not be amplified using the quantitative Real Time PCR, a nested PCR was performed. 31 This method amplifies a sequence from the HTLV-1 Tax gene using a first set of primers specific for HTLV-1 that lie outside the target sequence of the qPCR. The product of the first round is then reamplified using SK43/44 as the inner primer set.
Quantitative PCR has a detection level of 0.01%. The highly specific nested PCR is also highly sensitive detecting a single molecule of HTLV-1 Tax in DNA from 100,000 PBMCs. Therefore samples in which HTLV-1 DNA was not detected with the qPCR but only in the nested PCR were given a PVL value of 0.001%. In the positive control for the nested PCR two copies of HTLV-1 DNA from MT-2 are amplified.
The accuracy of the diagnostic test was assessed by measuring the intraassay and interassay variability. Intraassay variability was evaluated by calculating the coefficient of variation (CV=100×SD/mean) of 10 replicates of viral loads from three samples of DNA in three different ranges of proviral load defined as low (<1%), medium (1–10%), and high (>10%). Interassay variability was calculated by measuring the CV for a low proviral load sample in 10 independent runs. The CV was also used to determine the intrapatient average variability (mean of CV of every patient). Coefficients of variation rather than standard deviations were used as they are not affected by the absolute value of the PVL.
To see whether PVL changes over time, two groups of patients were studied: 62 asymptomatic carriers and 44 HAM/TSP patients for whom blood samples were available over a follow-up period of at least 4 years. To evaluate trends the slope (regression coefficient) of values over time was measured for each patient.
The absolute CD4+ lymphocyte count and total lymphocyte count for the first and last sample of the asymptomatic patients were also compared to document any parallel trend with change in proviral load.
Mean PVL values of each patient were compared among diagnosis groups using one-way ANOVA, followed by a mean separation test (Tukey HSD test). For this analysis, patients were divided into five groups: asymptomatic carriers (N=211), patients with HAM/TSP (85), patients with lymphoma (36), patients with leukemia (27), and patients with other conditions (43).
Results
Performance of the assay
The intraassay coefficient of variation (CV) was inversely proportional to viral load: 8% at high load (>10%), 17% at medium load (1–10%), and 33% at low load (<1%). The interassay CV at low loads (35%) was not different from the intraassay CV. The average intrapatient CV from longitudinal samples was 65% (SD±21) (range 30–110%) in asymptomatic carriers and 59%(SD±22) in HAM/TSP (range 20–125%).
The reproducibility of duplicate analysis performed in the same assay run was found to be similar to that of duplicates tested in different assay runs. Reproducibility was better when qPCR testing was performed on samples with high rather than low viral loads. Hence, the variability of results within a run were reported to be dependent on the viral load. From these results we suggest that in our population of HTLV-1-infected patients a change in viral load within 100% (CV) from one sampling time to another most likely represents a normal intrapatient variability (Fig. 1).
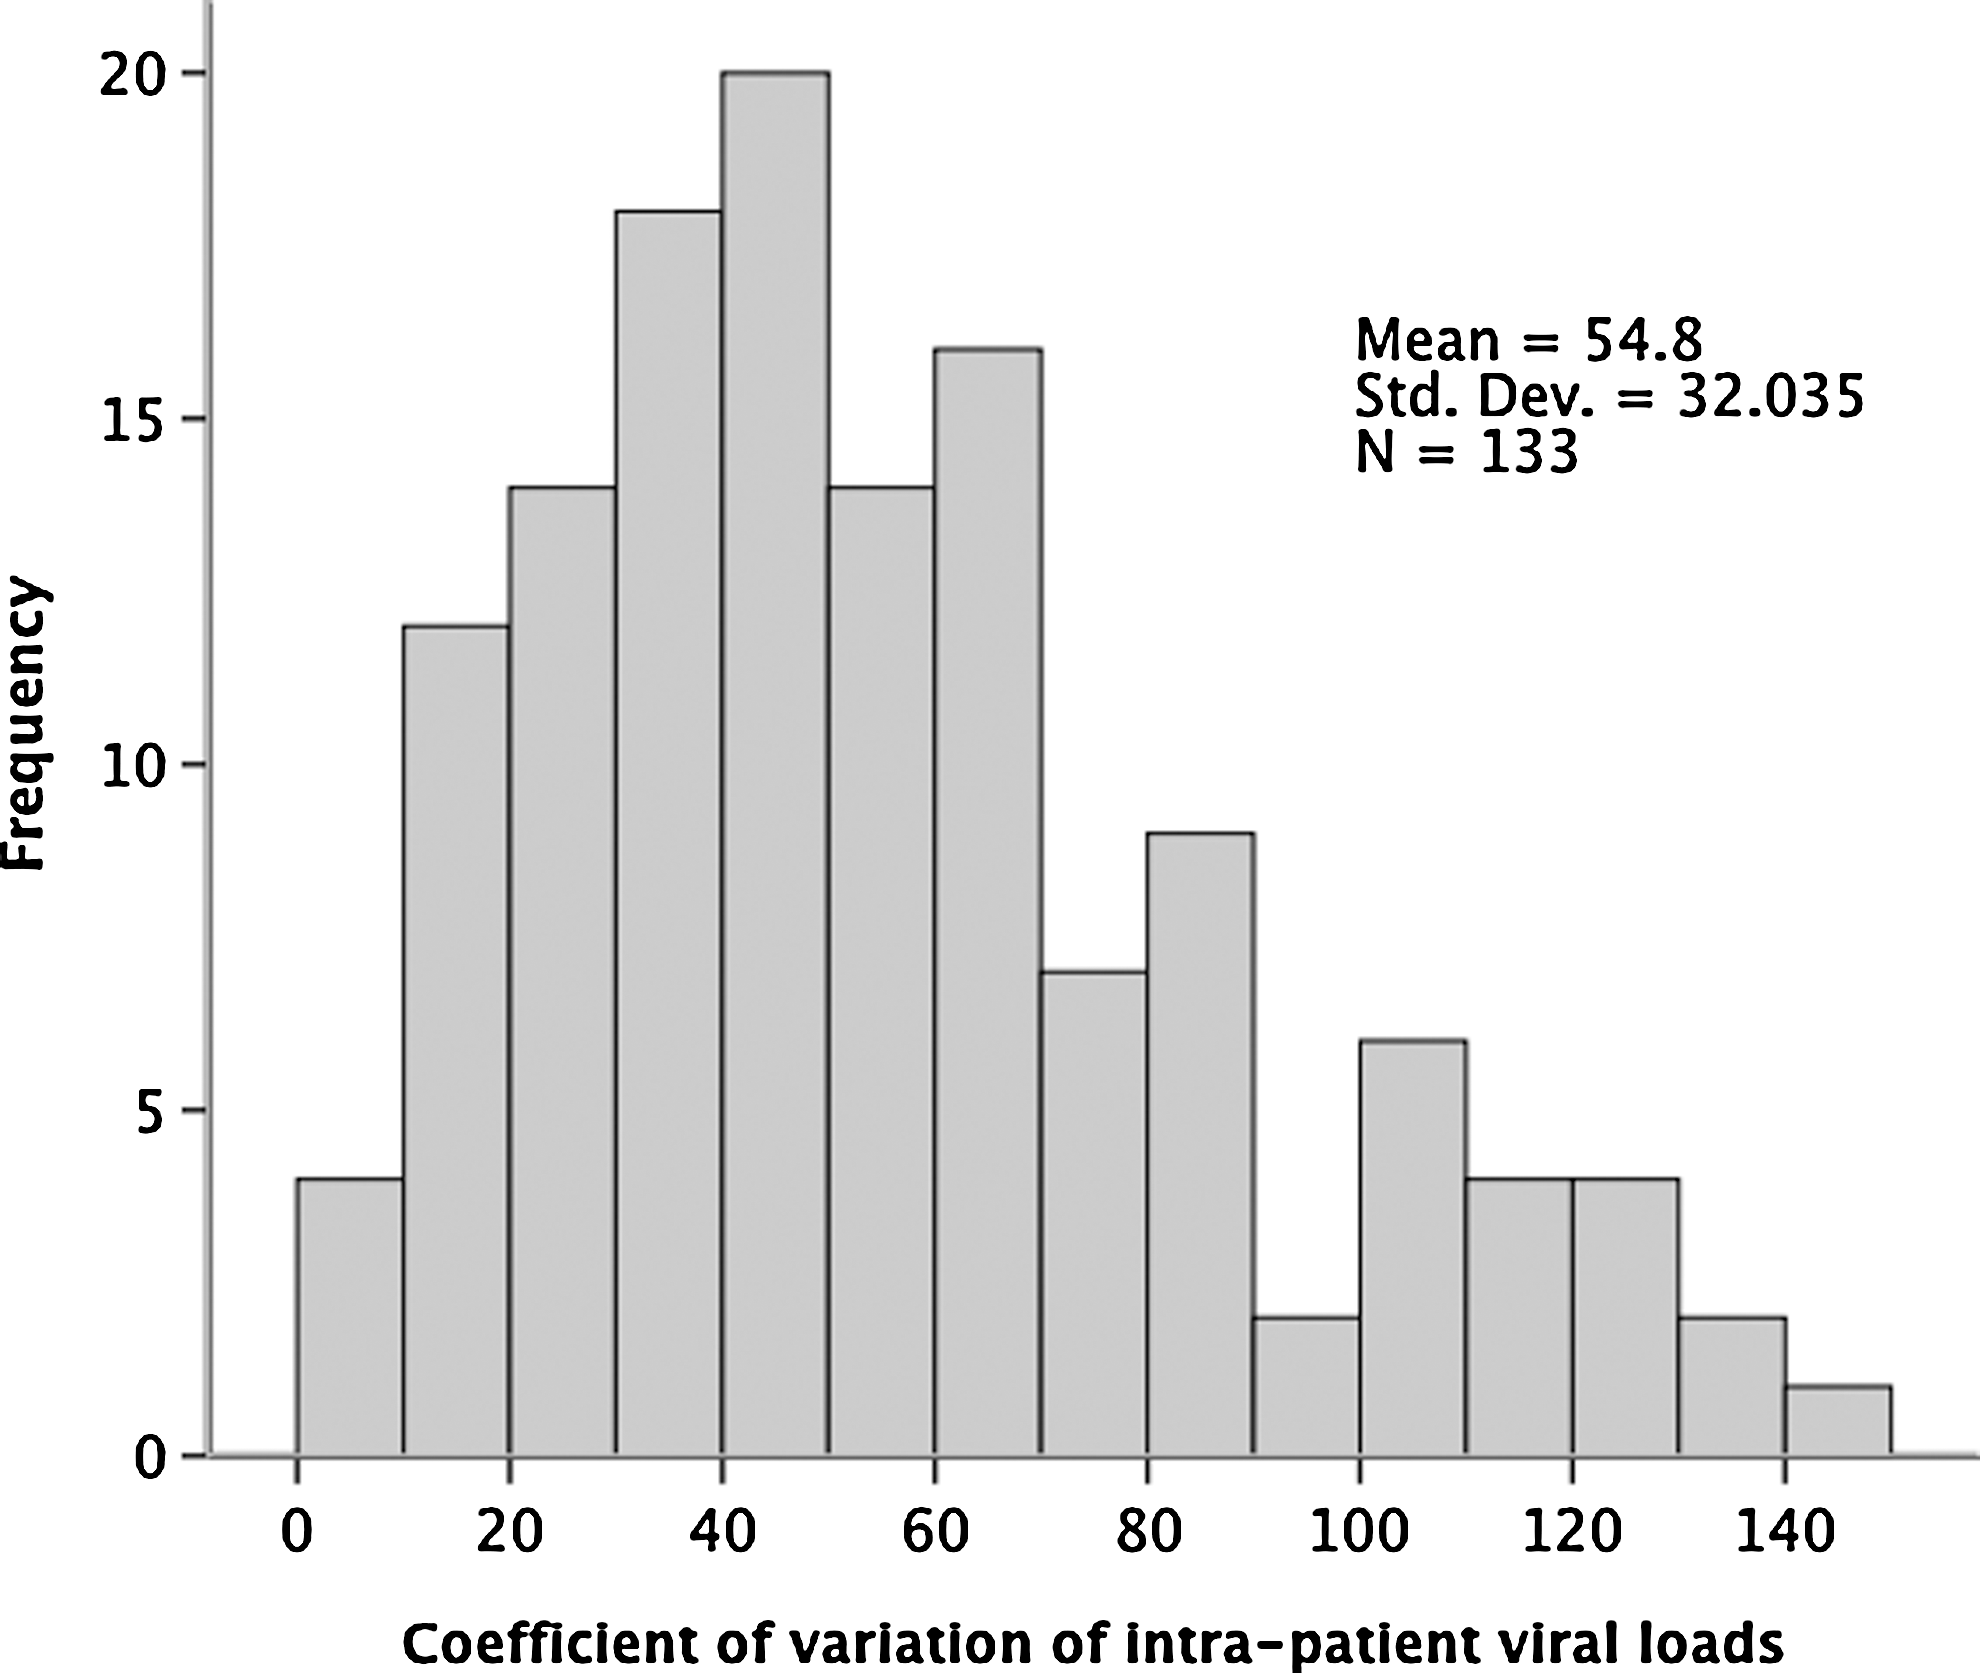
Distribution of coefficient of variation values for intrapatient measurements (asymptomatic carriers) based on a minimum of two time points.
PBMC viral loads according to diagnosis
Median PVL values were significantly different between asymptomatic carriers (1.8%, range 0.001–31.3) and patients with ATLL-lymphoma (7.9%, 0.4–132.2, p=0.006), HAM/TSP (14.7%, 1.7–59.4, p<0.001) or ATLL-leukemia (50.3%, 2.1–270.9, p<0.001) (Fig. 2). PVL values were significantly higher in patients with ATLL-leukemia (acute or chronic) than in patients with HAM/TSP or ATLL-lymphoma (p<0.05), but no difference was observed between patients with HAM/TSP and ATLL-lymphoma.
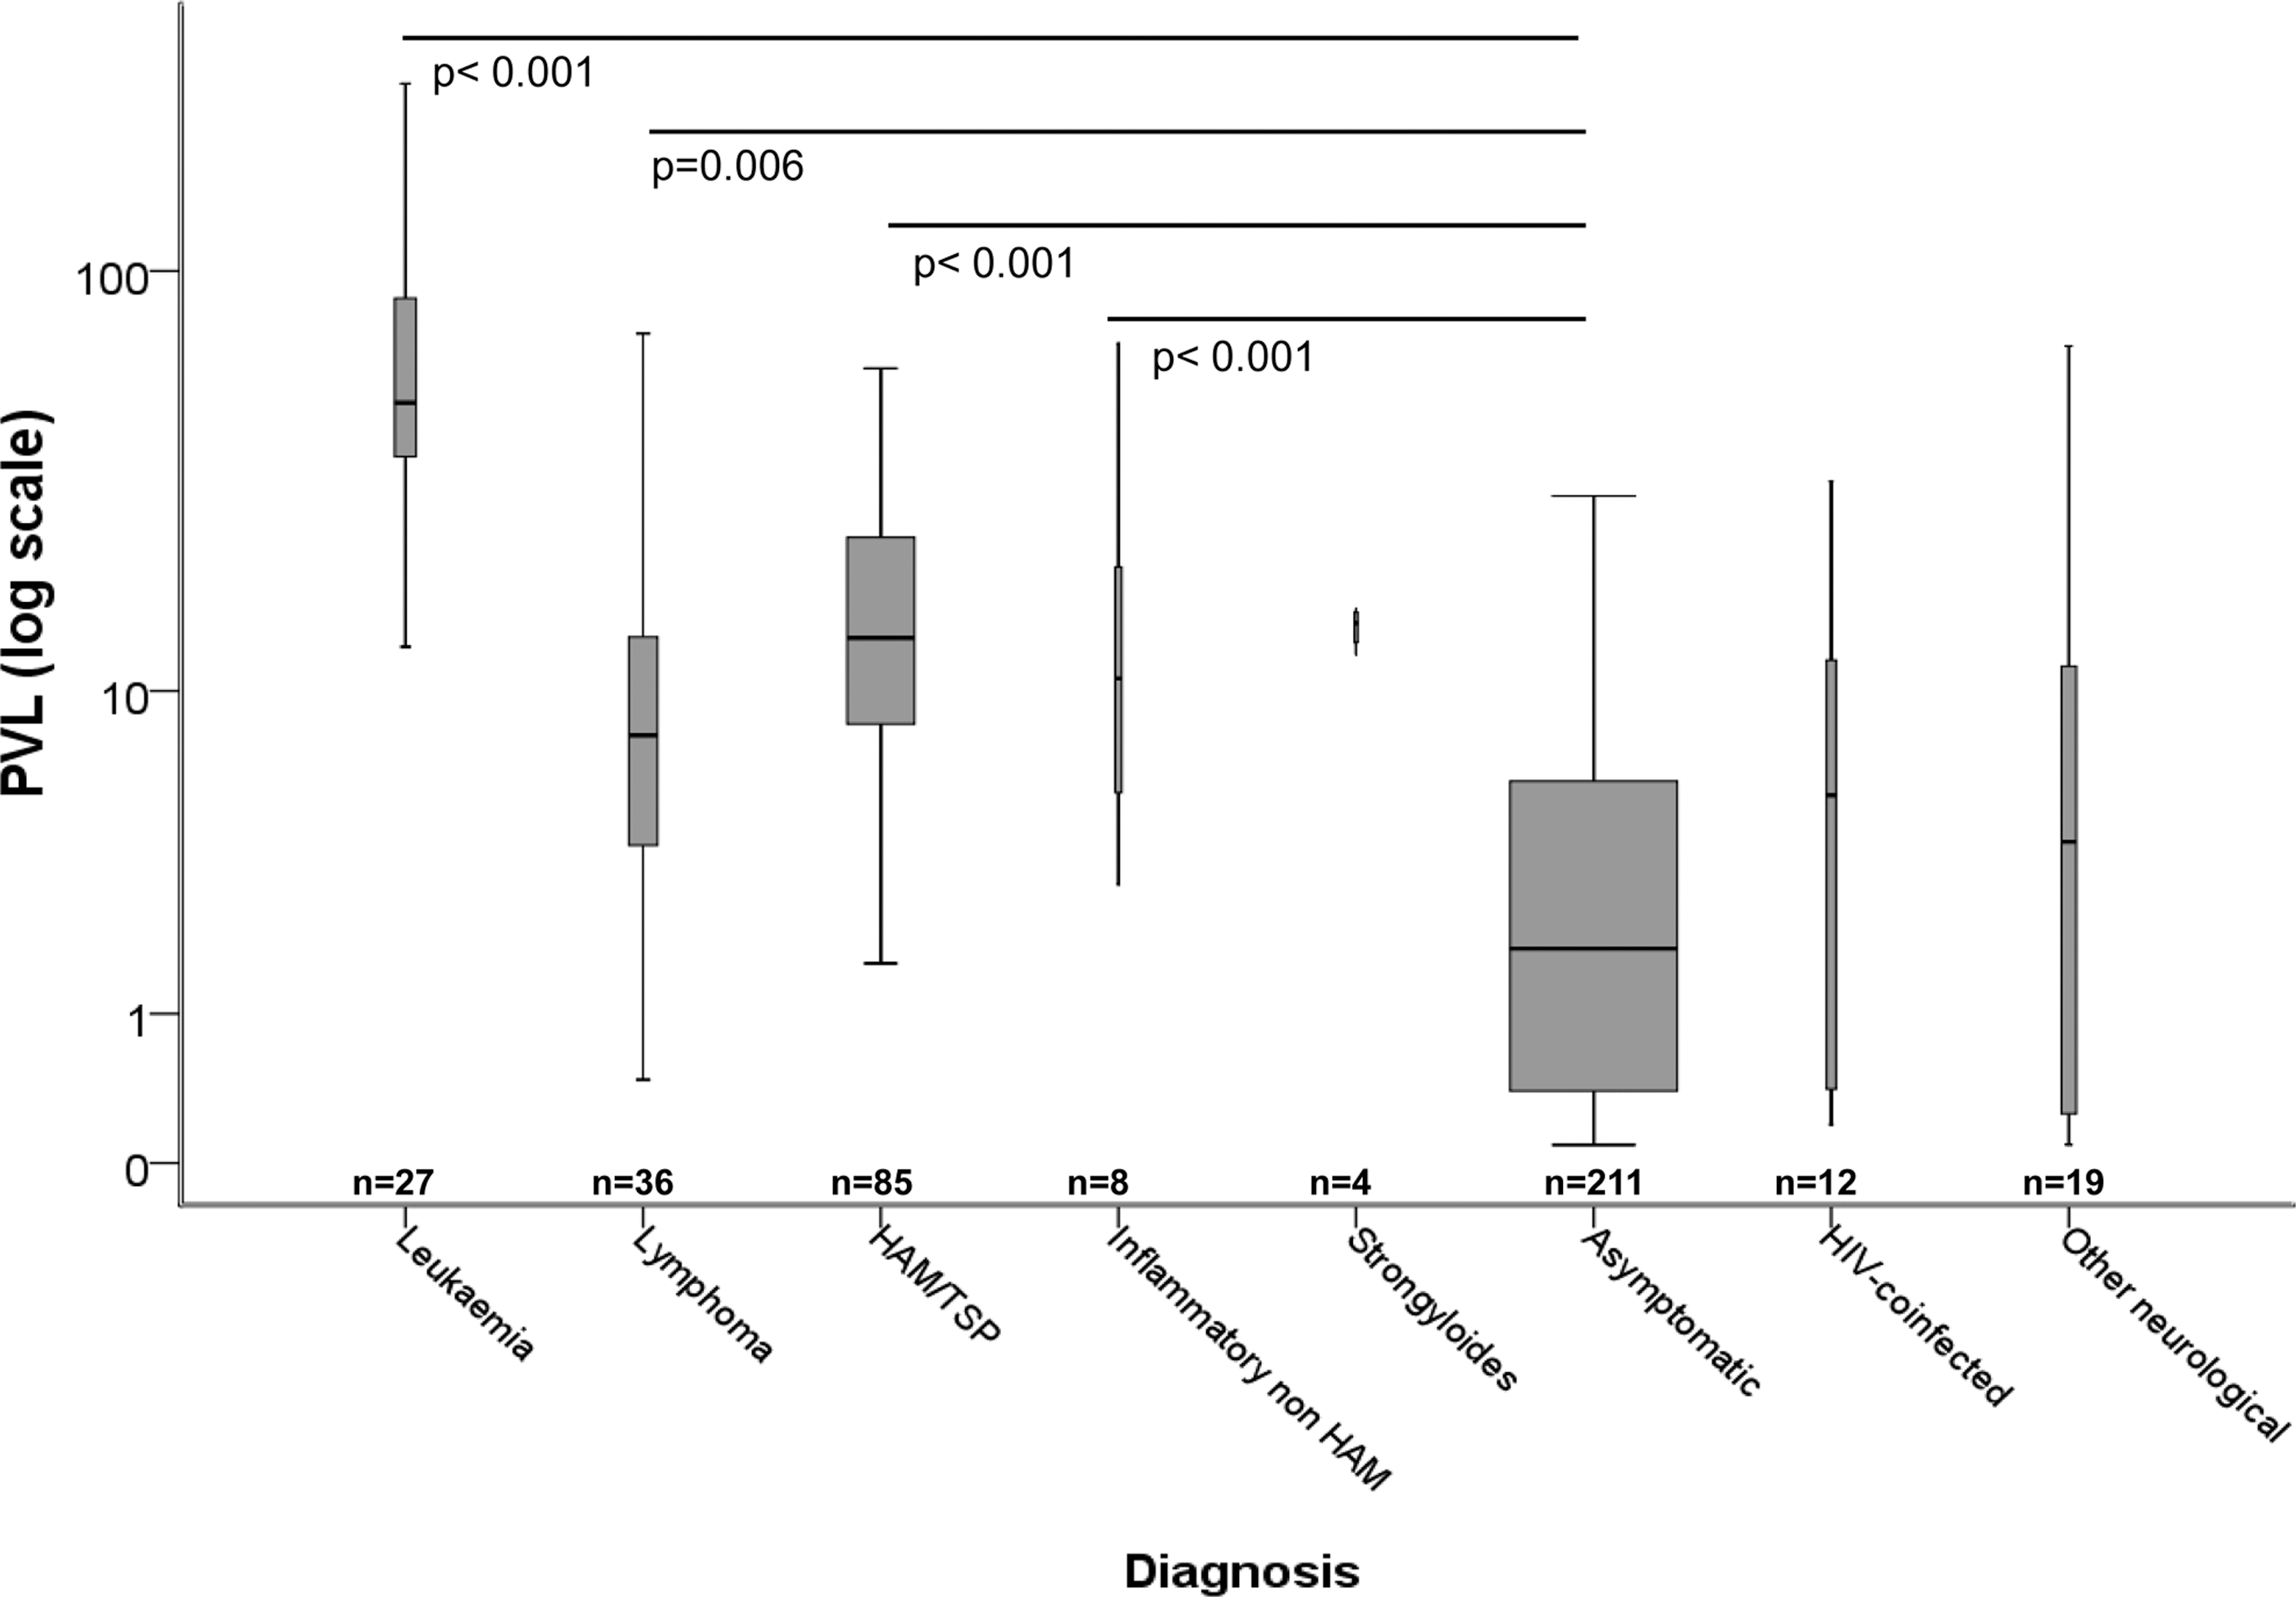
Box-and-whisker plot of mean human T cell lymphotropic virus type 1 (HTLV-1) proviral loads according to disease. The thickness of the box is proportional to the number of individuals. The bar is the median, the box length the 95% CI. and the whiskers the range.
Although numbers were small, patients with non-HAM inflammatory diseases (polymyositis, arthritis, and uveitis) had significantly higher viral load than asymptomatic carriers (p<0.001). There was no significant difference in PVL between asymptomatic carriers and patients with non-HAM neurology (Fig. 2). All four patients with Strongyloidiasis had high PVL (14.8% median).
HTLV-1 PVL in lymph node biopsies
HTLV-1 PVL was measured in lymph nodes from 11 patients (nine with lymphoma, one acute leukemia, one HAM/TSP). HTLV-1 PVL in the lymph node of the patient with HAM/TSP was 0.28 HTLV-1 DNA copies per 100 lymph node nucleated cells (no PBMC sample was available). PVL values in the lymph node of the patient with acute ATLL (62.8%) did not differ from PVL in PBMCs (60.7%). In the nine patients with ATLL lymphoma PVL in the lymph nodes ranged from 28.6% to 276.1% with a median of 81.25%, while PVL in PBMCs ranged from 7.46% to 49.73% with a median of 13.48% (p=0.038). The median ratio of LN PVL to PBMC PVL was 5.1 (1.6–29.9).
HTLV-1 PVL in CSF cells and PBMCs
HTLV-1 DNA was detected and quantified in 58 out of 68 samples of CSF. Where detected, nucleated white cell count in CSF ranged from 10 to almost 100,000/ml. Six of the 10 HTLV DNA-negative CSF samples were acellular: no beta-globin DNA was detected. Where HTLV-1 DNA was detected, the copy number of HTLV-1 DNA per CSF nucleated white cells was 3.3-fold higher than in the paired PBMC sample. In a total of 47 samples from 32 patients with a confirmed diagnosis of HAM/TSP, HTLV-1 PVL was significantly higher in CSF (median 38%) than in paired PBMCs (median 12.2%) with a ratio CSF PVL/PBMCs PVL of 3.3 (p<0.001). Among 11 patients not diagnosed with HAM/TSP, the median PBMCs PVL was 12.1%, CSF 16.3%, and the ratio was 1.6. This difference was not statistically significant (p=0.11) (Table 1).
Viral load distribution
While there was substantial overlap of the range of values between the different patient groups (Fig. 2), viral loads below 1% were, with one exception, observed only in asymptomatic carriers. However, 57% of asymptomatic carriers had a PVL greater than 1%, 15% had a PVL greater than 10%, and in 3% of carriers the PVL was greater than 20% (Table 2). HAM/TSP patients all had a medium or high PVL (greater than 1%), and a majority (61%) had a PVL higher than 10%. All the leukemic patients and 32% of the lymphoma patients had a high PVL (greater than 10%). The remaining patients with ATLL-lymphoma had a PVL between 1% and 10%. Six patients with repeated measures have no detectable HTLV-1 even by nested PCR despite a conclusive HTLV-1 Western blot pattern. Three asymptomatic subjects (positive by nested PCR) had a viral load not detectable by quantitative real-time PCR and were assigned a viral load of 0.001%.
Patient with a diagnosis of cutaneous ATLL (PVL=0.7%).
Trend of PVL over 6.5 years of follow-up in asymptomatic carriers and patients with HAM/TSP
Correlations (R) and regression coefficients (slopes) of PVL with time (days from first sample) were calculated; most of the asymptomatic carriers' R values were concentrated around 0. However, 77% had negative values, albeit minimal, and the average slope of the regression was significantly negative (change in PVL=−0.5±1.1 per year, p<0.001 by Student's t test). In HAM/TSP patients the average slope of the regression was also negative but this was not statistically significant (change in PVL=−0.35±4.48 per year, p=0.61).
These results were supported by the observation that median PVL significantly decreased (p=0.048) in asymptomatic carriers between first (median 1.7%, range 0.001–79.5%) and last measures (median 1%, range 0.001–22.5%). For this analysis, only patients with a minimum of 4 years of follow-up (median=6.5 years) were included. During the same period there was no significant change in the absolute CD4+ lymphocyte or total lymphocyte counts (p=0.704 and p=0.551, respectively). In patients with HAM/TSP no significant decrease in PVL from first to last sample was observed (p=0.36): first PVL (median 14.6%, range 1.2–112.4%); last PVL (median 10.58%, range 1–92.2%).
Discussion
As previously reported, HTLV-1 PVL is highly variable between infected subjects, but significantly higher in patients with the common HTLV-1-associated diseases (HAM/TSP and ATLL) than in asymptomatic carriers. This was also the case for the small number of patients in whom polymyositis, arthritis (for which no other cause was found), and uveitis had been attributed to HTLV-1 infection. Interestingly, in patients referred with HTLV-1 infection and neurological symptoms other than myelopathy or myopathy the PVL pattern resembled that of asymptomatic carriers. Multiple anecdotal cases of neurological disease other than HAM/TSP have been reported in patients with HTLV-1 infection, but determining causation is difficult. Based on these viral load data we suggest that such cases may reflect coincident disease or a pathogenic process independent of high proviral load.
Low proviral loads (<1%) were observed only in asymptomatic carriers. This cut-off agrees with previously published data. 26,33 We therefore speculate that the risk of HTLV-1-associated disease is in those asymptomatic carriers with a PVL above this level, in whom the risk may be 10–15%. Approximately 15% of asymptomatic carriers have a PVL above 10%, and they may be even more likely to develop an HTLV-1-associated disease. Therefore more frequent clinical and laboratory follow-up of the asymptomatic carriers with the highest PVL to identify and treat early manifestations of HTLV-1-associated diseases would seem advisable, allowing a proportionate use of resources.
Our data show that proviral loads in asymptomatic carriers do not increase over time, but actually show a modest, but statistically significant, negative trend (average PVL decrease: 0.5% per year). Since this was independent of any age-related decline in CD4+ T cell count, it suggests that the balance between virus and host may alter, albeit slowly, over time. Our data therefore support the hypothesis that host responses eliminate a portion of the infected cells. 21
As intrapatient variability is low in absolute terms (although it may appear high, particularly at low levels, when measured as CVs), we suggest that any significant variation in absolute viral load should prompt the suspicion of the development of an associated disease, whose diagnosis therefore should be actively sought via history, physical examination, and appropriate diagnostic techniques. Empirically, HTLV-1 PVL is currently used clinically to monitor treatment response in ATLL-leukemia (for early detection of relapse).
At low PVL values, relative marked fluctuations of PVL can be observed, but this is not associated with a positive trend in PVL and neither clinician nor patient should be unduly alarmed by a single measured increase. HTLV-1 increases in a subject over time are likely to be more significant, therefore repeat measures are required to gauge change.
From this study, we suggest treating any significant variation higher than 100% (CV) (since only 10% of the subjects displayed a CV greater than 100%) (Fig. 1) These data can also be used to determine the significance of changes in PVL during treatment, for example, with histone deacetylase inhibitors.
Higher HTLV-1 PVL per CSF cell than per PBMCs has been described as a feature of HAM/TSP. 32,33 These data support this observation, while suggesting that this may be particularly helpful in the diagnosis of atypical cases, if the ratio of CSF:PBMC load exceeds 1.6. In the recent study of ciclosporin for the treatment of patients with HAM/TSP, monitoring of PVL in PBMCs and CSF revealed a selective decrease in CSF PVL associated with clinical response. 34 HTLV-1 PVL in PBMCs can be helpful to rapidly support the diagnosis of ATLL in leukemic presentations, but is not helpful in ATLL lymphoma other than to confirm HTLV-1 infection. However, the higher PVL in lymphoid tissue than in PBMCs of all patients with ATLL-lymphoma would seem to be a useful aid to diagnosis and lends weight to the theory that ATLL arises from a relatively high background proviral load. Since a lymph node biopsy is required to diagnose ATLL, PVL on a section can be useful to rapidly confirm the diagnosis, allowing early treatment of this aggressive disease. As with CSF examination in patients with suspected HAM/TSP, comparison of lymphoid tissue with PBMC PVL is recommended if molecular methods are to be used to support the diagnosis of ATLL-lymphoma.
Footnotes
Acknowledgment
The study was supported by the NIHR Biomedical Research Centre at Imperial College Healthcare NHS Trust.
Author Disclosure Statement
No competing financial interests exist.