
Abstract
The effective role of antiretroviral (ARV) therapy in the regulation of CD4 T cell subset distribution, coreceptor expression, and activation status in individuals with chronic HIV also presenting with active pulmonary TB is not clearly understood. A cross-sectional analysis was performed on a total of 137 South African individuals. CCR5, CXCR4, and CD38 expression of CD4 T cell subsets in HIV-infected individuals with and without active pulmonary tuberculosis (TB) disease, pre- and post-ARV therapy, were determined by flow cytometry. In treatment-naive patients, CD4 T cells showed elevated surface expression of CCR5 and CD38 in TB/HIV coinfection as compared to HIV infection alone despite the overall percentage of CD4 T cells expressing CCR5 being reduced. Total CD38+ CD4 T cells were not significantly increased in either group; however, mean CD38 fluorescence was significantly higher in the context of TB infection. HIV/TB-coinfected individuals also displayed an increased percentage of activated (CD38+) CCR5+ CD4 T cells as compared to HIV patients alone. The naive CD4 T cell subset was depleted similarly in both HIV and HIV/TB groups. Only the HIV treatment group and not the TB-coinfected treatment group showed significantly decreased activated CCR5+ CD4 T cells, an increased percentage of naive T cells, and a decreased percentage of antigen-experienced T cells. This study highlighted an association of TB disease with immune activation, particularly of the CCR5+ CD4 T cell subset in HIV infection and the differential impact of ARV treatment. Further studies are needed to understand how TB coinfection confounds normal responses to ARV.
Introduction
S
Although there was a considerable decline in the regional rate of new infections, the epidemic continues to be most severe in the southern region of Africa. 1
Despite the roll-out of antiretroviral therapy, the burden of this disease remains severe. Tuberculosis (TB) is the leading coinfection in sub-Saharan Africa and is the major cause of death in HIV-infected individuals. 1,2 CD4 T lymphocytes play a key role in the immune response to both HIV and TB. In HIV infection, CD4 T cells are the target cells for viral replication and there is a dramatic loss of this subset following acute infection. 3 In TB infection, expansion of TB antigen-specific CD4 T cells, which can target infected Mycobacterium tuberculosis-infected macrophages, is required for pathogen clearance. 4
HIV infection is known to lead to changes in the distribution of CD4+ T lymphocyte subsets within the peripheral blood and lymphoid tissues. There is a loss of naive T cells and a concomitant increase in the numbers of activated antigen-experienced cells. 5,6 Immune activation is seen as a major driving force in the progression of HIV disease, profoundly impacting T cell function, senescence, and death. 7
The CD4 molecule is the primary cellular receptor for HIV. 8 The chemokine receptors CCR5 (also termed CD195) and CXCR4 (also termed CD184 or Fusin) are the major coreceptors involved in HIV infection and have also been implicated in disease progression. 9 Mycobacterium tuberculosis has also been found to up-regulate coreceptors CCR5 and CXCR4 as previously reported by Rosas-Taraco et al. 10
CCR5 expressing CD4 T lymphocytes are the major target cells of viral replication by subtype C HIV strains in South Africa. 11 Morris et al. found CCR5 to be the major coreceptor used by HIV-1 subtype C isolates from patients with active tuberculosis. 11 There has, however, been a lack of comprehensive screening for normal CCR5 expression on CD4+ T cells in the South African population where HIV-1 subtype C predominates. 12
Use of highly active antiretroviral (ARV) therapy (HAART) results in a rapid decline of viral load, an initial immune reconstitution, as well as a decrease in risk of further morbidity and mortality. 13 –15 HAART has also been shown to decrease the level of immune activation in chronic HIV. 16,17
T cell activation is known to be critical for productive viral infection, as activated T cells are the main targets for HIV. 18 Immune activation status is also a powerful predictor of disease outcome, with high levels of immune activation being more significantly correlated with poor prognosis than either CD4 count or viral load. 19,20 Concurrent infections, such as TB, particularly in Africa, may lead to various degrees of immune activation in vivo, thus enhancing HIV infection and accelerating disease progression, 21,22 which may also contribute to a less efficient ARV therapy-associated restoration of immune components. 23,24 However, little is known about the effective role of HAART in the regulation of coreceptor expression on CD4 T cell subsets, immune activation status, and T cell subset distribution in HIV infection and HIV/TB coinfection in South Africa.
Due to the pivotal role of CD4 T cells in both diseases, it is important to determine if there are differences in responses to ARV by these cells. Failure to normalize CD4 T cell phenotype, function, and/or distribution toward that of uninfected individuals would pose a risk for adverse prognosis in either disease with critical implications for the treatment outcome.
In this article we report on a cross-sectional study performed to assess the effect of ARV on coreceptor expression, activation status, and CD4 T cell subset distribution in peripheral blood of adult South African HIV and HIV/TB-coinfected patients.
Materials and Methods
Patient demographics
Cross-sectional analysis was performed on a total of 137 South African individuals, comprising six groups, as indicated in Table 1. These included 15 healthy normal donors (healthy subgroup), 10 patients with active pulmonary TB disease (PTB subgroup), 33 HIV-1-positive patients, treatment naive and without active PTB (HIV subgroup), 23 HIV-1-positive patients with active PTB (HIV/PTB subgroup), 36 HIV-1-positive patients on ARV (HIV on ARV subgroup), and 20 HIV-1-positive patients with active PTB on ARV (HIV/PTB on ARV subgroup). Approval for this study was obtained from the Health Ethics Research Committee of the University of Stellenbosch (study number N07/08/179).
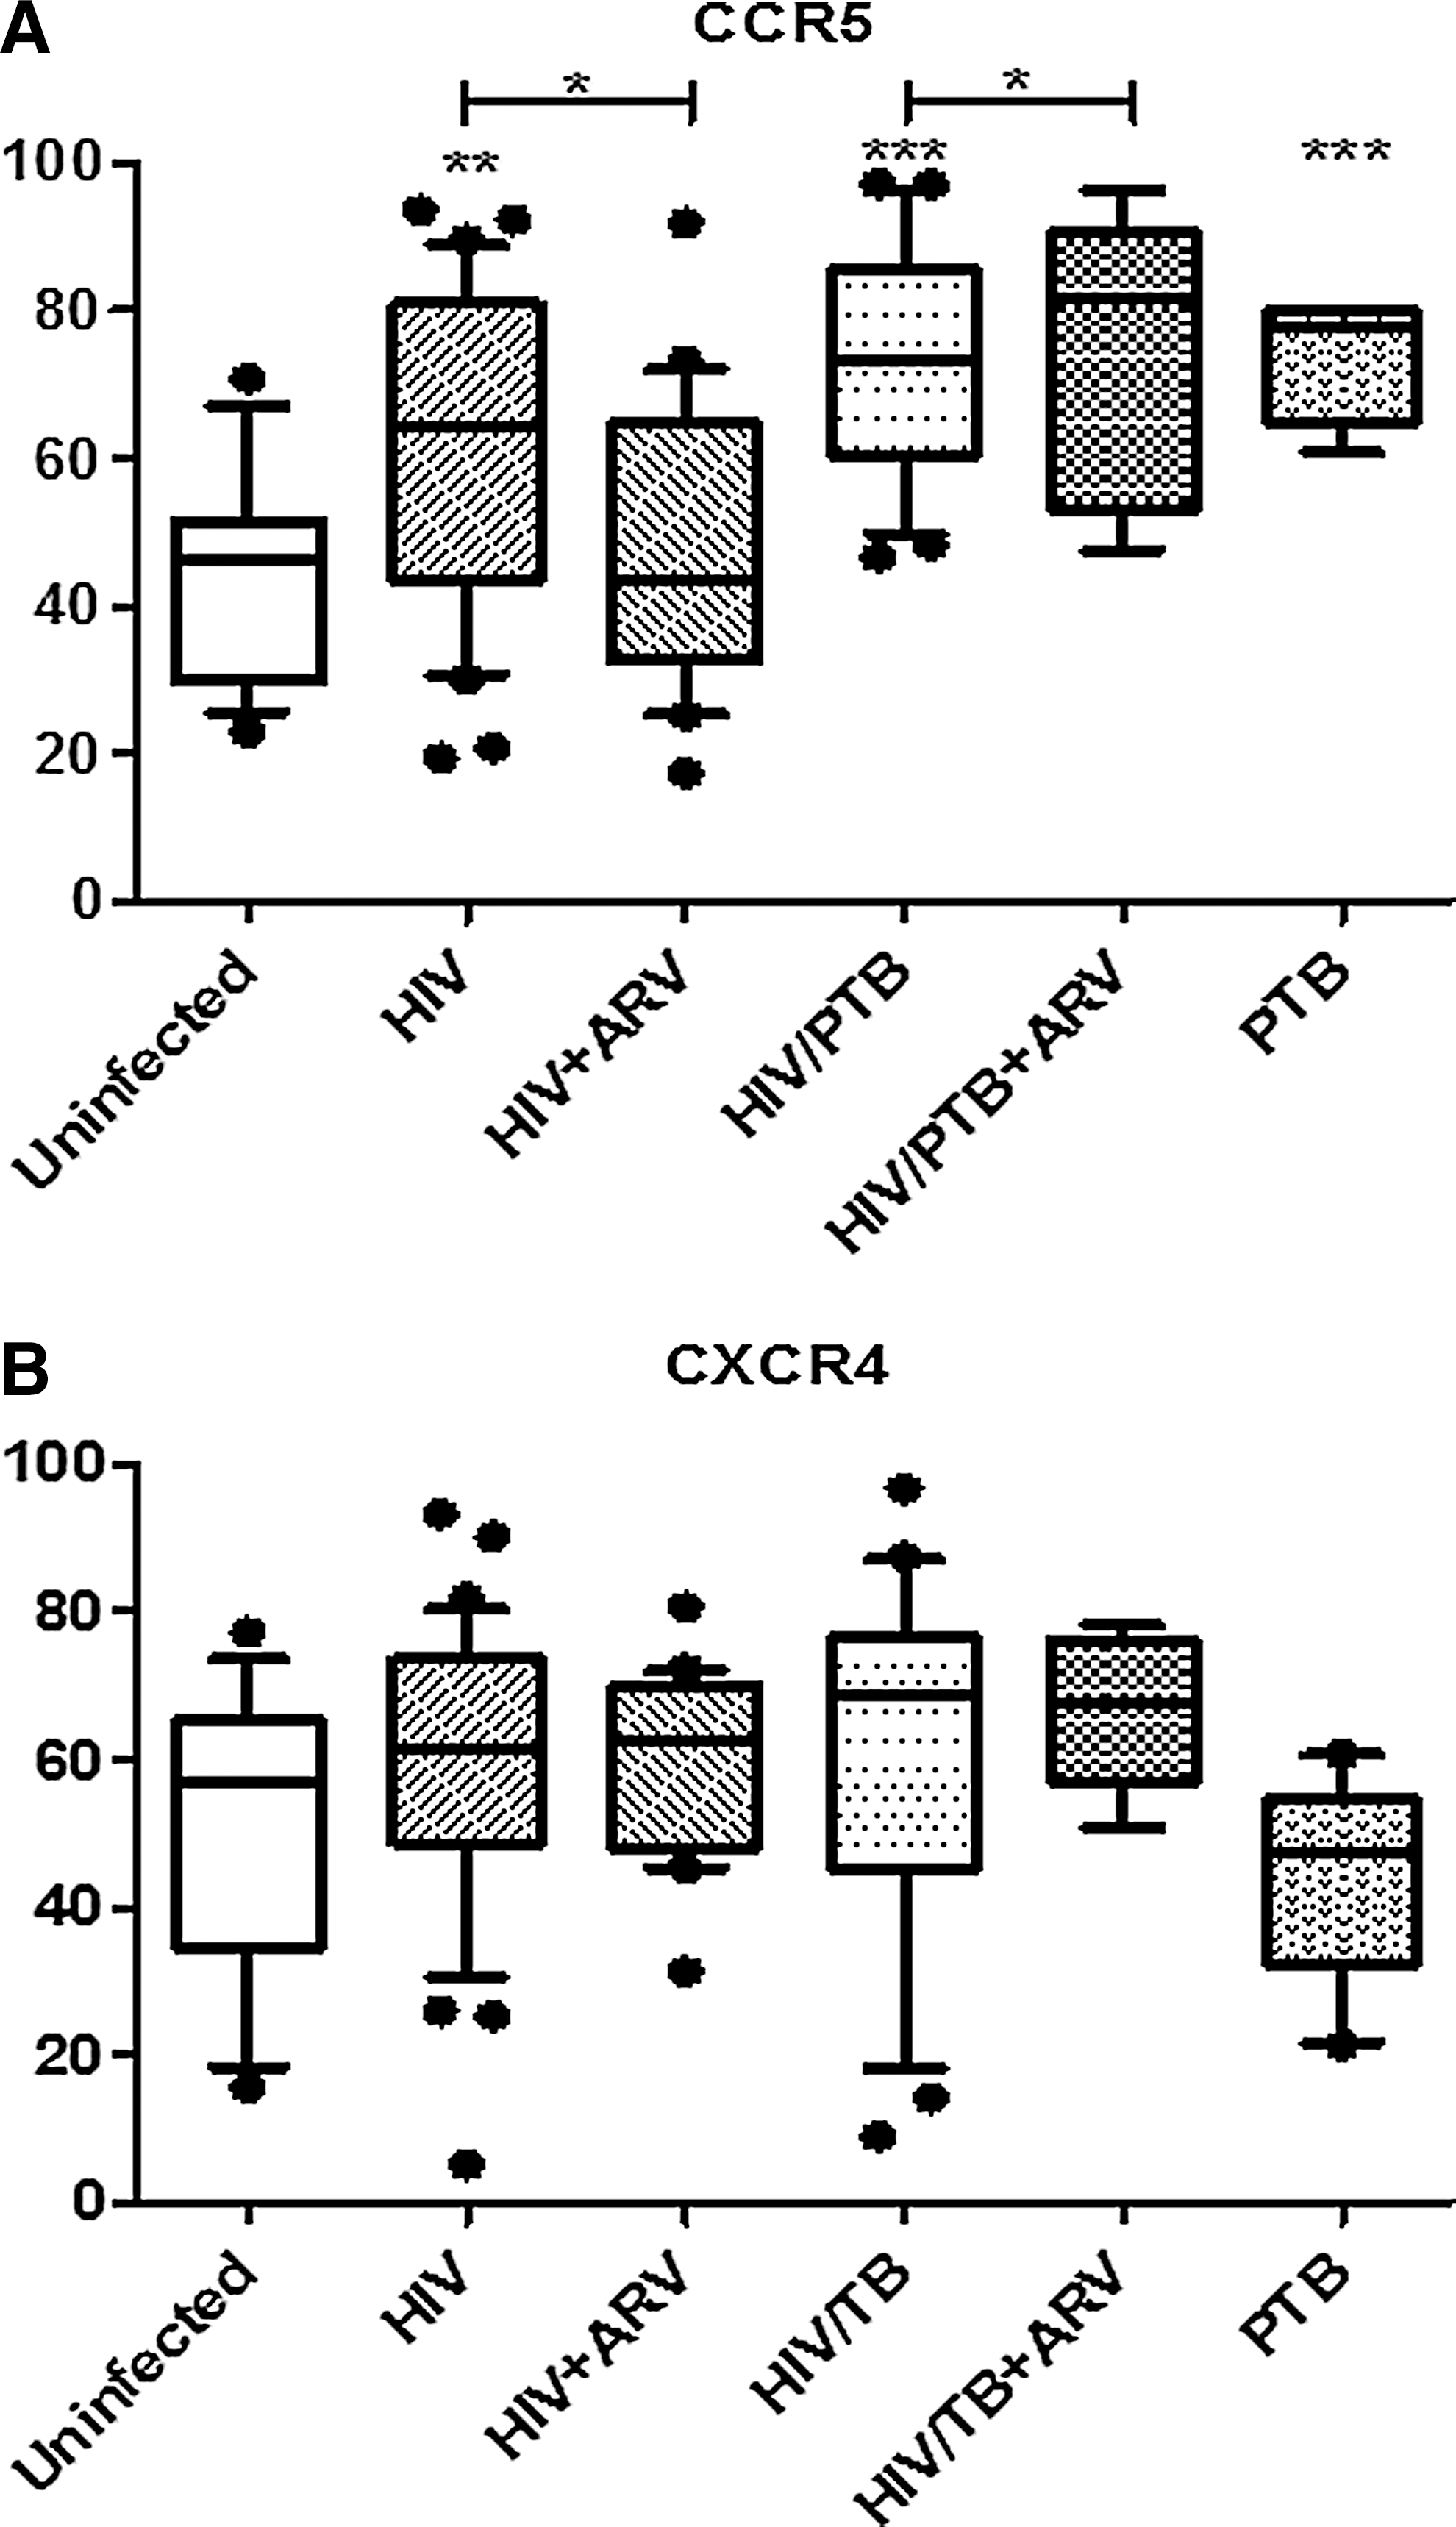
Significance indicated as follows: * p<0.05 and ** p<0.01 as compared to the HIV subgroup without ARV; # p<0.05 and ### p<0.001 as compared to the HIV/PTB subgroup without ARV; † p<0.05 and †† p<0.01 as compared to healthy control group.
CM, central memory; EM, effector memory; AE, antigen experienced; LT, longer term therapy (≥6 months); PTB, pulmonary tuberculosis; ARV, antiretroviral.
Between April and October 2008, blood samples were collected by a qualified research nurse over a 7-month period from the Karl Bremer, TC Newman, and Tygerberg Hospital, all situated in the greater Cape Town Metropole region. The control (HIV-negative) samples were obtained from staff volunteers at the Clinics or among Stellenbosch University staff situated at the Tygerberg campus. Their HIV status was confirmed by HIV-1 serology and normal CD4 count profiles. Samples were collected only if patients agreed to complete and sign the relevant consent forms. Venous blood (40 ml) was collected by venipuncture into EDTA vacutainer tubes (BD Vacutainer, Plymouth, UK). The criterion defining all the noncontrol study subgroups was HIV-positive status, as confirmed through routine voluntary counseling and testing (VCT) at the different hospitals/clinics. Healthy controls and a TB-positive subgroup (of newly diagnosed individuals) who were HIV negative were also included. No specific exclusion criteria were defined for this study. Based on clinical information contained in patient folders and as confirmed by the clinician, active TB was considered in cases of a clinical diagnosis with appropriate radiological evidence of PTB and/or with a positive Ziehl-Neelsen smear result for acid-fast bacilli. Both active PTB groups were on anti-TB medication consisting of 6 months of treatment with a 2-month initial phase (with daily or 3 times weekly isoniazid, rifampicin, pyrazinamide, and ethambutol) and a continuation phase of 4 months (with daily or three times weekly isoniazid and rifampicin).
The ARV therapy regimen for the majority of individuals (71% of total) was stavudine (d4T), lamivudine (3TC), and efavirenz (EFV). The remainder (29%) were on d4T, 3TC, and nevirapine (NVP).
Methods
Uncoagulated fresh blood samples in EDTA tubes were centrifuged at 500×g for 10 min to extract plasma for viral load and HIV serology and to concentrate the cellular fraction. Peripheral blood mononuclear cells (PBMCs) were than isolated using a modified Ficoll-Histopaque method as first described by Boyum. 25
Standard HIV diagnostic tests were performed to determine and/or confirm HIV serology. Amplification and detection of plasma viral loads were performed according to the manufacturers' instructions to determine plasma HIV RNA levels as previously described by Yao J et al. 26
Freshly extracted PBMCs were labeled with fluorochrome-conjugated monoclonal antibodies prior to flow cytometric analysis. The following fluorochrome-conjugated antibodies were used in the current study: CD4-PerCP (clone SK3, mouse IgG, K; BD Biosciences, San Jose, CA), CD45RA-FITC (Clone JS-83, mouse IgG1, K; eBioscience, San Diego, CA), CD27-APC (clone 0323, mouse IgG1, K; eBioscience), CD38 (clone H1T2, mouse IgG1, K; eBioscience), CCR5-PE (clone R22 / 7, mouse IgG1, K; BD Biosciences), CXCR4-PE (12 G5, mouse IgG2a, K; BD Biosciences), and CCR5-APC (clone 3A9, mouse IgG2a, K; eBioscience). A total of 5×10⁵ PBMCs were used for each staining procedure. The staining protocol used in the study allowed for characterization of CD4 T cells into naive (N, CD45RA+, and CD27+), effector memory (EM, CD45 RA−, and CD27−), central memory (CM, CD45 RA−, CD27+), and effector (E, CD45 RA+, and CD27−) subset populations. In analysis of data the term “antigen experienced” was applied to all cells falling in the EM, CM, and E categories. In addition, chemokine receptor expression (CCR5, CXCR4) and activation status (CD38 expression) of CD4 T cells were determined. All stained cells were analyzed on a BD FACSCalibur flow cytometer with CellQuestTM software (BD Biosciences, San Jose, CA).
Optimization of flow cytometry included manual compensation using single stained and mixed antibody preparations. Fluorescence minus one (FMO) procedures were also performed to ensure correct designation of positive vs. negative marker expression. Instrument settings generated following compensation and FMO procedures were then used for the duration of the study. Mean fluorescence intensity (MFI) data were standardized using a commercial blood preparation (Lymphosure, Synexa Life Sciences, South Africa). On each acquisition the MFI values for the CD38 marker expression of the Lymphosure specimen were aligned with those initially acquired. Lymphocytes were identified by gating on the lymphocyte population in the forward vs. side scatter plot and CD4 lymphocytes were gated based on CD4 expression (Fig. 1). Back-gating from the CD4 T lymphocyte gate illustrated an absence of monocytes within the gated area. Subsets of CD4 T cells were defined based on CCR7 and CD45RA expression and CD38, CCR5, and CXCR4 expression was assessed on total CD4 T cells and on the four subsets (Fig. 1).
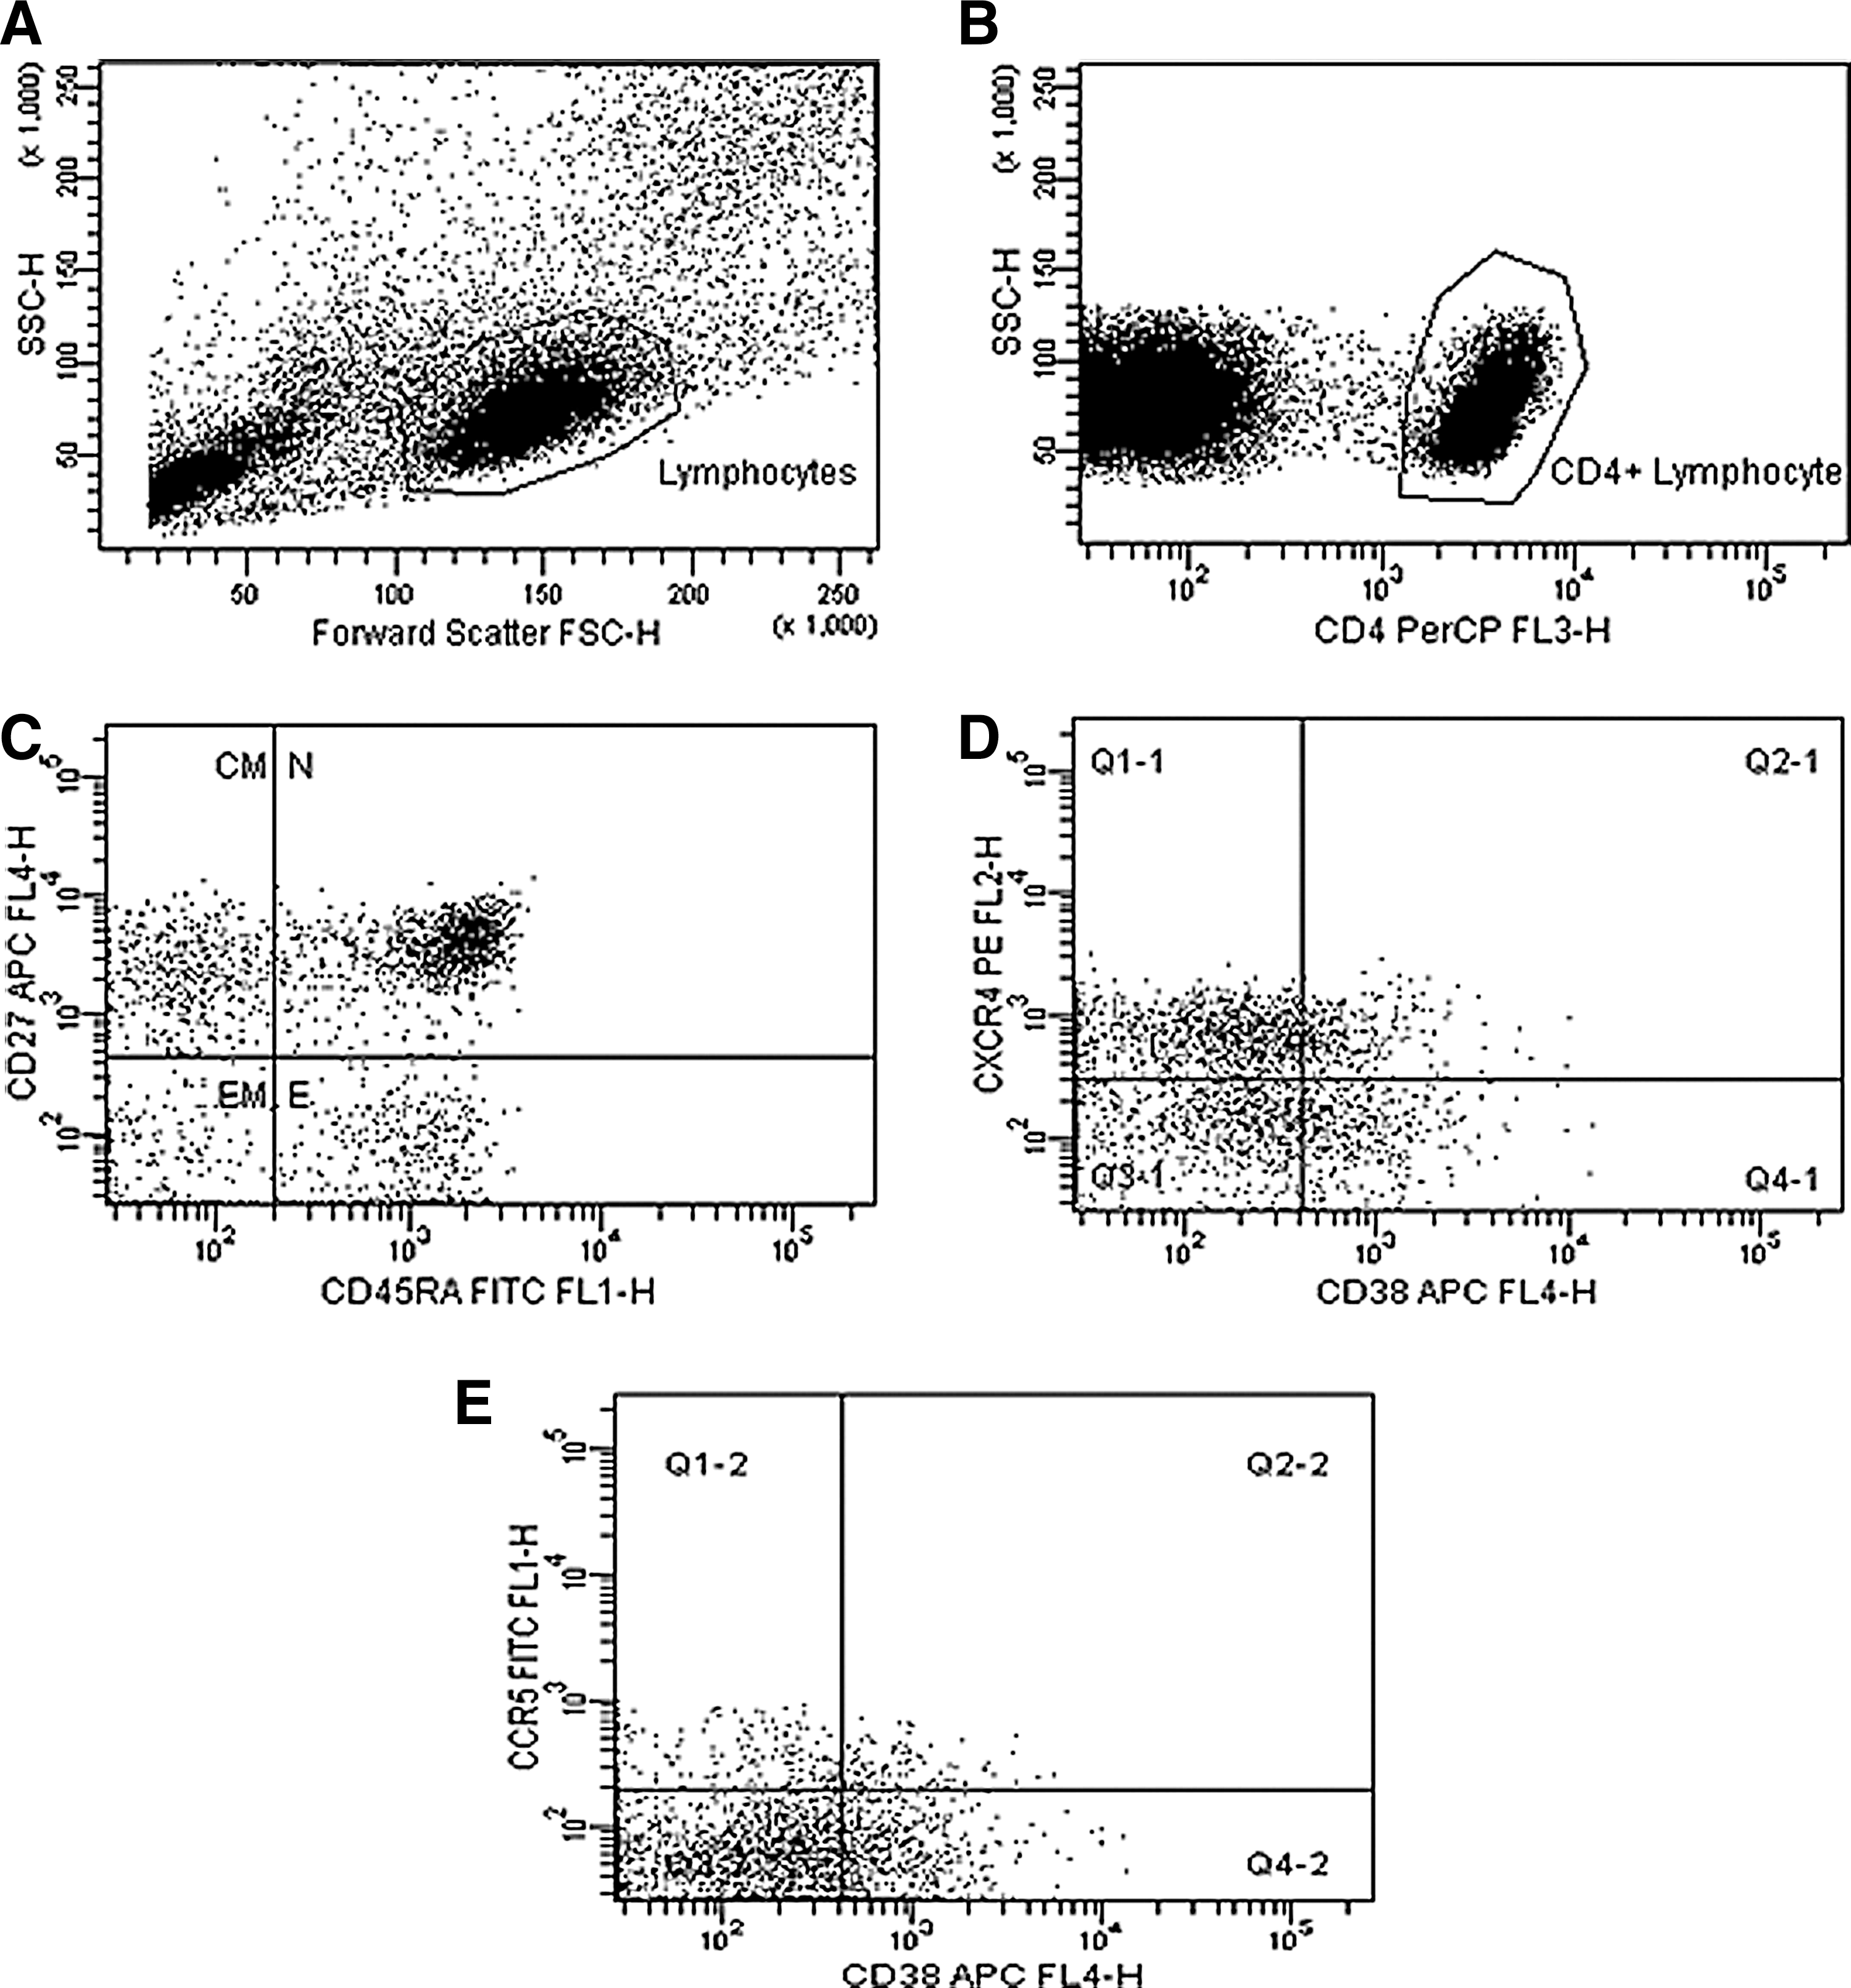
Representative gating strategy and analysis of CD4 T cell subsets and expression of the activation marker CD38 and chemokine coreceptors (Patient 109990).
During flow cytometric analysis, 100,000 total events or 50,000 lymphocyte-gated events were acquired for each sample. The CD4 T count procedure was performed using BD Multitest reagent CD3-FITC/CD8-PE/CD45-PerCP/CD4-APC (BD Biosciences, San Jose, CA). Whole blood was stained in TruCount tubes containing microbeads for enumeration of human T lymphocytes.
Statistical analysis
One-way ANOVA was performed to compare measurements between different subgroups. Post-hoc comparisons were done using Fisher's least significant difference (LSD). To determine relationships between different measurements, Spearman correlations were calculated. A 5% significance level (p<0.05) was used as a guideline for determining significant relationships. Statistical calculations were performed using Statistica (Statistica Software, Inc., Tulsa, OK) and GraphPad Prism (GraphPad Software, Inc., La Jolla, CA).
Results
Demographic and immunological characteristics of individual subgroups
The median age of individual donors was 35 years (range 19–65 years), and the female gender was predominant across all subgroups. The median duration of antiretroviral treatment was 6 months (range 1–48 months) in the HIV on ARV subgroup and 2.5 months (range 1–12 months) in the HIV/PTB-coinfected on treatment subgroup. The median duration of TB treatment was 1 month (range 3 weeks–7 months) in the HIV/PTB-coinfected subgroup and 3.5 months (range 2–6 months) in the HIV/PTB subgroup on ARV. To ascertain whether shorter ARV therapy time was a factor in our findings, a subset of the treatment groups with therapy ≥6 months was analyzed separately (Table 1). Differences in terms of CD4 count were insignificant between the HIV subgroup and the HIV/PTB subgroup without ARV.
The median CD4 count in individuals with active PTB (in the absence of HIV infection) was found to be lower than the healthy control subgroup (544 vs. 1,408 cells/μl; p<0.005). The CD4 count of the HIV and HIV/PTB groups were lower than the PTB group (173.5 and 115.5 vs. 544 cells/μl, respectively). In naive patient subgroups, the median viral load was 3.95-fold higher in the HIV/TB subgroup as compared to the HIV subgroup (71,000 copies/ml vs. 18,000 copies/ml).
In patient subgroups on treatment, however, the CD4 count was found to be higher in the HIV on ARV subgroup (median 235.5 cells/μl) compared to the HIV/PTB on ARV subgroup (median 141 cells/μl; p<0.05). The median viral load in both the HIV and HIV/PTB subgroups on ARV was decreased to an undetectable limit (≤357 copies/ml).
Coreceptor expression, activation marker expression, and CD4 T cell subset distribution in individual subgroups
The MFI of CCR5 expression and CD38 expression on CD4 T cells (Figs. 2 and 3) in the HIV/PTB-coinfected subgroup (mean MFI=67 and 85.3, respectively) was significantly higher than the HIV-infected subgroup (mean MFI=48.9 and 55.2; p<0.05) and healthy controls (mean MFI=43.1 and 47.9; p<0.005).

Comparison of CCR5 expression on CD4+ T cells in individuals within donor subgroups. Freshly extracted peripheral blood mononuclear cells (PBMCs) were stained with CD4-PerCP, CD45RA-FITC, CD27-APC, and CCR5-PE. For flow cytometric analysis, 100,000 total events or 50,000 lymphocyte-gated events were acquired per sample. Data are expressed as means with SEM of percentage CD4 cells positive for CCR5 and CCR5 mean fluorescence intensity (MFI; indicating the fluorescence intensity of CD4 T cells expressing CCR5+). Comparison of measurements between different subgroups was performed with a one-way ANOVA test and post-hoc comparisons were done using Fisher's least significant difference (LSD).

Comparison of CD38 expression on CD4+ T cells [% CD4 T cells expressing CD38
Despite the overall reduction in CCR5+ CD4+ T cells, the percentage of CCR5+-activated cells (expressing CD38) within this cell subset was found to be significantly increased in the HIV/PTB (74.6%) and HIV subgroups (61.4%) compared to healthy controls (43.8%; p<0.005) (Fig. 4). Conversely, activated CD4 T cells expressing CXCR4+ did not differ significantly within the donor subgroups (Fig. 4).
Comparison of mean percentage positive activated (CD38+) CD4 T cells expressing CCR5+
The percentage of naive CD4 T cells in the HIV (16%) and HIV/PTB-coinfected subgroups (14.4%) (Table 1) was substantially decreased compared to healthy controls (40.7%; p<0.001). The percentage of CM CD4 T cells (Table 1) was considerably lower in the HIV/PTB (9.3%, p<0.001) and HIV subgroups (13.0%, p<0.005) compared to healthy controls (20.8%). The percentage of EM CD4 T cells was higher in the HIV/PTB subgroup (59.2%) compared to the HIV-infected subgroup (45.0%, p<0.05) and healthy controls (14.6%, p<0.001).
CXCR4 expression of the naive T cell subsets was lower in the HIV/PTB (26.2%) and HIV subgroups (24.1%) compared to healthy controls (44.6%). Expression of CCR5 and CXCR4 on the effector CD4 T cell subset was higher in the HIV subgroup (37.1% and 41.8%) compared to the HIV/PTB subgroup (29.1% and 29.9%) and healthy controls (33.2% and 30.2%) (Table 2).
CD4+
Significance is as follows: * p<0.05 as compared to the HIV subgroup.
Effect of ARV on coreceptor expression, activation marker expression, and CD4 T cell subset distribution in individual patient subgroups
To assess the effect of ARV on coreceptor expression, the levels of CCR5, CXCR4, and CD38 expression as well as CD4 T cell subset distribution were compared based on the duration of ARV treatment within individual subgroups on ARV and without ARV. Twenty HIV-infected patients and six HIV/PTB-coinfected patients were selected from the total with ≥6 months of ARV therapy.
Overall, the data on the effect of ARV indicate a nonsignificant decrease of percent CCR5 and CD38 and the per cell expression of these markers (data not shown), with the only significant change being decreased per cell CXCR4 expression in the HIV/PTB on ARV subgroup (p<0.05).
A moderately higher number of CCR5+ cells, as a percentage of CD4 T cells, in all patients on ARV therapy was observed for both the HIV and HIV/PTB subgroups when compared to the naive patients; however, this was not statistically significant (Table 1). There was no change in the total activated (CD38+) CD4+ T cells following ARV treatment (≥6 months) (Table 1). Activated (CD38+) CCR5+ CD4 T cells were, however, found to be significantly reduced in the HIV subgroup on ARV (p<0.05) but not in HIV/PTB subgroup on ARV (Fig. 4).
Statistical analyses revealed the same trends in patients with less than 6 months of treatment.
A significant elevation of the total percentage of naive CD4 T cells (p<0.05) was observed in the HIV subgroup on treatment, but not the HIV/PTB group. Effector T cells showed a significant increase in the HIV on ARV subgroup (p<0.005), but not in the HIV/PTB on ARV subgroup (p<0.05). Central memory T cells were significantly augmented (p<0.05) in the HIV on ARV subgroup, but not in the HIV/PTB subgroup. EM and antigen experienced CD4 T cells were significantly diminished (p<0.005 and p<0.005, respectively) in the HIV on ARV subgroup, but this was not the case in the HIV/PTB subgroup (Table 1). CCR5+ antigen-experienced cells were also found to be significantly reduced (p<0.05) in the HIV on ARV subgroup as compared to the untreated HIV subgroup (Table 2).
Correlation of coreceptor expression, immune activation, and T cell subset distribution
Significant positive relationships were observed between CCR5 and CD38 expression (r=0.59, p<0.001) and CXCR4 and CD38 expression (r=0.55, p<0.001) on CD4 T cells, confirming the importance of activation in the up-regulation of chemokine receptors.
The percentage of activated CCR5+ expressing CD4 T cells was positively related to the percentage of antigen-experienced CD4 T cells (r=0.40, p<0.001) and was negatively associated with the percentage of naive CD4 T cells (r=−0.30, p<0.001).
Discussion
In the current study we report changes in CD4 T cell subset distribution in the peripheral blood of South African patients undergoing ARV therapy and the impact of TB coinfection. Shifts between maturational subsets of CD4 T lymphocytes in a cross-sectional study are indicative of the plasticity of phenotype designations; however, clear differences in subset distribution do aid in understanding disease-associated immune cell dysregulation. The results described in this study are similar to those previously reported by Juffermans et al. and Wolday et al. 27,28 who found increased per cell expression of CXCR4 and CCR5 on CD4 T cells in HIV-infected patients with active TB. Our findings, however, contrast with those of Shalekoff et al. and Hanna et al., 29,30 who could not demonstrate elevated CCR5 expression on CD4 T cells in HIV/TB coinfection.
During active tuberculosis, infected macrophages induce stimulation of TH1 cells to produce proinflammatory cytokines, which in turn can activate infected macrophages, but can also lead to increased CCR5 expression on CD4 T cells. 31,32 Consequently, during HIV/TB disease there are more activated CD4 T cells available for targeting by the virus because of the amplification of immune activation generated by the two infections. 33 Morris et al. demonstrated that R5 viral variants were preferentially recovered from patients with active TB. 22 This can be related to the increased CCR5 expression on CD4 T cells and activated CCR5-expressing T cells found during HIV/TB disease.
The positive correlation between CCR5 and CD38 expression in this study (Spearman coefficient of correlation: r=0.59, p<0.001) confirms that of Ostrowski et al. who previously reported a similar positive relationship when evaluating the levels of CCR5 and CXCR4 expression in HIV-infected patients. 34
The significant reduction of naive CD4 T cells and the synchronous elevation in the percentage of antigen-experienced CD4 T cells observed in both the HIV and HIV/TB subgroups compared to healthy controls in this study confirm that HIV leads to disruption in T cell distribution and homeostasis 35 and that TB is an exacerbating factor in this process.
In HIV-infected and HIV/PTB-coinfected patients on ARV, CCR5, and the immune activation marker CD38 display the same trend, i.e., reduced expression (data expressed as mean MFI). CCR5 expression decline may be considered the consequence of decreased immune activation status as previously demonstrated by several groups. 36 –38 In patients on ARV, the change of CCR5 and CD38 expression was not statistically significant as also reported by Briz et al. when longitudinally examining HIV-infected patients on ARV. 39
Despite the suppression of plasma viral load to undetectable limits in a subset of the ARV treatment group, with ≥6 months of ARV, and a reduction in the percentage of activated CD4 T cells expressing CCR5+ and decreased CCR5 coreceptor expression, ARV did not restore expression levels to those observed in healthy controls. Previous studies have demonstrated the identical phenomenon. 36 –41 This indicates that there is a loss of CCR5-expressing CD4 T cells that is never fully replenished and also that immune activation continues despite an undetectable viral load. Recently Cassol et al. reported the persistence of microbial translocation and immune activation in HIV-1-infected South Africans receiving combination antiretroviral therapy. 42
The gastrointestinal tract (GIT) damage model now current in HIV pathobiology implies continued leakage of bacterial components from the GIT and associated chronic innate immune stimulation. This model suggests that activation would continue to some extent even when viral load is under control. 43,44
This discordance between viral suppression and immune activation in patients on ARV treatment raises the question of what would serve as a more accurate indicator when monitoring ARV response. Interestingly, previous studies have demonstrated that the natural host species of simian immunodeficiency viruses (SIV), Sooty Mangabeys, and African Green Monkeys, which do not develop immunodeficiency, display reduced T cell activation despite high levels of viremia in comparison with SIV infection of nonnatural host species, such as rhesus macaques (RM). 45,46
Treating HIV/AIDS by down-regulating immune system activation would be beneficial as previously suggested by Lori. 47 Additional monitoring of ARV responses using immune activation biomarkers added to the classic indicators currently used may help to better assess the outcome of ARV.
A significant increase of naive CD4 T cells and a decrease of antigen-experienced CD4 T cells in HIV-treated patients when compared to the naive HIV-infected patients, suggestive of a normalization of T cell distribution after initiation of ARV, has been demonstrated in this study. Previous studies have reported similar findings. 14,48 Increased percentages of naive CD4 T cells after ARV treatment in HIV infection were still far from the percentage of naive CD4 T cells found in healthy controls. This is in accordance with previous reports 49,50 that demonstrated that T cell turnover is decreased after 12 months of ARV, but the naive cell subset does not normalize despite suppression of viral load. The limitations of this study were the cross-sectional nature of the study, low numbers of individuals in subgroups, and the lack of data on specific coinfections other than TB. The mean duration of antiretroviral treatment differed between the HIV and HIV/PTB groups, resulting in the observed differences in immunological parameters due to differing lengths of therapy. Although time on therapy cannot be eliminated as a factor, statistical analyses of patients with more than 6 months of treatment alone revealed the same changes as reported overall.
To our knowledge, this study is the first to assess the effect of ARV on coreceptor expression, in vivo immune activation-associated surface marker expression, and CD4 T cell subset distribution in HIV/PTB coinfection. In HIV/PTB-coinfected patients with ≥6 months of ARV there is a partial reduction of immune activation marker and HIV coreceptor expression. In HIV/PTB patients on antiretroviral therapy, the proportion of naive to antigen-experienced CD4 T cells did not normalize to the same extent as seen in the HIV group on treatment. This observation may indicate a clear negative influence of HIV/PTB disease on ARV treatment outcome and explain the reason why treatment of HIV/PTB-coinfected individuals does not seem to display the same expected changes as observed in HIV infection alone.
Further longitudinal studies are needed to investigate how the elevated immune activation status found in HIV/PTB disease may impact ARV treatment outcome.
Footnotes
Acknowledgments
We would like to thank all the study participants and the staff of the hospitals for their help in completing this work. This study was supported by the NHLS research trust of South Africa. We acknowledgment the following colleagues for their practical contribution to this study: Santhoshan Pillay, Jan de Witt, Ronell Taylor, and all NHLS medical laboratory technologists in the virology diagnostics laboratory, Tygerberg.
Preliminary results were published as the following Poster abstract: J.P. Kabue et al. AIDS Res Hum Retroviruses 2008;24(S1):1–175. Poster abstract: P15-30.
Author Disclosure Statement
No competing financial interests exist.