
Abstract
Induction of HIV-1-specific cytotoxic T lymphocyte (CTL) responses largely depends upon the presentation of CTL epitopes to the CD8+ T cells aided by a large number of different HLA class I alleles. Although several studies showed the clustering pattern of HIV-1 CTL epitopes, the underlying reason for this tendency remains unresolved. Moreover, the hypothesis that the CTL epitope clusters tend to coincide with the conserved and hydrophobic regions of HIV-1 proteins has been challenged in recent times. The present study aims to characterize and compare the HIV-1 CTL epitope clusters in terms of restricting HLA alleles, hydrophobicity, and sequence conservation in a proteome-wide manner by including a large number of experimentally validated CTL epitopes from the HIV Molecular Immunology Database. CTL epitope cluster distribution analysis in a proteome-wide manner revealed that only two HIV-1 proteins, namely Nef and Gag, have significant cluster-forming capacity where their epitope localization coincides with the hydrophobic and conserved regions. Furthermore, analyses of proteasomal cleavage sites and HLA anchoring motif frequencies in the epitope-dense regions highlighted the role of specific HLA supertypes such as HLA B*07, HLA B*58, HLA A*02, and HLA A*03 in selecting the hydrophobic and conserved amino acid positions within Nef and Gag proteins to be presented as epitopes. Based on our results, we hypothesize that the cluster-forming tendency of HIV-1 CTL epitopes is not a proteome-wide feature confined to Nef and Gag proteins. Their cluster-forming tendency largely depends on the host HLA alleles that contribute significantly in selecting functionally constrained hydrophobic regions within the HIV-1 proteome.
Introduction
I
With the advancement of modern immunological techniques, a large number of HIV-1 CTL epitopes and restricting HLA alleles have been identified as well as deposited in various databases including the HIV molecular immunology database (
Although several studies, including the one conducted by Yusim et al., indicated the cluster-forming tendency of HIV-1 CTL epitopes, 7 the underlying reasons for this tendency remain largely unknown. Despite the contribution of different HLA alleles in selecting the overlapping amino acid positions in HIV-1 proteins is gradually being revealed, no association has been drawn between HLA alleles and the HIV-1 CTL epitope clustering pattern. A few HLA alleles such as B*57, B*27, B*52, and A*25 have been proposed as protective alleles whereas B*35 has been implicated as a risk allele. 8 –13 In recent years, this phenomenon signifying the involvement of HLA alleles in the control of HIV-1 has been reconfirmed by whole genome association studies. 14,15 Among the three HLA class I molecules, HLA-B is considered to be the most important factor for restricting HIV disease progression since HLA-B-restricted epitopes appear to be immunodominant and are more conserved than epitopes restricted by HLA-A and C. 16 –18
Furthermore, the conservation and hydrophobic pattern of the CTL epitope clusters within HIV-1 proteome have not been established unambiguously. Hughes and Hughes proposed that CTL epitopes tend to be more conserved and hydrophobic than the remaining portion of the source proteins. 19 In harmony with this hypothesis, Hughes and Silva and Lucchiari-Hartz et al. concluded that the Nef-CTL epitope clusters tend to coincide with hydrophobic and conserved regions, whereas the noncluster regions are predominantly hydrophilic. 20,21 In contrast to the notion that HIV CTL epitopes show a tendency to cluster and coincide with conserved and hydrophobic regions of the proteins, a more recent study based on computationally predicted epitopes revealed that the distribution of CTL epitopes and hydrophobic amino acids in 99% of the HIV-1 protein sequences follows a random pattern and was indistinguishable from the distribution of CTL epitopes in proteins from other proteomes such as hepatitis C virus (HCV), influenza, and three eukaryote proteomes (human, Drosophila, and yeast). 22
The current study involved systematic mining of the thousands of experimentally validated CTL epitope maps deposited in the HIV molecular immunology database (
Materials and Methods
Construction of the HIV-1 CTL epitope dataset and retrieval of HIV-1 protein sequences
The complete list of all experimentally verified HIV CTL/CD8+ epitopes, mapped to within a region of 14 amino acids or less, including the best defined epitopes and their relevant information including amino acid position and restricting HLA alleles, was obtained from the HIV molecular immunology database (
Identification of the Epitope-Dense and Epitope-Poor regions by the cumulative binomial probability method
The regions within each HIV-1 source protein have been identified as Epitope-Dense or Epitope-Poor by the cumulative binomial probability (CBP) method as described by Schmid et al.
22
Briefly, this method counts the number of epitope C-terminals (e) within a window of a fixed size (w) and calculates the probability (P) of finding one or more C-terminal(s) within the same window of size (w). The calculated probability P is the cumulated binomial probability given as
where f is the average density of C-terminals and
is the binomial operator. However, in our case, the average density of C-terminals (f) was calculated based on all HIV proteins, which assisted the comparison among the proteins. The region with calculated probability less than 0.05 (p<0.05) was declared as the Epitope-Dense region. To calculate the Epitope-Poor region, the calculation was repeated but in this case the number of non-C-terminals was considered where f was redefined as the average number of non C-terminal positions; e is the number of non C-terminal positions within the window. If it was decided that a region was to be neither dense nor poor, we declared the region as average.
Assessment of the sequence variability within the HIV-1 proteome by calculating Shannon entropy scores
The entropy in each HIV-1 source protein reflects the variability of amino acids in each position. Shannon entropy for each position in the premade protein alignment was calculated by the formula described by Yusim et al.
7
Briefly the prealigned sequences of each HIV-1 protein were obtained and the Shannon entropy EN
in each position was calculated as
where
Determination of the hydrophobicity pattern of HIV-1 proteins
The hydrophobicity value for each position within each HIV-1 source protein was calculated using the algorithm by Abraham and Leo. 23 Details of the hydrophobicity calculation are given in Supplementary Text file S2. The final value of hydrophobicity at a position is essentially a smoothed value of hydrophobicity scores of individual amino acids within the selected window around the position. The calculation was performed on the sequences of a certain source protein prior to their alignment, while after the alignment the positions of each sequence were mapped onto those in the aligned sequence (inserting gaps between positions). In the set of aligned sequences, the hydrophobicity value of a certain position was taken as the median of all hydrophobicity values in that position. The distribution of the individual amino acid positions within the estimated high or low hydrophobic regions was identified by the Mahalanobis distance method, as described above (see Supplementary Text file S1 for details). The Pearson correlation coefficient was calculated as previously (described in the previous section) except in this case the high hydrophobic amino acid positions were used instead of low entropy regions.
Proteasomal cleavage site prediction
The immunoproteasomal cleavage sites were predicted in a proteome-wide manner for HIV-1 through the employment of NetChop 3.0 (
Calculating the anchoring motif density
To further investigate the clustering property of HIV-1 proteins, the densities of B and F anchoring motif residues for each individual HLA supertypes were calculated in epitope-dense and nondense regions for each protein. Aligned proteins were used for this purpose in a manner similar to the “Proteasomal cleavage site” prediction. For this analysis, the anchoring motif data, specificity of HLA B and F pockets, and different
Statistics
All statistical tests were performed with GraphPad Prism software, version 5.0, or with the R Package for Statistical Computing (
Results
CBP method reveals the CTL epitope-dense regions within the HIV proteome
The epitope-dense/poor regions for the 12 HIV-1 proteins were defined using the CBP method. Among the four proteins (Gag-p24, Nef, RT, and gp160) that exhibited a relatively higher length of epitope-dense regions (>100 aa), p24 was the most successful with two epitope-dense regions spanning 207 amino acids cumulatively (Fig. 1a). For Nef, the total length of the epitope-dense region (117 amino acids) was distributed into two unequal regions (Fig. 1b), while those of RT and gp160 were found to be uniformly dispersed into three and five regions, respectively (Fig. 1c and d). Two separate regions with a collective length of 79 amino acids within the Gag-p17 were identified as epitope dense (Fig. 1e). For the remaining proteins (Vpr, Vif, Tat, Rev, Protease, and Integrase) except Vpu (no epitope-dense region was identified) the epitope-dense regions were less than 50 amino acids as revealed by the CBP method (Supplementary Fig. S1A–F; Supplementary Data are available online at
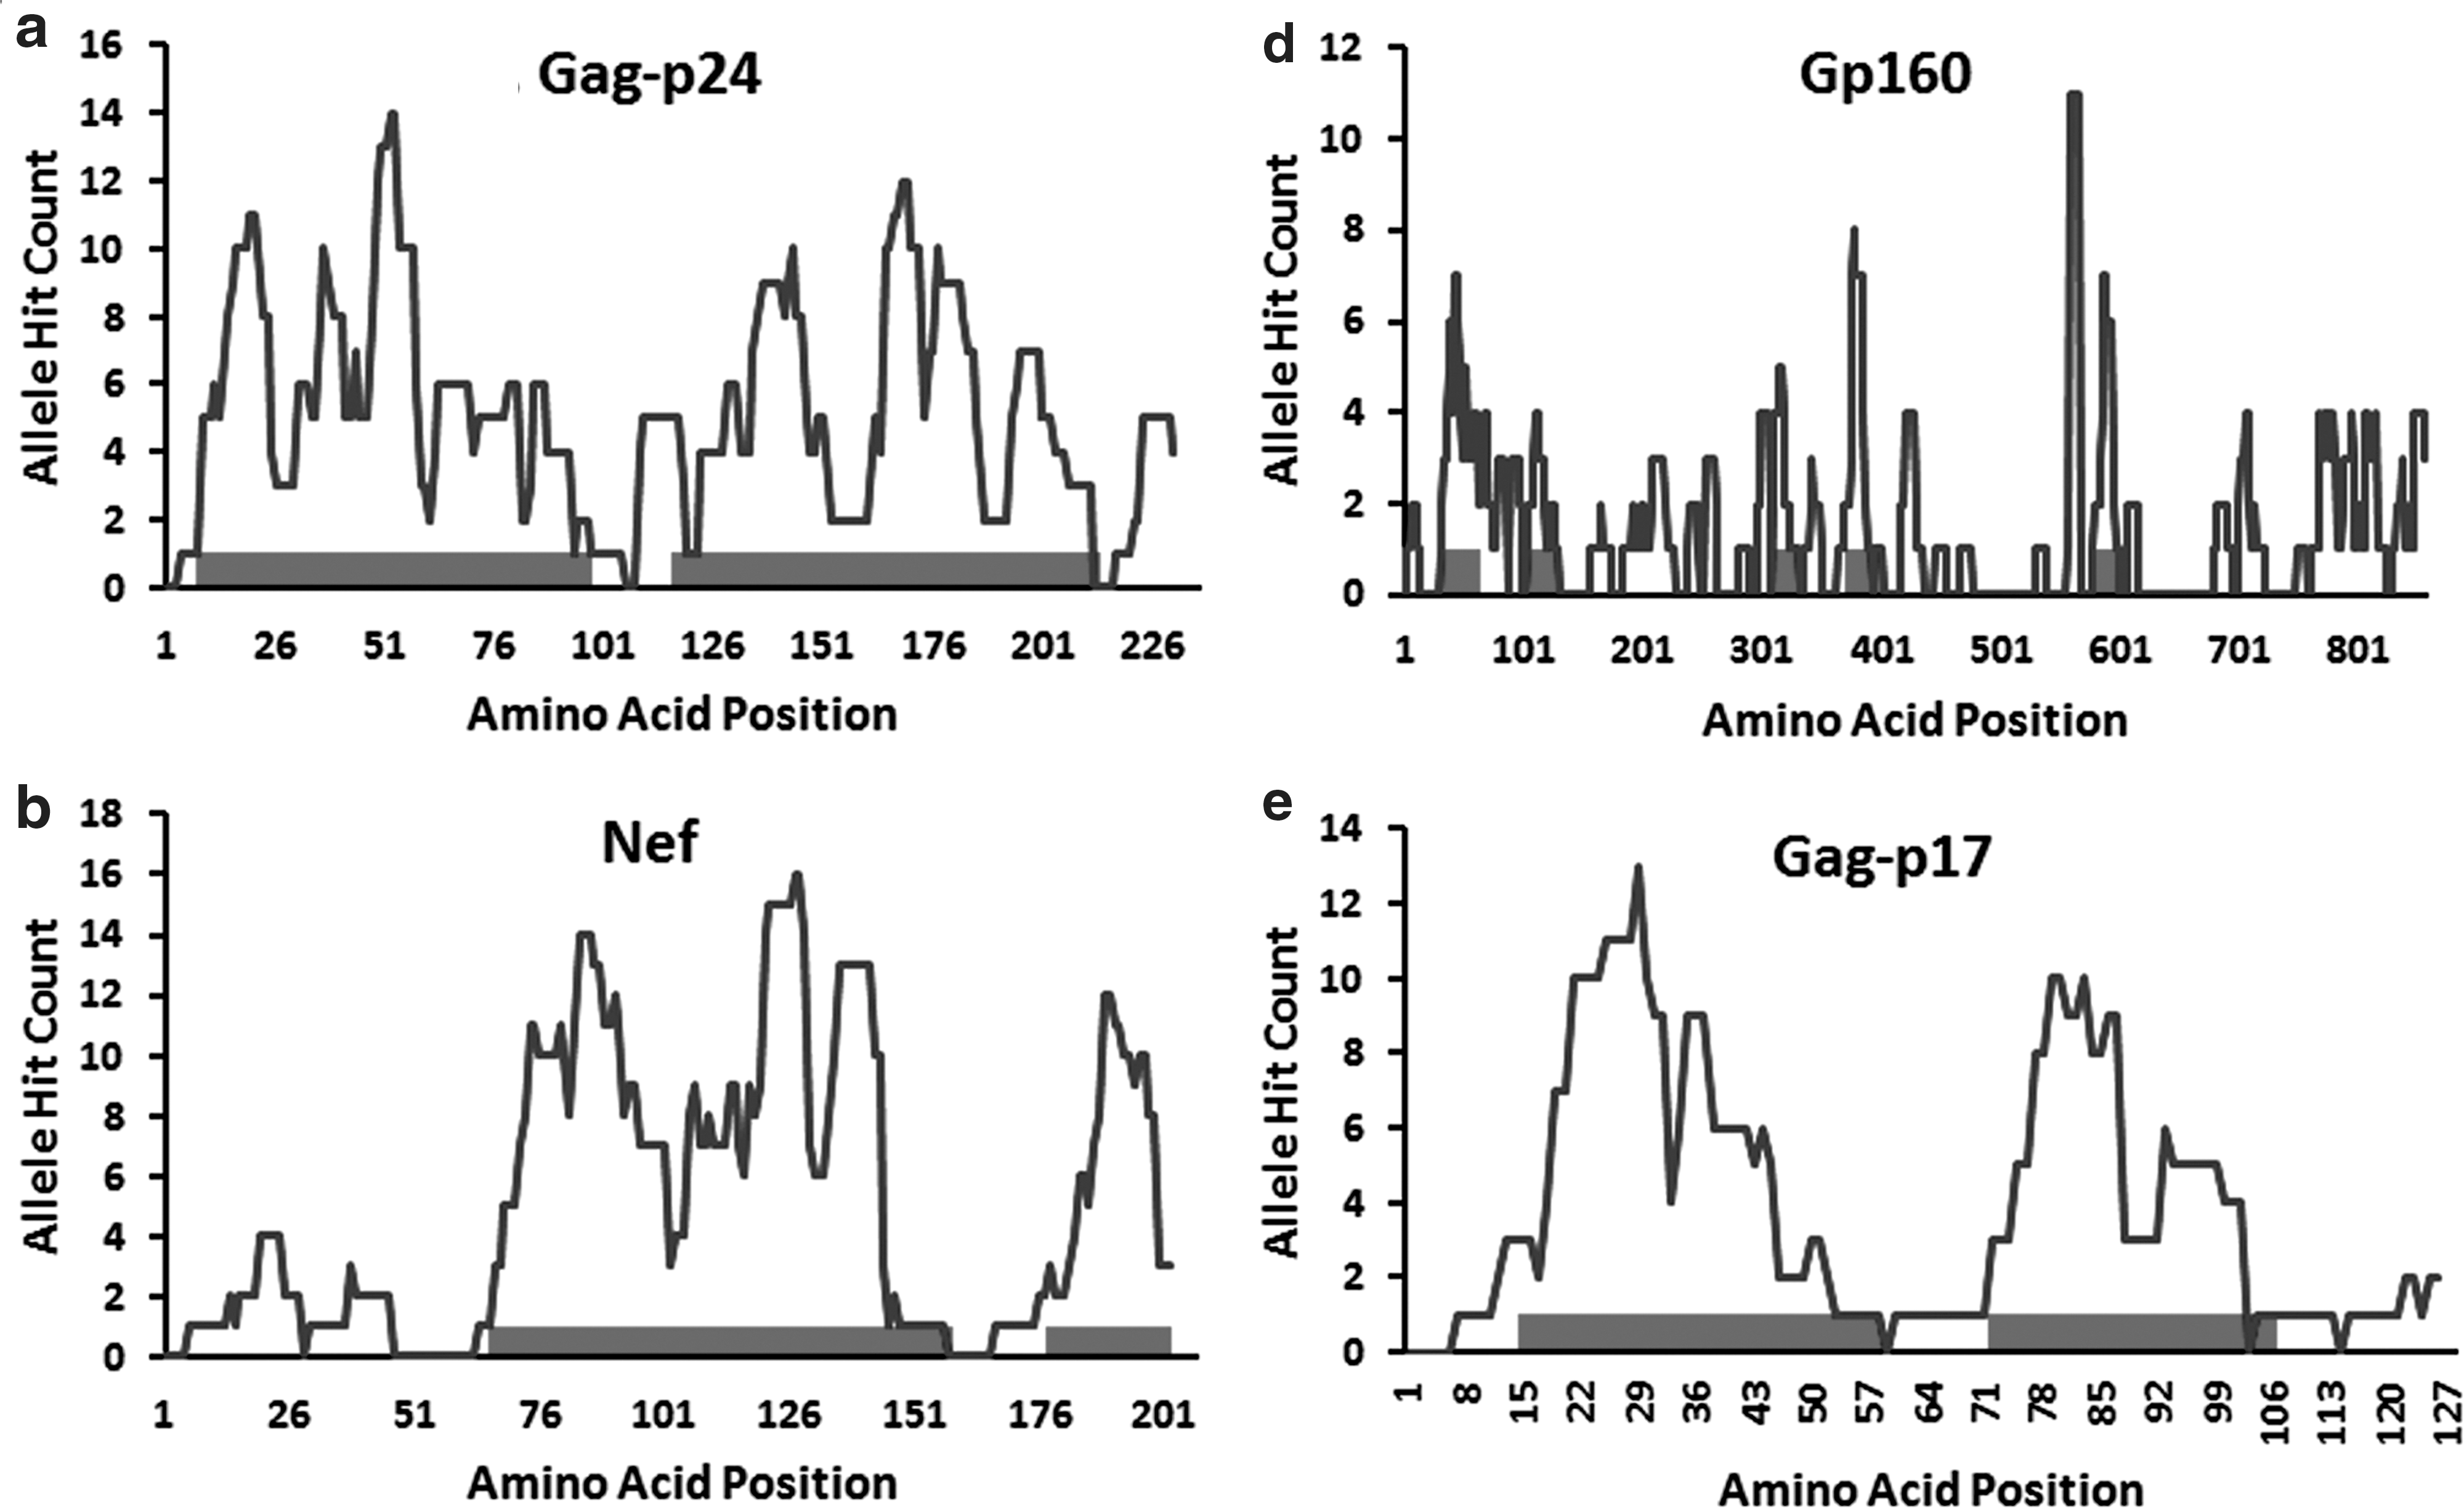
Epitope-dense regions with HLA allele hit count of HIV-1 proteins. This figure shows the number of unique HLA alleles along with the estimated dense amino acid positions for five different HIV-1 proteins: Gag-p24
CTL epitope-dense regions of Nef, p24, and p17 coincide with the low entropy and hydrophobic regions
To assess the sequence variability within the HIV-1 proteome, the prealigned sequences of individual proteins were used to calculate the Shannon entropy for each protein. Four proteins—Integrase, Gag-p24, Protease, and Reverse transcriptase—displayed relatively lower mean entropy scores, 0.12, 0.15, 0.14, and 0.16, respectively, compared to the rest of the HIV-1 proteins including Nef (0.42) and p17 (0.40) as previously shown by Yusim et al. 7 The possible correlation between regional entropy (the entropy scores averaged over a window size of nine amino acid) and epitope density was revealed by Pearson correlation. Although a negative correlation was found for six proteins, namely, Nef, gp160, Integrase, RT, Gag-p24, and Gag-p17, strong negative correlations were observed for Nef (0.51), p24 (0.47), and p17 (0.62), indicating the conserved nature of their CTL epitope-dense region whereas gp160, RT, and Integrase showed a very weak negative correlation. All the remaining proteins showed a positive correlation with the positional entropy values. However, when the Pearson correlation was calculated between regional hydrophobic scores and epitope-dense regions, an opposite pattern appeared. For instance, relatively higher positive correlation coefficient values were found for Nef (0.57), Gag-p17 (0.52), and Gag-p24 (0.5) implying the hydrophobic nature of the epitope-dense regions of these proteins. Protease, Integrase, and gp160 showed an intermediary positive correlation, whereas for the rest of the proteins the correlation values were either negative or too low to be significant. Figure 2 shows the overlapping pattern of epitope-dense regions with low entropy and high hydrophobic positions within Nef, p24, and p17.

Comparison of the overlapping patterns of epitope-dense regions with low entropy and high hydrophobic regions within three HIV-1 proteins (Nef, p17, and p24). The distributions of amino acid positions identified as epitope dense, low entropy, and high hydrophobic of Nef
HLA B*58, HLA A*02, HLA B*07, and HLA A*03 supertypes were most successful in restricting the amino acid positions of epitope-dense regions of Nef, p24, and p17
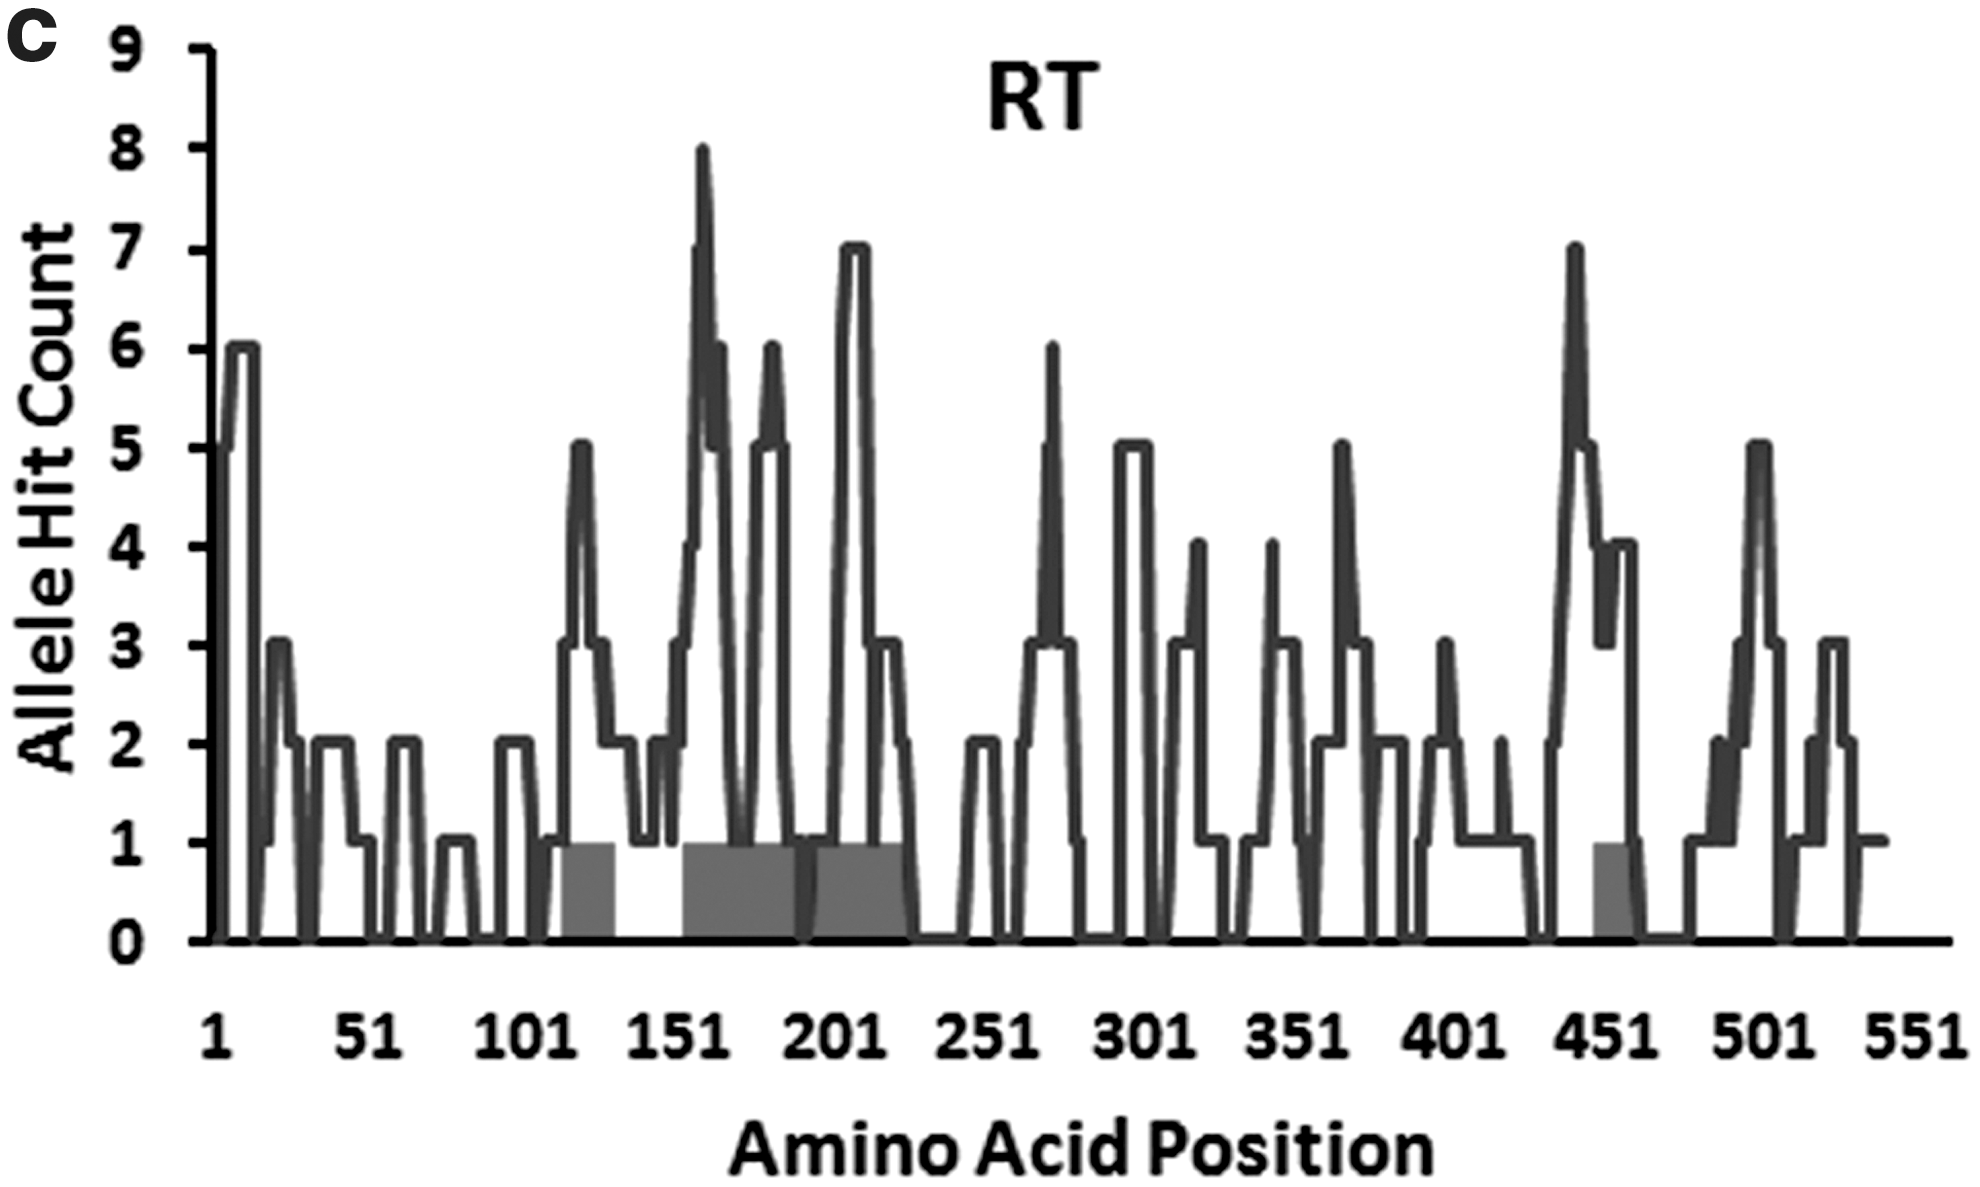
The immunogenic property of the identified epitope-dense regions was examined through the analysis of the HLA alleles, restricting the dense region amino acid positions, in terms of HLA class and supertypes. A total of 40 and 75 unique class A and B alleles were reported, respectively, as restricting HLAs for the whole HIV-1 proteome. Unlike HLA A and B the number of class C-restricting alleles is lower. The total numbers of unique class A and B alleles recognizing the overlapping epitopes in the dense regions of each HIV-1 protein were plotted (Fig. 3a). The highest number of class B alleles was found to be associated with the dense region of Gag-p24 (58) followed by Nef (47) and RT (41), while the dense region epitopes of Gag-p17 were restricted by 21 class B alleles. In the case of class A alleles, the highest number was found for both gp160 and RT while the Nef, Gag-p24, and Gag-p17 dense regions were restricted by 17, 15, and 18 individual class A alleles. The individual epitope-restricting HLA alleles of class A and B were grouped in supertypes by their anchoring motif specificity as described by Sidney et al. 19 The unique alleles for class A and B were found to be distributed in four (with one unclassified) and six (with 15 unclassified) HLA supertypes, respectively.
Total number of amino acid positions targeted by unique HLA class I A/B alleles and supertypes in the epitope-dense region of HIV-1 proteins.
Figure 3b, showing the total number amino acid position covered by each supertype, demonstrates supertypes that successfully target relatively higher numbers of amino acid positions. For instance, HLA B*58, HLA A*02, HLA B*07, and HLA A*03 supertypes cover regions spanning an over 100 amino acid position within the HIV-1 proteome while the rest of the supertypes including HLA A*24, B*08, B*27, B*44, B*62, and A*01 along with two unclassified allele groups were found to be associated with regions of less than 100 amino acids.
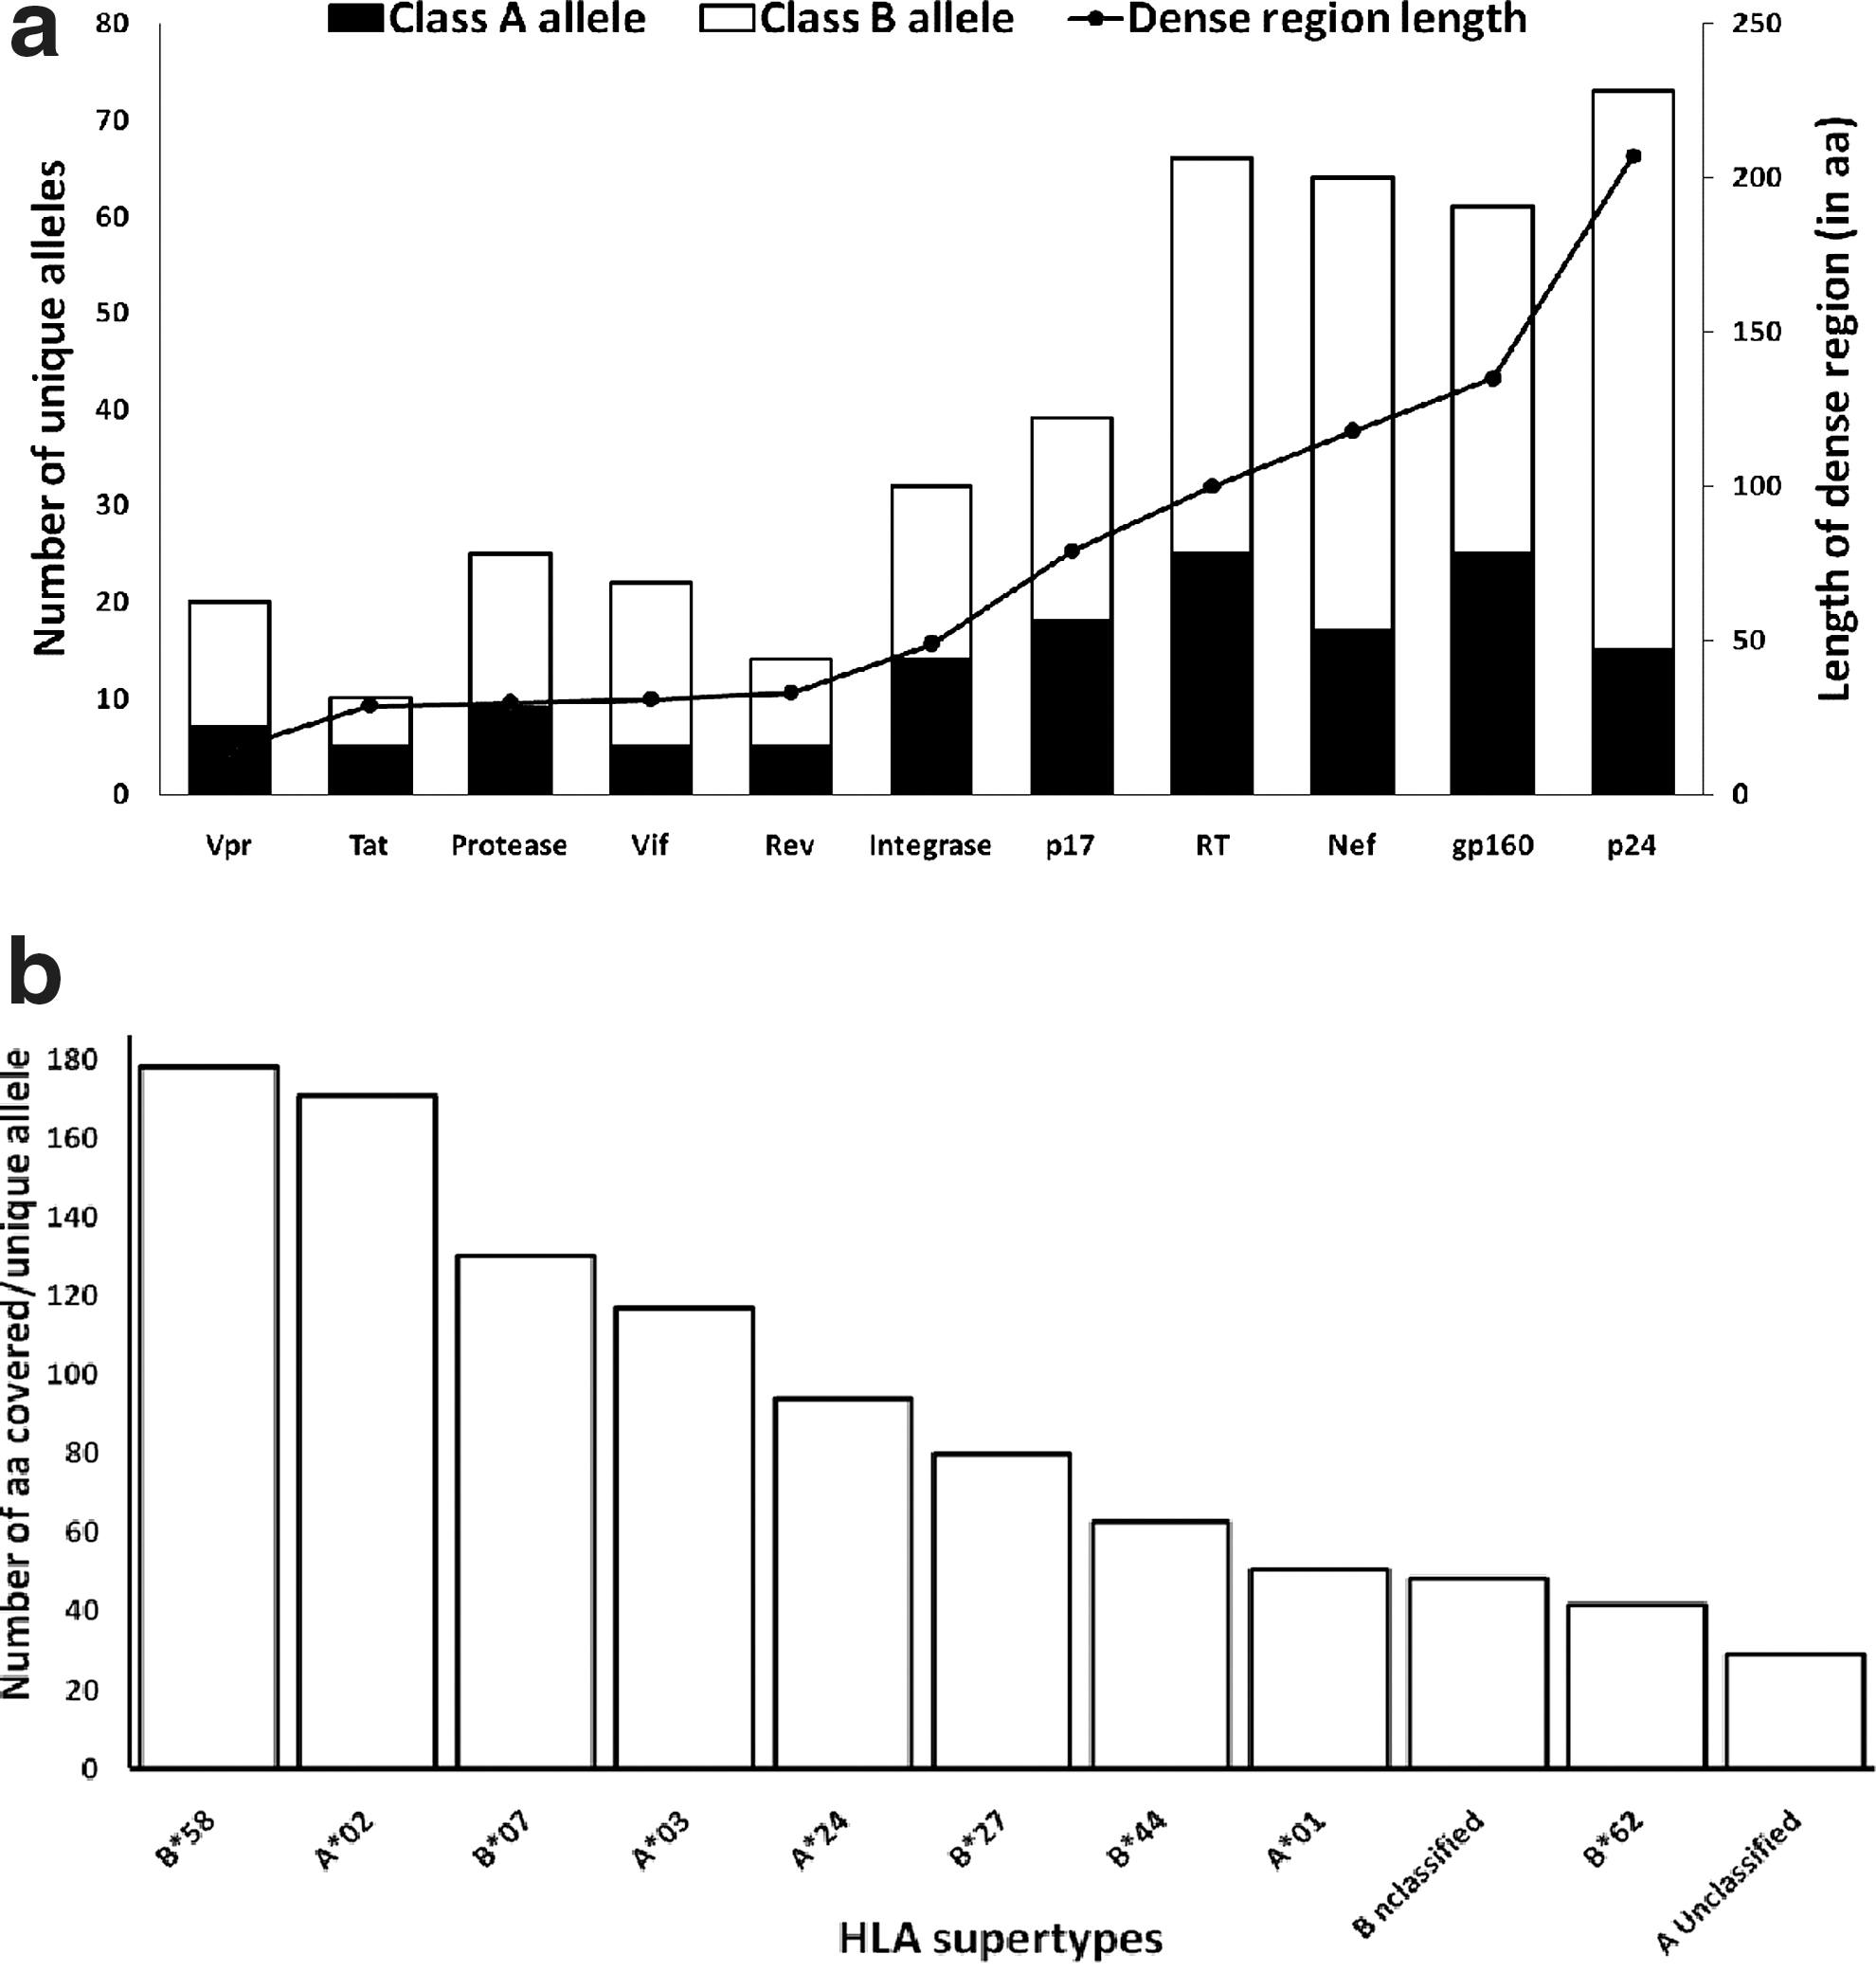
Figure 4 illustrates the contribution of HLA supertypes in restricting the amino acid position in dense regions of Nef, Gag-p24, Gag-p17, gp160, and RT. For all five proteins, namely Nef, Gag-p24, Gag-p17, gp160, and RT, significant numbers of amino acid positions were restricted by HLA B*07 supertypes (40%, 24%, 27%, 40%, and 45%, respectively) and HLA A*03 (41%, 46%, 27%, 26%, and 42%, respectively) (Fig. 4). HLA B*58 and A*02 were also found to be major restricting supertypes for Nef and Gag-p24. Apart from A*03 and B*07, HLA A*01 and B*08 were also found to be associated with a significant portion of the Gag-p17 dense region (Fig. 4).
Percentage of dense regions covered by different class A and B HLA supertypes in five HIV-1 proteins. Pie charts show the proportion of amino acid positions covered (as percentage) by each class B and A HLA supertypes for Nef, p24, p17, gp160, and RT. Among the class B supertypes, HLA B*07 was most predominant for all five proteins, while HLA A*03 covers the highest portion of the dense regions among the A supertypes for Nef, p17, and p24.
Estimation of PCS and anchoring motif density within the epitope-dense regions of selected HIV-1 proteins
We opted to investigate the distribution of the proteasomal cleavage sites within individual HIV-1 proteins on the basis of the hypothesis that the densities of the PCSs are higher in the epitope-dense regions compared to nondense regions. A two-sided nonparametric Mann–Whitney test revealed no significant difference in the distribution of PCS scores between the epitope-dense and epitope-poor regions of any of the HIV-1 proteins (as indicated by high p-value) implying the uniform distribution of the PCSs throughout the HIV-1 proteome. Performing Fisher's exact test after counting the number of predicted and nonpredicted C-termini cleavage sites in poor and dense regions based on the NetChop recommended score (0.5), as an alternative method, yielded the same outcome.
To further investigate the underlying reason for the observed epitope clustering tendency, the B and F anchoring motif densities in the epitope-dense and epitope-poor regions in five HIV proteins, namely Nef, Gag-p24, Gag-p17, RT, and gp160, were investigated. The amino acids identified as anchoring motifs were grouped into nine classes according to their physical properties as described by Sidney et al. 25 In the case of Nef the anchoring motif frequency percentages in the dense region were significantly higher for aliphatic, aromatic, basic, hydrophobic, large hydrophobic, and proline categories compared to the poor region while for p24 higher frequencies were found for all amino acid classes in the dense region (Fig. 5a and b). This analysis was also supported by the t test as significant differences were observed between the B and F pocket anchoring motif frequencies of poor and dense regions for both Nef (<0.04 and <0.02, respectively) and Gag-p24 (<0.04 for both). For the rest of the proteins including gp160, RT, and p17 no significant disparities were observed between the anchoring motif frequencies of the dense and poor region. Although for Gag-p17 the mean frequencies of F and B pocket motifs were not statistically different, the dense region frequencies of some motif categories were much higher than that of the poor region. For instance, the frequency of the aliphatic anchoring motif in the dense region was 2-fold higher compared to that of the poor region. Furthermore, aromatic and proline motifs were absent in the Gag-p17-poor region whereas the frequency of the F pocket basic motif was almost 2-fold higher in the dense region than the poor region (Fig. 5c).
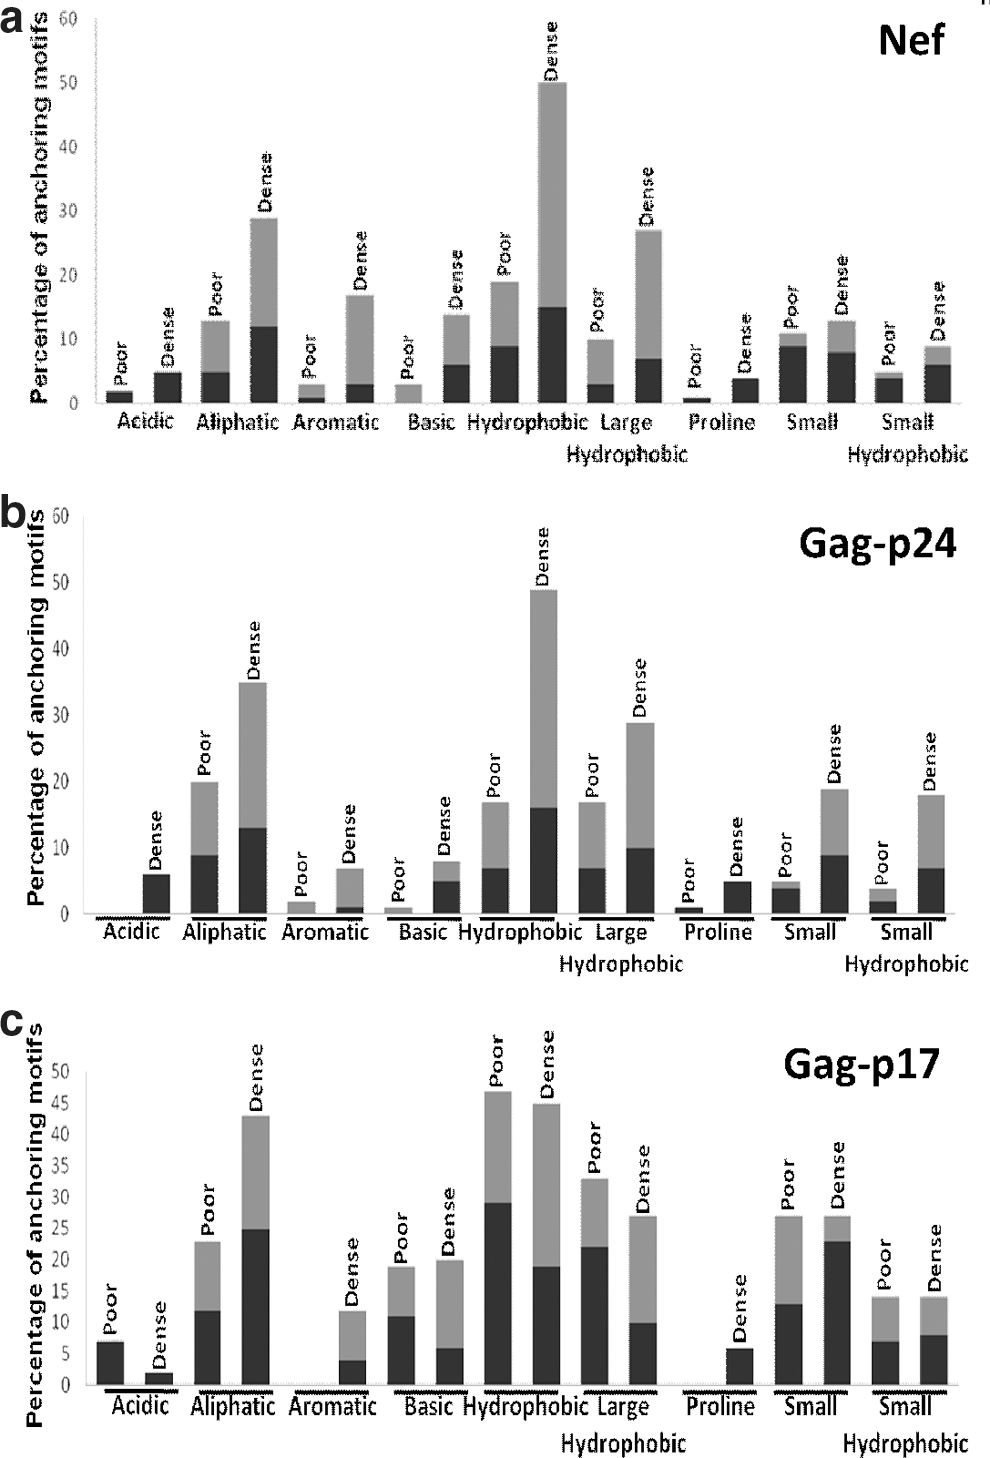
B and F anchoring motif densities within the epitope poor and dense regions of six HIV-1 proteins. The figure corresponds to the B (black bars) and F (gray bars) anchoring motif densities categorized into nine types according to the physicochemical properties of the amino acid residues in the epitope poor and dense positions of six HIV-1 proteins: Nef
Discussion
The current study aimed to investigate the clustering pattern of HIV-1 CTL epitopes and any possible correlation of regional hydrophobicity and entropy scores with the observed CTL epitope clusters. Although the cumulative lengths of the dense regions in four proteins—Nef, p24, gp160, and RT—were found to be relatively higher, the individual regions for gp160 and RT were much smaller and were distributed uniformly throughout the entire length of the protein and thus weakened the compactness of the cluster. Moreover, relatively higher lengths of both these proteins mask the true nature of the cluster as their epitope-dense region was found to be proportional to protein length (Supplementary Fig. S2). In contrast, p17 presented an opposite phenomena in which the cumulative dense region length (79 aa) is quite significant considering its small size, reflecting the compactness of the epitope cluster. Our analysis disclosed a strong negative correlation between the low entropy and epitope-dense regions for Nef and p17 in harmony with the previous findings of Yusim et al. 7 In contrast to Yusim et al., 7 we observed no statistically strong correlation between the regional entropy pattern and epitope-dense region for gp160 (0.21), indicating epitopes are not concentrated in conserved regions. A random distribution pattern of epitopes throughout gp160, together with its high antigenic variability, may account for the observed weak correlation for gp160 in the current study.
However, unlike gp160, p24 shows a high level of sequence conservation and large epitope-dense region in almost its entire length, explaining the positive correlation estimated. The correlation of epitope-dense positions with hydrophobic regions Nef, p17, and p24 was strong positive, indicating their hydrophobic nature, while the rest of the proteins, including gp160, showed a weak correlation. It was evident that the epitope-dense regions of the Nef and Gag proteins were both hydrophobic and conserved in nature. This phenomenon was not observed throughout the whole HIV-1 proteome and hence it diminishes the general applicability of the hypothesis that all the HIV CTL epitopes were conserved and hydrophobic in nature. But at the same time our evidence differs from the results obtained by Schmid et al., which concluded that CTL epitopes and hydrophobic amino acids throughout the HIV-1 proteome follow a random distribution pattern for Nef and Gag proteins. 22
Next we investigated the underlying reason for the observed high CTL epitope clustering pattern of Nef, Gag-p24, and p17 by studying different aspects of CTL epitope processing and presentation including the PCSs and anchoring motifs as well as the role of HLA supertypes in selecting the HIV-1 CTL epitopes to be presented. A recent study showed that although for most of the proteins the fractions of unique HLA A and HLA B-restricted positions are equivalent in the total HIV-1 proteome, Gag-p24 and Nef seemed to be preferentially targeted by HLA B alleles. 18 In the current study we observed a bias toward the HLA B alleles for the epitope-dense regions of most of the HIV-1 proteins except Tat, which harbors an identical number of unique restricting class A and B alleles (Fig. 3a). In accordance with previous findings, a major bias toward class B alleles was observed for p24 and Nef for which the number of restricting B alleles was almost 4-fold and 3-fold higher compared to class A alleles, respectively, while for p17, only minor differences between the numbers of unique A and B alleles were found.
To provide a plausible explanation for the clustering pattern of Nef and Gag proteins we hypothesized that the high density of the PCSs in the epitope-dense regions may account for the clustering pattern. However, comparison of the PCS scores in the dense and poor regions among individual proteins yielded no statistical significance, imparting the uniform distribution pattern of proteasomal cleavage sites within the HIV-1 proteome as opposed to the findings of Lucchiari-Hartz et al. 21 Next the anchoring motif densities of five individual proteins (Nef, p24, p17, RT, and gp160) were examined where we compared the frequencies of different B and F anchoring motif categories within the epitope-dense and epitope-poor regions. A significant variation for both F and B motifs between the dense and poor regions of both Nef and p24 signifies the higher concentration of anchoring residues in dense regions, which may explain the high epitope clustering tendency of these proteins. Apart from the comparison of overall motif densities between the dense and poor regions, different motif categories consisting of residues with similar physicochemical properties were compared. For Nef, B pocket proline, aromatic, aliphatic, and small amino acids frequencies were present and were 2-fold higher in the dense region compared to the poor region. Two-fold or higher frequencies were observed for all the F pocket motif types except acidic and proline in the Nef dense region while the greatest difference in frequency was observed for aromatic followed by hydrophobic and basic F motif residues. Both Nef and p24 showed a sharp inclination toward HLA B supertypes, especially for HLA B*07 and B*58 that prefer proline and small motif residues in their B pocket, respectively. Both these supertypes prefer aromatic, aliphatic, or hydrophobic residues in their F pocket. 25
Among the HLA A supertypes, HLA A*03, preferring small and basic residues in the B and F pocket, respectively, was the most dominant in restricting CTL epitopes for both Nef and p24. HLA A*02, which favors B pocket small/aliphatic and F pocket aliphatic/small-hydrophobic residues, 25 also significantly contributed to restricting the amino acid position in the p24 dense region. All these B and F-type motif residues preferred by the successful HLA supertypes (B*07, B*58, A*03, and A*02) were identified with significantly higher frequency within the Nef and p24 dense region, which underscores the role of these HLA supertypes, in particular the HLA B alleles, in preferentially selecting the amino acid positions in the dense region for antigen presentation.
Although no significant difference was shown between the poor and dense regions in terms of anchoring motif frequencies for p17, a major variation of frequencies in several motifs was observed. For instance, the average frequencies of F pocket aliphatic, hydrophobic, and aromatic motifs preferred by both B*07 and B*08 and the B pocket aliphatic motif preferred by A*03/01/02 were much higher (over 2-fold) in the dense region in comparison to the poor region. The lower B pocket proline frequency was spotted, which certainly limits the epitope presenting capacity of the B*07 supertype. However, as the B anchoring motif is not yet established for B*08, the F pocket proline residues together with unidentified B pocket residues may account for the HLA B allele coverage within the p17 dense region. All these findings point toward the high density of B and F anchoring motifs preferred by the HLA supertypes, which restricts major portions within the dense region of Nef, p24, and p17 and thus ultimately serves as a contributing factor toward the cluster-forming tendency of these proteins. The high density of B and F pocket motif residues specially preferred by the HLA B supertypes in Nef and p24 not only explains the bias toward certain HLA B supertypes but also highlights their role in selecting large numbers of conserved and hydrophobic overlapping amino acid positions to be presented to Tc cells.
One of the focal points of the current study was to establish a rigorous definition of epitope clusters composed of experimental validated CTL epitopes and characterize those clusters in terms of hydrophobicity and amino acid variability. To achieve this, we employed some of the methods that have been previously described by Yusim et al. 7 For instance, correlation between positional entropy scores and epitope distribution and correlation of epitope distribution with proteasome C-terminal cleavage prediction scores from the NetChop prediction program was previously done by Yusim et al. 7 However, we argue that doing the same analyses with a larger epitope dataset could reveal some interesting aspects of epitope clustering, which was precisely our rationale behind those analyses. The conclusions drawn from the current study regarding clustering patterns to some extent match the findings of Yusim et al. 7 in the sense that we also found nonrandom clustering patterns in three HIV-1 proteins in contrast to Schmid et al. 22
However, unlike Yusim et al. 7 we did not observe this clustering pattern in the rest of the HIV-1 proteome. Analyzing a larger dataset as well as employing stringent criteria to qualify a set of epitopes as a cluster could account for the difference. For example, in this study 974 experimentally validated epitopes, found to be restricted by one or more HLA alleles, were included for analyses out of 1,232 CTL epitopes listed in the HIV molecular immunology database. Although we closely followed the methodology of Yusim et al. 7 to some extent, we employed new approaches to investigating the important role of HLA alleles in selecting the preferred residues as anchoring motifs that perfectly correlates with the observed clustering phenomena of some HIV-1 proteins, namely Nef, p24, and p17. We believe this approach is original and the previous studies including that of Yusim et al. 7 did not address this research question.
These findings could have an important impact on designing an HLA-based vaccine because the HLA-HIV epitope interaction has been shown not only to be the major modulating factor in controlling the infection but also the source of primary selective pressure inducing rapid viral evolution. 15,26 An HIV-1 vaccine should ideally encompass the class I-restricted CTL epitopes based on the HLA profiles of the target population and may be designed for a population of a specific geographic location for which the vaccine epitopes are restricted by the most frequent HLA supertypes for that population. 27,28 Therefore specific HLA supertypes contributing significantly in selecting conserved amino acid positions within Nef and Gag proteins appear to be crucial in designing HLA-based vaccines.
Footnotes
Acknowledgments
The authors thank Dr. Karina Yusim, Professor Dr. Peter J. Delves, and Professor Dr. M. Sayedul Islam for their helpful review, suggestions, and guidance.
Authors' contributions: S.C.: study design, planning, dataset construction, clustering analysis, writing; R.C.: development of the algorithm for cluster analysis, entropy and hydrophobicity calculation, writing; M.T.R.: PCS frequencies calculation; A.K.: writing and reviewing; A.R. and M.S.: anchoring motif frequency calculation. All authors read and approved the manuscript.
Author Disclosure Statement
No competing financial interests exist.
References
Supplementary Material
Please find the following supplemental material available below.
For Open Access articles published under a Creative Commons License, all supplemental material carries the same license as the article it is associated with.
For non-Open Access articles published, all supplemental material carries a non-exclusive license, and permission requests for re-use of supplemental material or any part of supplemental material shall be sent directly to the copyright owner as specified in the copyright notice associated with the article.