




Abstract
Current HIV guidelines recommend monitoring CD4 counts every 3–4 months. In the era of highly active antiretroviral therapy (HAART) and HIV PCR, this retrospective study reexamines the required frequency of the CD4 assay. Predictor variables, including age, previous CD4 count, HIV viral load (VL), time interval since last VL and CD4 count (TINT), and antiretroviral history, were abstracted. A recursive partitioning-based regression tree analysis was used to determine if the absolute current CD4 count was above or below the age appropriate Pneumocystis jiroveci pneumonia (PCP) prophylaxis cutoff. We analyzed concurrently obtained VLs and CD4 count including 601 results from 43 HIV-infected children aged 1–<6 years (Group I) and 1,364 results from 93 children/adolescents 6–<23 years (Group II). Using 75% of observations to build a predictive model (learning dataset), the ability to correctly predict the range of the outcome variable in the remaining 25% of observations (training dataset) was 93% in Group I and 97% in Group II. Predictor variables included age, recent VL and CD4 count, and TINT. A total of 1,000 repeats of this model building using randomly selected observations showed a correct predictive ability of 89.6% [standard error (SE) 2.3%] in Group I and 95.6% (SE 1%) in Group II. The ability of a classification tree to determine if the current CD4 count is above or below the age-specific cutoff for PCP prophylaxis is very good and allows less frequent CD4 assays. The principles underlying this modeling-based approach have broad applicability and cost saving implications.
Introduction
M
We hypothesize that in patients on HAART, the frequency of the CD4 assay should be tailored to the immune status of a patient and the stability of the patient's viral load. A decision regarding the frequency of the CD4 assay should be based on the probability of expecting a clinically important change, such as crossing a CD4 threshold for OI prophylaxis.
Use of traditional statistical methods such as logistic regression to develop a model to predict CD4 counts is limited by the variable distribution of observations and the presence of complex interactions. In such situations tree-based recursive partitioning analysis 3 has been shown to be useful. This study was designed to use this analytical tool to predict a patient's CD4 range (above or below age-appropriate Pneumocystis jiroveci pneumonia prophylaxis cutoff) using recent virologic and immunologic information with the intention of spacing out the frequency of obtaining actual CD4 counts.
Materials and Methods
The objective of this study was to predict the range of the CD4 count at time t (current visit) and time t +1 (future visit), using information collected at previous visits (Fig. 1).
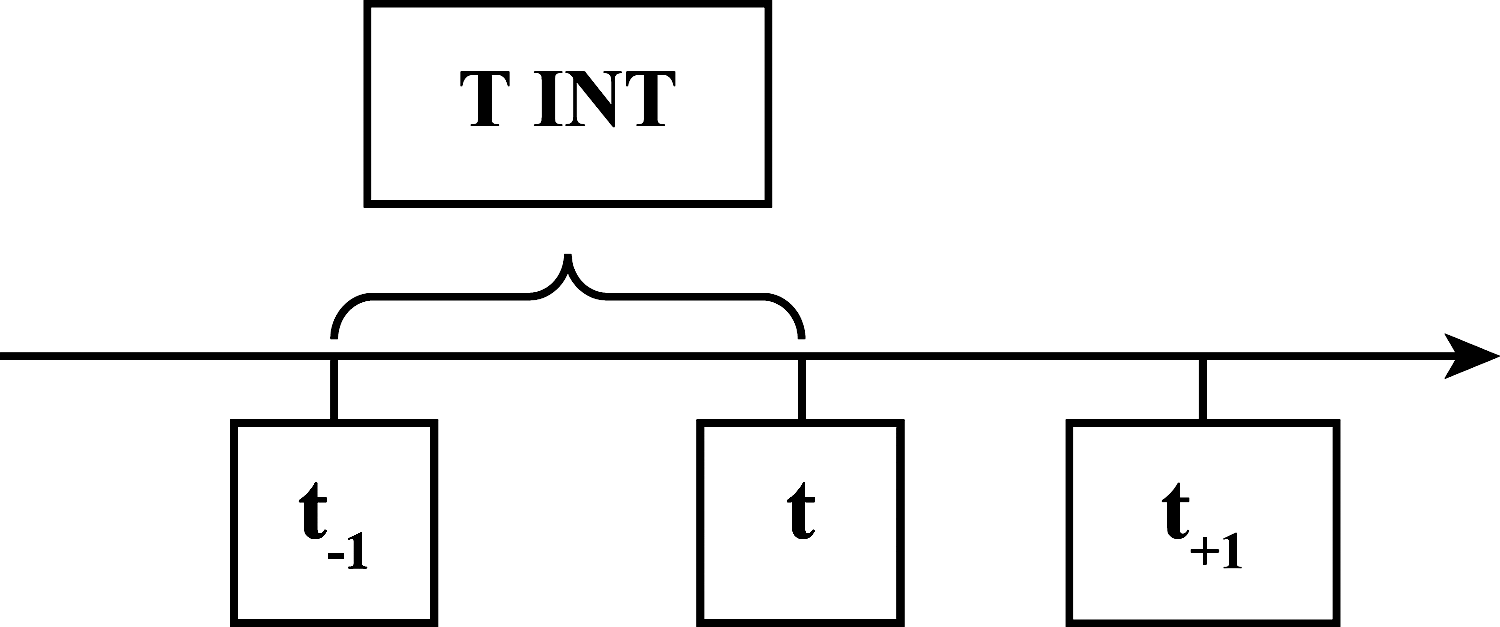
The study objective was to predict CD4 count at visit t and t +1 using information from previous visits. t, today's visit; t –1, last visit before time t; t +1, next visit; TINT, time interval in days since last visit. Age of the patient, viral load, and actual CD4 count from time t –1 were used to predict CD4 count at time t. All of these variables except for actual CD4 count (predicted value was used instead) from time t were used to predict CD4 count at time t +1.
Patient population
This retrospective study was done at St. Jude Children's Research Hospital (SJCRH). The HIV/AIDS clinic at SJCRH currently has an active patient population of over 200 HIV-infected children and adolescents. This study was approved by the SJCRH Institutional Review Board and a waiver of informed consent requirement was granted.
Study criteria
Data from patients (1 to <23 years of age) who were on a minimum of three antiretrovirals were included in the analysis. This was done to obtain data from a homogeneous population similar to what one would expect in the United States where the standard of care is HAART therapy. Only concurrently obtained CD4 counts and viral loads were used to build the prediction model. Patients who met the study criteria were included regardless of what their CD4 count and viral load was.
Data collection
Data including patient age, CD4 counts, HIV viral loads, and antiretroviral medication history from 1996 to 2002 were obtained from an HIV database maintained at SJCRH. These variables are part of the extensive clinical information routinely entered into the database on all patients seen in the HIV clinic.
Statistical approach
A tree-based recursive partitioning analysis was used to construct a mathematical model to predict if the outcome variable, i.e., absolute current CD4 count, was above or below the age-appropriate cutoff for administering prophylaxis for Pneumocystis jiroveci pneumonia (PCP). The study population was divided into two groups based on age-specific absolute CD4 cutoff used to determine Pneumocystis jiroveci prophylaxis (PCP): Group I (children age 1 to <6 years): CD 4 <500 or ≥500 cells/mm3; Group II (children with age ≥6 years): CD 4 <200 or ≥200 cells/mm3. Predictor variables that were considered in the development of the mathematical model included last viral load X(t
–1) (log value), last CD4 count Y(t
–1
A “learning dataset” composed of a number of observations for the predictor and outcome variables was used to construct a classification tree that would then be used to predict the outcome variable in future patients who are similar to those who contributed to the learning dataset. The classification tree was “pruned” to avoid over/under fit. A “training dataset” composed of a sample of already collected predictor and outcome variables was then used to determine the outcome variable and compare the predicted value with the actual value. The accuracy of the classification tree to correctly classify the outcome variable was reported as the “correct rate.” Prediction of a CD4 count above the PCP prophylaxis cutoff when the actual value was below the cutoff was considered a “serious error.” The predictive ability of the classification tree for predicting the CD4 range on two consequent visits (t and t +1 as shown in Fig. 1) was assessed. When calculating the predicted value of the CD4 count at time t +1, the predicted value of CD4 at time t was taken as the actual value. One thousand repeats with random resampling using bootstrap analysis were done to check the robustness of the classification tree and to calculate the standard error.
Tree-based modeling is an exploratory technique for uncovering structure in data. 3,4 The technique is useful for classification (if the response variable is categorical) and regression (if the response variable is numeric) when one has a set of classification or predictor variables (x) and a single-response variable (y). A classification tree is the collection of many rules determined by a procedure known as recursive partitioning. The tree-based models are defined by an algorithm, which attempts to partition the space of the predictor variable (x) into homogeneous regions, such that within each region the conditional distribution of y given x does not depend on x. For instance, when y is numeric, regression rules for prediction are of the following form: “if (x 1≤400) and (x 2 in C, D, F) and (x 3≤3.5), the predicted value of y is 4.75.”
One of advantages of a tree-based method is that it, unlike other statistical modeling methods that are constrained by functional forms, shows appropriate relationships between the data.
All analysis was performed using Splus (Version 6, MathSoft, Inc., Seattle, WA). Successive CD4 and viral load values from the same patient were used when building the prediction tree.
Results
Baseline characteristics of patients included in the analysis are shown in Table 1. Forty-three patients contributed 601 paired CD4/viral load observations for the Group I analysis and 93 patients contributed 1,364 observations for the Group II analysis. Results of a predictive model for Group I and Group II are shown in Table 2 and Table 3. The results provided in these tables demonstrate the predictive ability of the classification tree for predicting the CD4 value on two consequent visits.
Blood transfusion (3), unknown (3).
Note that an undetectable viral load was recorded as “10” for the purpose of analysis.
The predicted CD4 value was greater than 500 cells/mm3 when the actual value was below 500 cells/mm3.
Based on 1,000 resample. The correct and serious rates are the means of the 1,000 repeats. The corresponding standard error (SE) is also given there.
Median time interval between visits (t −1, t, and t +1) was 56 days (range 0–810 days).
These models restrict the predictor variables to patients with viral load <50,000 copies/ml and CD4/VL values obtained within 7 months of the current visit.
The results provided in this table demonstrate the predictive ability of the classification tree for predicting the CD4 value on two consequent visits. When calculating the predicted value of the CD4 count at time t +1, the predicted value of CD4 at time t is taken as the actual value.
The predicted CD4 value is greater than 200 cells/mm3 when the actual value was below 200 cells/mm3.
Based on 1,000 resample. The correct and serious rates are the means of the 1,000 repeats. The corresponding standard error (SE) is also given there.
Median time interval between visits (t −1, t, and t +1) was 65 days (range 0–751 days).
These models restrict the predictor variables to patients with viral load <50,000 copies/ml and CD4/VL values obtained within 7 months of the current visit.
Distribution of predicted and actual CD4 values from one random selection shown in Fig. 1.
The results provided in this table demonstrate the predictive ability of the classification tree for predicting the CD4 value on two consequent visits. When calculating the predicted value of the CD4 count at time t +1, the predicted value of CD4 at time t is taken as the actual value.
Model I did not have any viral load or time interval restrictions used to filter observations that were used for building the classification tree. Using the first 75% of observations to build a predictive model (training dataset), the ability to correctly predict the range of the outcome variable, i.e., CD4 count above or below the PCP prophylaxis cutoff, in the remaining 25% observations (learning dataset) was 93% in Group I and 97% in Group II (predictor variables in both groups: age, most recent viral load and CD4 count, and TINT). One thousand repeats using randomly selected observations showed a correct predictive ability of 89.6% [standard error (SE) 2.3%] in Group I and 95.6% (SE 1%) in Group II. A serious error, i.e., prediction of a CD4 count above the PCP prophylaxis cutoff when the actual value was below the cutoff, using the bootstrap analysis with Model I, was seen in 6.14% (SE 2.5) and 3.3% (SE 1.2) of predicted values in Groups I and II, respectively. In an effort to further reduce the serious error rate, Models II, III, and IV restricted the predictor variables to those patients who had an HIV viral load <50,000 copies/ml and for whom the last CD4 count and HIV viral load were obtained <7 months from the current visit.
Model III added a level of complexity by examining the potential benefit, if any, of including the sequence of antiretroviral therapy regimen (primary, secondary, tertiary, etc.) as a predictor variable. Less complicated was Model IV, which considered the impact of a simplified tree using only the last CD4 and viral load value. Overall for both Groups I and II, the predictive ability of Model II appeared to be the best and that of Model IV the worst. In general, the predictive ability of the models in Group II was higher than in Group I. Figure 2 provides a graphic look at the relationship of the actual and predicted CD4 values in one of 1,000 repeats of Model II (Group II) analysis. In this example, in 1.6% of instances the CD4 was predicted to be above 200, when in reality it was below 200.

Scatterplot of actual and predicted CD4 values in Model II (Group II). Green points that fall on the blue bars indicate the cases in which an “error” was committed. The “correct rate” in this case was 97.5% with a “serious error” rate of 1.6%. Color images available online at
Finally we also looked at representation of discordant CD4-VL responses in the datasets used for model building in Groups I and II and chose Model II as the representative model for this analysis. With discordance defined as patients with a CD4 count that remained less than 500 (for Group I) and less than 200 (for Group II) over visit t and t +1, despite a VL that was undetectable at times t –1 and t and t +1, there were 18 and 2 discordant cases in Groups I and II, respectively. These cases were included in the respective dataset analysis. Exclusion of these cases did not significantly change the performance of the prediction models. In a representative run of Model II where the learning and testing dataset were randomly selected, 0.5% and 0% of the serious errors in predicted CD4 counts in Groups I and II, respectively, were in patients who had discordant responses.
Discussion
The ability of our approach using the last CD4 count, last viral load, age of the patient, and time interval since last CD4 count and HIV RNA level to determine if the current CD4 count is above or below the PCP cutoff on two consequent visits in pediatric patients on HAART is very good. This method could help reduce the frequency of obtaining this test in select clinical situations and provide an objective basis for supporting the inclination of some experts to space out CD4 assays in the era of HAART and routine HIV viral load assessments. 1 While the model proposed in this study was developed for and is most applicable to pediatric patients on HAART in a resource-rich country, this approach of model building could be taken to other patient populations such as patients not on HAART or those on antiretroviral therapy in resource-limited settings as well as for other prediction goals such as predicting other key CD4 cutoff points. With such applications in resource-poor settings HIV RNA PCR results may not be available and yet the principles underlying the proposed modeling-based approach could be used to build locally applicable prediction models using available variables.
Current HIV guidelines recommend checking CD4 counts every 3–4 months. 1 The test results are used to provide patients with an update on their immune status, indirectly assess adherence, and monitor the need for OI prophylaxis. With access to HAART, a major subset of the HIV-infected patient population maintains an undetectable or low HIV viral load. In this patient population, a sizable group of patients has CD4 counts above the OI prophylaxis cutoff. With routine monitoring of HIV viral load in these patients and assuming that changes in HIV viral load would precede CD4 count drops in those with poor adherence to HAART, continuing the practice of obtaining a CD4 count every 3 months seems unnecessary. The cost of a CD4 assay in the United States is $270 (OPTUMInsight, 2012 Customized fee analyzer).
Using the classification tree described in this study, if the number of CD4 tests ordered per patient could be reduced to two instead of four per year a cost savings of approximately $540 per patient per year could be realized. Though this saving seems trivial compared to the cost of antiretrovirals, in the context of the hundreds of thousands of HIV-infected patients in the United States and the millions globally the implications of this potentially cost saving strategy could be tremendous. With increased scrutiny to President's Emergency Plan for AIDS Relief (PEPFAR) and other programs and the relative merit of funding these versus other healthcare interventions with a global impact, every cost saving strategy is invaluable. 5
One of the immediate concerns about using the approach shown in this study to predict CD4 count is the question related to patients with discordant CD4 and viral load response. Discordant response can be of two types—one, where the viral load remains high and yet the CD4 count continues to increase and two, where the viral load trends down or becomes undetectable and yet the CD4 count response is blunted. 6,7 The second category of discordance is the one that is of most concern from a clinical standpoint. The uncommon occurrence of this pattern of discordance as well as our tree-based recursive partitioning model's ability to predict the majority of such discordant responses are reassuring.
Limitations of the proposed approach to predict the CD4 range include, first, the instances in which the prediction model makes a “serious error.” While predicting an erroneous CD4 range either below or above the PCP cutoff is undesirable, predicting a high CD4 count when in actuality it is low could have serious implications in terms of the start of OI prophylaxis. We called these serious errors and tried to identify their frequency. The number of patients in whom a serious error was committed was quite small. While we tried to minimize such errors by placing filters on the variables included in the model (patients with high viral loads and/or those lacking recent viral load and CD4 information were excluded in Models II, III, and IV), we propose that such errors can potentially be further reduced by routinely testing the CD4 count in any patient in whom the predicted value and the last actual CD4 count fall on different sides of the PCP cutoff point. Additionally, clinicians may elect to not use the prediction model in patients whose last CD4 count is already close to the PCP cutoff point. Second, from a generalizability standpoint, in its current form, applying this method into routine practice requires the statistics software, program code, and a person trained to input the data. Ongoing efforts to create simple to use algorithms or embedding the statistical codes into the background of a web-based calculator are underway. Third, intuitively, this method is best applied at institutions that have a patient population similar to what was used to construct the tree. Despite these caveats, validating this model across different patient populations is feasible. Finally, since the decision tree is based on recognizing systematic patterns in grouped observations it is ideally applied to group-level rather than individual-level data. Since the predictor variables used are already available (last CD4 count/HIV RNA value, age of the patient, and time interval since the patient's last visit), even the ideal requirement of grouped data should not hinder the practical applicability of this method. Clinicians could potentially apply this method to predict the CD4 count of all the patients coming in for scheduled visits over a specific time period in the near future.
Overall in pediatric patients on HAART we find the use of recursive partitioning-based regression tree analysis a novel approach to predict a patient's CD4 count and ultimately reduce the frequency of testing. Not only does this potentially cost-saving strategy have appeal for widespread applicability, but such modeling approaches have broader implications guiding the frequency of tests used for monitoring HIV.
Footnotes
Acknowledgments
This work was supported by National Institutes of Health grant CA21765 and the American Lebanese Syrian Associated Charities (ALSAC).
Author Disclosure Statement
No competing financial interests exist.