
Abstract
The influence of efavirenz, etravirine, raltegravir, and nevirapine administration on the pharmacokinetics of ritonavir-boosted darunavir was investigated using population pharmacokinetics analysis. The population was composed of 142 patients infected with HIV: darunavir plus nucleoside/nucleotide reverse transcriptase inhibitors (NRTI), 54 patients (group A); darunavir plus efavirenz±NRTI, 4 patients (group B); darunavir plus etravirine±NRTI, 5 patients (group C); darunavir plus nevirapine±NRTI, 21 patients (group D); darunavir plus raltegravir±NRTI, 38 patients (group E); and darunavir plus raltegravir and etravirine±NRTI, 20 patients (group F). A significant increase in darunavir clearance in combination with nevirapine (+66%) and efavirenz (+235%) was observed. A significant decrease (p<0.05) in trough plasma concentration was observed in groups B and D compared with the other groups. Our study indicates that the combination of ritonavir-boosted darunavir and etravirine or raltegravir has no significant influence on the pharmacokinetics of darunavir in contrast to the combination of ritonavir-boosted darunavir and nevirapine or efavirenz, which involves an increase in darunavir clearance and a decrease in the plasma concentration of darunavir.
Introduction
D
In patients infected with HIV, darunavir/ritonavir increased nevirapine exposure when darunavir and ritonavir exposures were similar to historical data. 4 However, this study was performed using lower than the approved doses of darunavir. The coadministration of etravirine and ritonavir-boosted darunavir involves a minor increase in darunavir exposure 10 and the addition of etravirine to raltegravir and darunavir/ritonavir leads to a significant increase in darunavir exposure without requiring dose adjustments. 3,11 In healthy volunteers, the trough plasma concentrations of darunavir were found to be significantly reduced when given in combination with efavirenz. 12 Raltegravir is metabolized by UDP-glucuronosyltransferase 1A1 (UGT1A1) and is not a substrate, an inducer, or an inhibitor of CYP450 3A4. 13,14 Consequently, no pharmacokinetic interaction is expected when darunavir is boosted with ritonavir. However, an increase in darunavir clearance, which was associated with no significant difference in darunavir trough plasma concentrations in patients receiving raltegravir plus darunavir compared with values measured in patients not given raltegravir, was observed. 15 To explain this result, the hypothesis that raltegravir could affect darunavir pharmacokinetics by inducing activity of the ABCC1 transporter, which has a role in the disposition and elimination of darunavir, was proposed. 15 Another study showed that the combination of darunavir and raltegravir was related to lower darunavir trough concentrations in HIV-infected patients. 16 A previous study reported no effect of raltegravir on darunavir pharmacokinetics. 17
Because some of these results are unexpected, discordant, observed in healthy volunteers and not in HIV-infected patients, or with unapproved doses of darunavir, the influence of efavirenz, nevirapine, etravirine, or raltegravir administration on the pharmacokinetic properties of ritonavir-boosted darunavir in HIV-infected patients was investigated retrospectively from data obtained from the daily hospital routine of therapeutic drug monitoring. An original approach based on population pharmacokinetics, which was successfully used to study the effect of darunavir on nevirapine pharmacokinetics, was adopted. 18
Materials and Methods
Patients
The population comprised 142 patients infected with HIV (108 males, 34 females) with a mean age of 44.8 years. The median (range) CD4 cell count and plasma viral load were 509/mm3 (23–1,336 /mm3) and <20 (<20–359) HIV RNA copies/ml. Seventy percent of patients had an undetectable viral load. Fifty-eight patients were treated with a regimen containing darunavir/ritonavir (900 mg/100 mg) once daily, 3 patients with a regimen containing darunavir/ritonavir (900 mg/100 mg) twice daily, 2 patients with a regimen containing darunavir/ritonavir (1,200 mg/100 mg) once daily, 11 patients with a regimen containing darunavir/ritonavir (800 mg/100 mg) once daily, and 68 patients with a regimen containing darunavir/ritonavir (600 mg/100 mg) twice daily. Darunavir boosted with ritonavir was associated with nucleoside/nucleotide reverse transcriptase inhibitors for only 54 patients (group A), with efavirenz (600 mg once daily) combined or not with nucleoside/nucleotide reverse transcriptase inhibitors for 4 patients (group B), with etravirine (200 mg twice daily) combined or not with nucleoside/nucleotide reverse transcriptase inhibitors for 5 patients (group C), with nevirapine (200 mg twice daily) combined or not with nucleoside/nucleotide reverse transcriptase inhibitors for 21 patients (group D), with raltegravir (400 mg twice daily) combined or not with nucleoside/nucleotide reverse transcriptase inhibitors for 38 patients (group E), and with raltegravir (400 mg twice daily) plus etravirine (200 mg twice daily) combined or not with nucleoside/nucleotide reverse transcriptase inhibitors for 20 patients (group F). The patients were not required to give informed consent because the data were derived retrospectively from a therapeutic drug monitoring program and were reported anonymously in accordance with ethical guidelines. For each patient, one or two samples were collected at steady state (at least 15 days after the start of therapy). The time since the last dose ranged from 2.5 to 28.25 h.
Plasma sample analysis
The plasma concentration of darunavir was determined according to a previously validated liquid chromatography–tandem mass spectrometry (LC-MS/MS) assay. 19 Briefly, plasma pretreatment was limited to protein precipitation with a mixture of methanol and zinc sulfate. After centrifugation, the supernatant was injected into the chromatographic system, which consisted of online solid phase extraction followed by separation on a phenyl–hexyl column. The limit of quantitation was 0.1 mg/liter. The method was accurate (interday and intraday inaccuracy ≤15%) and precise (interday and intraday imprecision ≤15%).
Population pharmacokinetic analysis
Basic pharmacokinetic model
The data were analyzed by a nonlinear mixed effect modeling method using NONMEM Version VI level 1.0. Two kinds of structural model were tested: a one-compartment model with first-order absorption (ADVAN2 TRANS2) and a two-compartment model with first-order absorption (ADVAN4 TRANS4). The estimates of the basic pharmacokinetic model are as follows: V/F (volume of distribution), Ka (absorption rate constant), Cl/F (apparent clearance) for the one-compartment model and Cl/F (apparent clearance), V2/F (apparent central volume of distribution), Q/F (apparent intercompartmental clearance), V3/F (apparent peripheral volume of distribution); Ka for the two-compartment model with F denotes bioavailability. Interindividual variability and residual variability were estimated using an exponential error model.
Selection of covariates
An initial analysis was conducted by having NONMEM estimate the parameters of the basic model without covariates. The influence of each patient's covariates [gender (1 for males, 0 for females), age, coadministration of nevirapine or efavirenz, or etravirine or raltegravir] on the parameters of the pharmacokinetic model of darunavir was assessed by sequentially adding the covariates in the basic model. The influence of these fixed effects was evaluated with the objective function value. An objective function decrease of at least 3.8 (χ2, p<0.05, 1 degree of freedom) was considered significant. An intermediate multivariate model was obtained and included all significant covariates. During the backward stepwise multiple regression analysis, a change of 10.8 (χ2 p<0.001, 1 degree of freedom) in the objective function in the final multivariate model was required for the retention of a single covariate. This higher level of significance was chosen to include only covariates with strong associations with the pharmacokinetic parameters. Models were also assessed by visual examination of the plots. From the final model, the individual predicted concentrations were estimated by post hoc assessment. The individual trough plasma concentrations were estimated by this method for 18 patients who did not have a recorded trough [12±2 h after last dose intake (darunavir/ritonavir twice daily) or 24±2 h after last dose intake (darunavir/ritonavir once daily)].
Bootstrap
Bootstrap procedures were performed using Wings for NONMEM (
Statistical analysis
The daily darunavir trough plasma concentrations for the six groups of patients defined previously were compared using one-way analysis of variance (p<0.05 for significance). If the ANOVA test was positive, a Student–Newman–Keuls test for pairwise comparison of groups was performed.
Results
A one-compartment model was selected as the basic pharmacokinetic model rather than a two-compartment model because no significant improvement in the objective function was found with the two-compartment model. In the initial analysis, nevirapine and efavirenz coadministration are the single covariates that significantly affect darunavir pharmacokinetics. A relationship between Cl/F and the presence of nevirapine and efavirenz in the antiretroviral regimen [Cl/F=7.12×(nevirapine in the antiretroviral treatment=1)+25.2×(efavirenz in the antiretroviral treatment=1)+10.7] was established.
This result indicates that nevirapine and efavirenz coadministration with darunavir increases the clearance of darunavir by 66% and 235%, respectively. A decrease in the objective function (from 265.7 in the basic pharmacokinetic model to 230.2 in the final model) exceeded the objective function cut-off value of 10.8 for each covariate. An improvement in the relationship between residuals [C obs – C pred, where C obs is the observed concentration measured by the LC/MS-MS assay and C pred is the predicted concentration calculated by the mathematical model] versus C pred was observed. The equation established by linear regression [C obs – C pred=0.559 – 0.215×C pred for the basic model versus C obs – C pred=0.338 – 0.133×C pred for the model including the relationship between Cl/F and nevirapine/efavirenz administration] is closer to the theoretical equation [C obs – C pred=0] for the model including the relationship between Cl/F and nevirapine/efavirenz administration.
The median values obtained from the bootstrap procedures are presented in Table 1. The estimates for the pharmacokinetic parameters for darunavir are similar to the bootstrapped medians of the 200 estimates. The mean darunavir trough plasma concentrations [mean±standard deviation mg/liter (% CV) group A, 2.42±1.78 (73%); group B, 0.55±0.67 (123%); group C, 2.59±1.25 (48%); group D, 1.34±1.42 (106%); group E, 2.99±1.40 (47%); group F, 3.01±1.53 (51%)] are significantly different between groups (p<0.001) (Fig. 1). The mean trough plasma concentrations of darunavir are significantly (p<0.05) lower in the groups of patients on an antiretroviral regimen containing darunavir plus nevirapine (group D) and darunavir plus efavirenz (group B) in comparison with other groups.
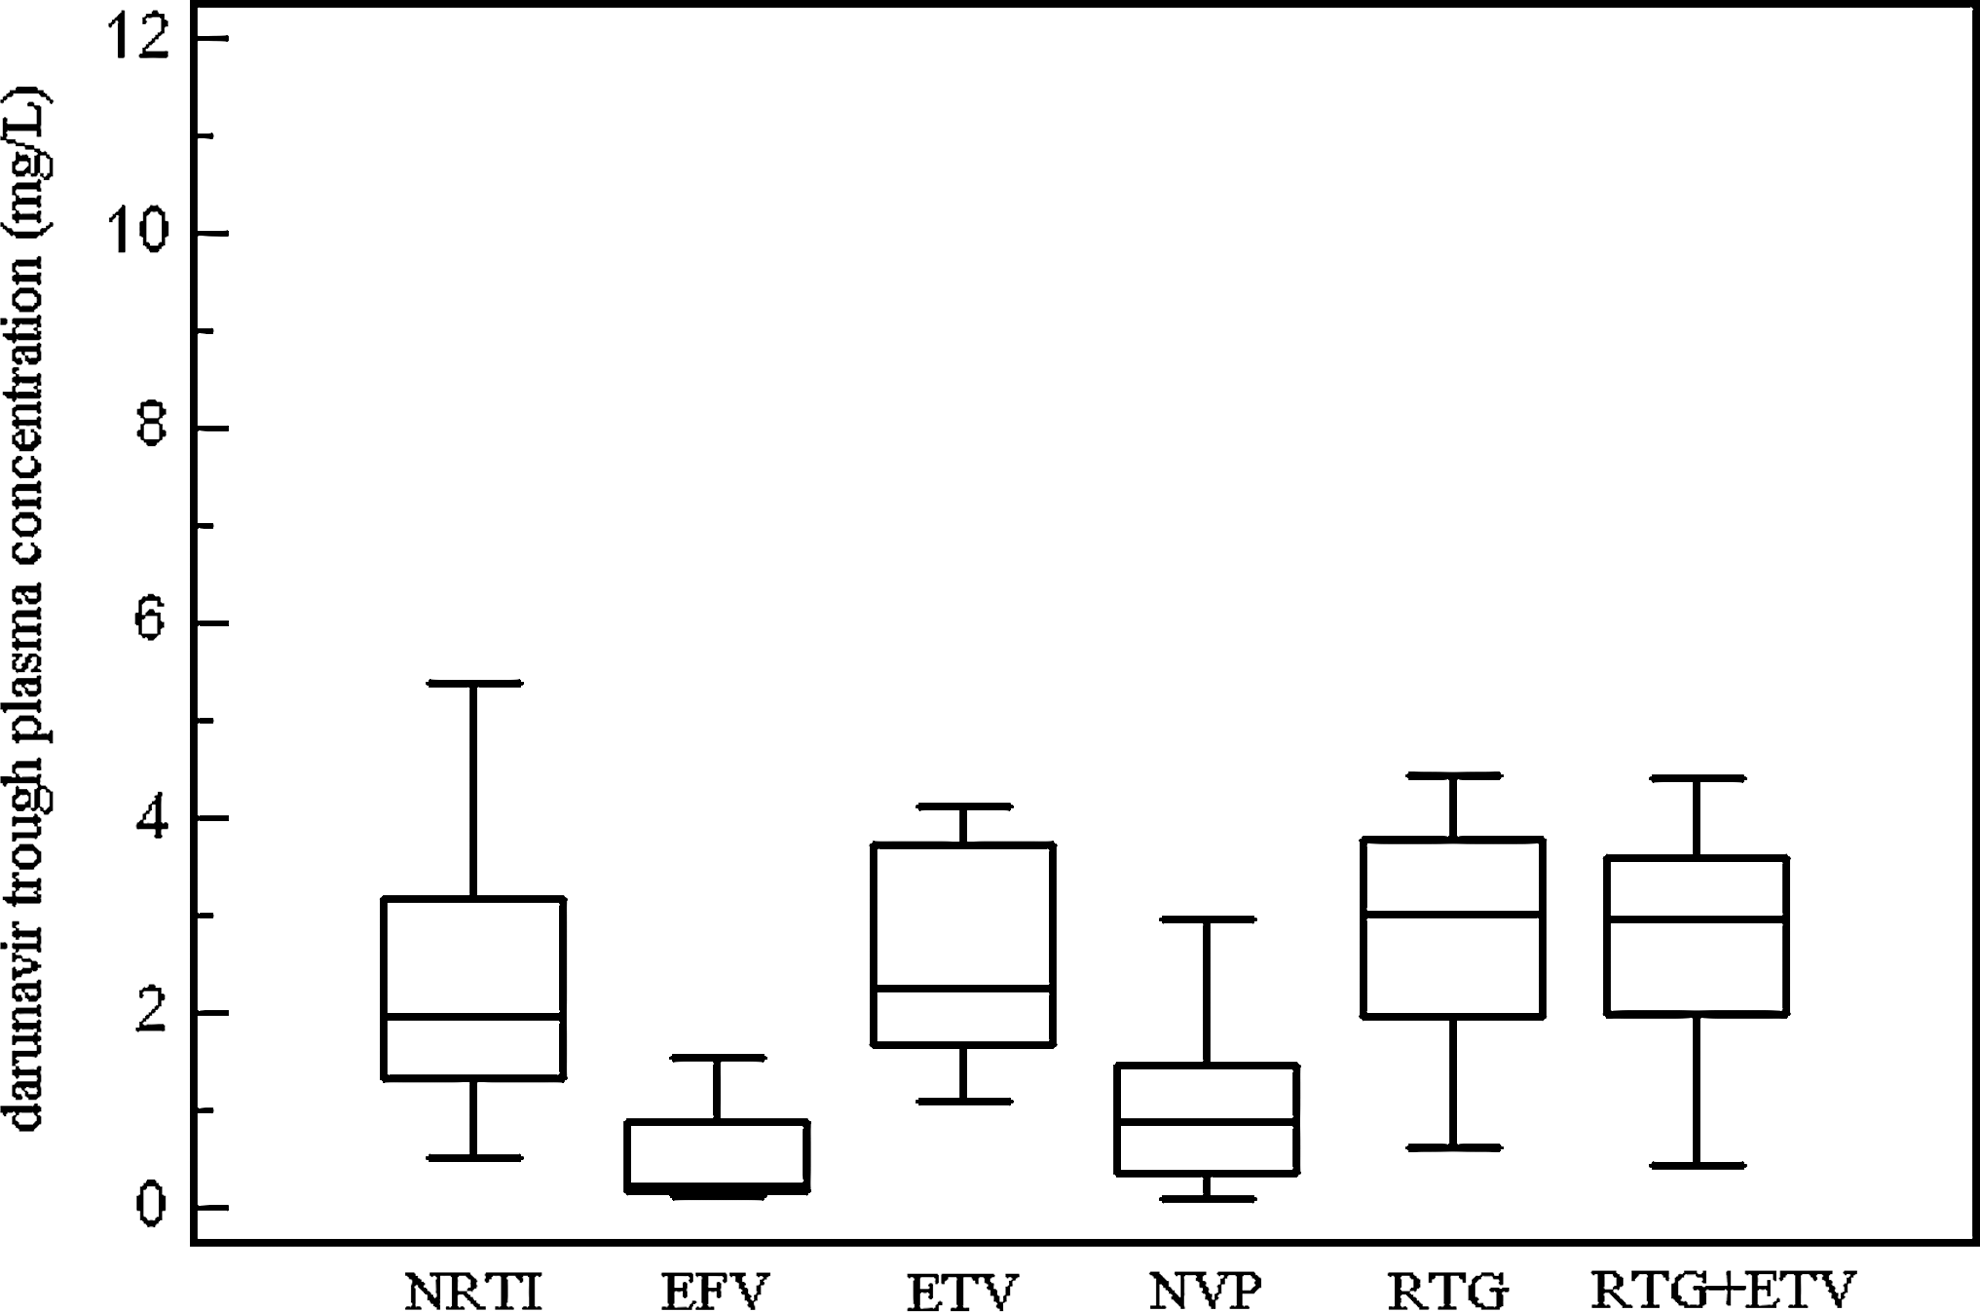
Comparison between darunavir trough plasma concentrations in HIV-infected patients treated with ritonavir-boosted darunavir associated with nucleoside/nucleotide reverse transcriptase inhibitors (NRTI) (n=54), with efavirenz (EFV) combined or not with NRTI (n=4), with etravirine (ETV) combined or not with NRTI (n=5), with nevirapine (NVP) combined or not with NRTI (n=21), with raltegravir (RTG) combined or not with NRTI (n=38), and with raltegravir plus etravirine combined or not with NRTI (n=20). The central box represents the values from the lower to the upper quartile (25th to 75th percentile). The middle line represents the median. A line extends from the minimum to the maximum value.
Cl/F=THETA1+THETA2×[nevirapine coadministration (0 or 1)]+THETA3×[efavirenz coadministration (0 or 1)].
Discussion
This work investigated the influence of efavirenz, nevirapine, raltegravir, and etravirine coadministration on ritonavir-boosted darunavir pharmacokinetics in HIV-infected patients using retrospective data resulting from routine therapeutic drug monitoring. No improvement in the darunavir pharmacokinetic model was observed with a two-compartment model in our study. In previous studies with intensive blood sampling, a two-compartment model was used to describe the pharmacokinetics of darunavir. 20 –22 This discordance can be explained by the sparse data sampling in our study in the setting of routine therapeutic drug monitoring. However, this approach makes our results closer to daily clinical practice and the estimates for the volume of distribution and clearance of darunavir without coadministration of nevirapine or efavirenz are consistent with previous results. 3,20,21
According to Schöller-Gyüre et al., 10 no significant influence of etravirine on darunavir pharmacokinetics was found, which is consistent with the weak inducer effect of etravirine on drugs metabolized by CYP. 7 Similarly, no effect of raltegravir on darunavir pharmacokinetics was observed. This result confirms the results of Garvey et al. 17 and does not confirm previous data indicating that raltegravir coadministration increased darunavir clearance 15 and decreased darunavir trough plasma concentration. 16 An increase in darunavir clearance in combination with nevirapine and efavirenz associated with a decrease in darunavir trough plasma concentration was found, which could be explained by the inducer effect of these drugs on the metabolism of darunavir. 9 The decrease in darunavir exposure in combination with efavirenz was previously described in healthy volunteers. 12,21
Although the size of the efavirenz group was limited, our results confirm that this combination should be used with caution in patients infected with HIV. 3 In our study, the increase in darunavir clearance is more marked with efavirenz than with nevirapine. This phenomenon is associated with a large interindividual variability and darunavir dose adjustment in combination with nevirapine is not required systematically. However, our study suggests that monitoring of darunavir trough plasma concentration is recommended when darunavir is combined with efavirenz or nevirapine, particularly in patients harboring highly resistant viruses, because a significant relationship between virologic success and darunavir trough plasma concentration was shown for these patients. 23
In conclusion, our study indicates that the combination of ritonavir-boosted darunavir and etravirine or raltegravir has no influence on darunavir pharmacokinetics contrary to the combination of ritonavir-boosted darunavir and nevirapine or efavirenz, which can involve a decrease in the plasma concentration of darunavir.
Footnotes
Author Disclosure Statement
Clotilde Allavena has received travel sponsorship or honoraria from Merck Sharp & Dohme, Tibotec and Bristol Myers Squibb. No competing financial interests exist for the other authors.