




Abstract
Human T lymphotropic virus type I (HTLV-1) is the etiological agent of HTLV-1-associated myelopathy/tropical spastic paraparesis (HAM/TSP). CD8+ T cells may contribute to the protection or development of HAM/TSP. In this study we used SAGE methodology to screen for differentially expressed genes in CD8+ T cells isolated from HTLV-1 asymptomatic carriers (HAC) and from HAM/TSP patients to identify genes involved in HAM/TSP development. SAGE analysis was conducted by pooling samples according to clinical status. The comparison of gene expression profiles between HAC and HAM/TSP libraries identified 285 differentially expressed tags. We focus on cytotoxicity and cytokine-related genes due to their potential biological role in HTLV-1 infection. Our results showed that patients with HAM/TSP have high expression levels of degranulation-related genes, namely GZMH and PRF1, and of the cytoskeletal adaptor PXN. We found that GZMB and ZAP70 were overexpressed in HTLV-infected patients compared to the noninfected group. We also detected that CCL5 was higher in the HAM/TSP group compared to the HAC and CT groups. Our findings showed that CD8+ T cells of HAM/TSP patients have an inflammatory and active profile. PXN and ZAP70 overexpression in HTLV-1-infected patients was described for the first time here and reinforces this concept. However, although active and abundant, CD8+ T cells are not able to completely eliminate infected cells and prevent the development of HAM/TSP and, moreover, these cells might contribute to the pathogenesis of the disease by migrating to the central nervous system (CNS). These results should be further tested with biological functional assays to increase our understanding on the role of these molecules in the development of HTLV-1-related diseases.
Introduction
I
HAM/TSP is characterized by chronic and progressive inflammation of the central nervous system (CNS) in which the immune response appears to play an important role during disease development. Immune response is one of the factors that determine proviral load (PVL) and hence the risk of developing HAM/TSP. 11 Most genotypic studies on HTLV-1 show no association between genetic variants of the virus and the risk of developing HAM/TSP. 12,13 However, studies on the polymorphisms in genes related to the production of inflammatory interleukins and DC-sign receptors, 13 –15 done in HTLV-1-infected individuals, have found an association between disease susceptibility and/or development. Additionally, the high PVL, the invasion of infected cells to other compartments, and the low efficiency of the host immune response are factors also related to HAM/TSP development. 12,16
In fact, during HTLV-1 infection immune cells are strongly activated, mainly CD4+ and CD8+ T cells. 17,18 This increased immune response may contribute to tissue damage, as observed in the CNS of subjects who develop HAM/TSP. 19 It is unclear whether HTLV-1-specific CD8+ T cells are responsible for protecting against HAM/TSP by controlling PVL or they are the cause of the inflammatory disease themselves. 20 Nevertheless, these two mechanisms are not mutually exclusive.
As the immune response against HTLV-1 is regulated by many genes, differences in gene expression profiles of CD8+ T cells may contribute to the protection or development of HAM/TSP. Here we looked for differentially expressed genes in CD8+ T cells isolated from asymptomatic HTLV-1-infected individuals and individuals with HAM/TSP, in an attempt to identify genes involved in the development of HAM/TSP. A better knowledge of the molecular mechanisms involved in HTLV-1 infection may provide a better understanding of the regulatory network related to HTLV-1-associated diseases.
Materials and Methods
Patients and controls
HTLV-1 patients belong to the positive serology profile of blood donors of the Regional Blood Center of Ribeirão Preto, São Paulo, Brazil and of patients from the Neurology Department of the Clinical Hospital of the Faculty of Medicine of the University of São Paulo, Ribeirão Preto, Brazil. The diagnosis of HTLV-1 was established by antibody screening of serum/plasma samples using an enzyme immunoassay (rp21e-enhanced EIA; Cambridge Biotech), followed by in house polymerase chain reaction (PCR) confirmation for tax and LTR. 21 The study was approved by the Institutional Ethics Committee (process number 3083/2007) and all patients signed an informed consent before enrollment. A total of 40 ml of peripheral blood was obtained from HTLV-1 patients and healthy volunteers. A total of 83 samples were collected. The subjects were divided into three groups: (1) the control group (CT) composed by 40 non-HTLV-1-infected individuals; (2) the asymptomatic group (HAC) composed of 24 HTLV-1-asymptomatic carriers; (3) and the HAM/TSP group (HAM/TSP) with 19 patients. All HTLV-1-seropositive individuals were evaluated for clinical status according to the criteria previously described for ATLL and HAM/TSP. 22 None of the HTLV-1-seropositive individuals showed positive serology for other relevant blood-borne pathogens including hepatitis B virus, hepatitis C virus, human immunodeficiency virus, HTLV-2, Chagas disease, and syphilis. Individuals included in the control group who were blood donors also showed negative serology for these pathogens. Individuals who were not blood donors were screened for HTLV-1 infection and we applied an oral questionnaire in order to search for other infections and for any drug treatment. The individuals who reported any infection or antiinflammatory treatment were excluded from the study. All individuals were evaluated for white blood cell (WBC) count and CD4+ and CD8+ T cell counts. The mean age was around 42.0 (range from 20 to 71) and 55.0 (range from 34 to 75) years old for the HAC and HAM/TSP groups, respectively. Of the HAM/TSP group 84.2% was composed of infected females, whereas 54.2% of the HAC group was composed of females. Of the CT group 75% was composed of women and the mean age was 43.2 years old (range from 22 to 76). The sex and age distribution of the sample groups are shown in Table 1.
F, female; M, male; CT, control group; HAC, HTLV-1-asymptomatic carriers; HAM/TSP, HTLV-1-associated myelopathy/tropical spastic paraparesis.
Proviral load
The white cell layer was isolated by centrifugation at 900×g for 10 min at 4°C and transferred to sterile 15-ml polypropylene tubes. DNA was extracted from the buffy coat using a Super Quick Gene DNA Isolation kit (Analytical Genetic Testing Center, Denver, CO). After extraction, HTLV-1 PVL was determined by the quantitative PCR method using ABI Prism 7500 (Applied Biosystems) with 200 ng genomic DNA (roughly equivalent to 105 cells).
The reaction mixture was prepared using TaqMan Universal PCR Master Mix (Applied Biosystems) technology to amplify HTLV-1 tax and human actin beta (ACTB) genes. The primer set for the HTLV-I tax region was 5′-CGG ATA CCC IGT CTA CGT GTT T-3′ and 5′-CTG AGC IGA IAA CGC GTC CA-3′ and the TaqMan fluorescent probe for the tax gene was 5′-ATC ACC TGG GAC CCC ATC GAT GGA-3′. 23 To amplify the ACTB region we used the TaqMan Gene Expression Assays–Hs03023880_g1 (Applied Biosystems). The PCR conditions for tax amplification were 6.25 μl of the TaqMan Universal PCR Master Mix, 5 μM of each primer, and 5 μM of probe (Applied Biosystems). For ACTB amplification the reaction conditions were 5.0 μl of TaqMan Universal PCR Master Mix and 0.5 μl of probe. The thermal cycler settings were 50°C for 2 min, 95°C for 10 min, and 40 cycles at 95°C for 15 s and 60°C for 1 min. DNA standards were extracted from the MT-2 cell line to make a standard curve. Based on the standard curve created by six concentrations of template (101 to 106 copies), the concentrations of unknown samples were determined. The amount of HTLV-1 proviral DNA was calculated by the following formula: copy number of HTLV-1 tax per 1×10⁵ PBMCs=[(copy number of tax)/(copy number of ACTB)]×2×10⁵. All samples were duplicated.
CD8+ T cell separation
Peripheral blood mononuclear cells (PBMCs) were separated from whole blood using the Ficoll-Paque PLUS density gradient (GE Healthcare Bio-Sciences AB, Uppsala, Sweden) and stored in fetal bovine serum (FBS) containing 10% dimethyl sulfoxide (DMSO) at N2 for posterior stained and flow cytometry analysis. CD8+ T cells were isolated using anti-CD8 Ab-coated microbeads by passing PBMCs through a magnetic cell separation system (MACS; Miltenyi Biotec, Bergish Glabach, Germany) with column type LS. The positively selected cells were confirmed as being CD8+ T cells by flow cytometry analysis (FACSCalibur, Becton & Dickinson, San Jose, CA).
Tax expression
PBMCs isolated from 14 HAC and 11 HAM/TSP patients were stained with anti-Tax and analyzed by flow cytometry to quantify the amount of cells that are capable of expressing Tax. PBMCs were cultured in RPMI-1640 medium (Sigma-Aldrich) supplemented with 10% of FBS, 2 mmol/liter glutamine, 100 IU/ml penicillin, 100 μg/ml streptomycin, and 20 nmol/liter concanamycin A (CMA) (Sigma-Aldrich) for 14 h. Harvested cells were washed with phosphate-buffered saline (PBS) and stained with antihuman-CD4-phycoerythrin (PE), antihuman-CD8-PE, and anti-human-CD3-Peridinin Chlorophyll Protein (PerCP) (Becton & Dickinson). Cells were fixed in PBS 1×containing 4% (v/v) paraformaldehyde (Sigma-Aldrich) for 20 min and resuspended in PBS. Fixed cells were washed with PBS containing 4% normal goat serum (Sigma-Aldrich) and permeabilized with PBS containing 0.1% (v/v) Triton X-100 (Sigma-Aldrich) for 7 min at room temperature. Permeabilized cells were washed, resuspended in PBS/4% normal goat serum containing an anti-Tax MAb (Lt-4), 24 and incubated for 30 min. After washing, Alexa Fluor 488-conjugated antimouse IgG3 serum (Invitrogen, Carlsbad, CA) was used as the second antibody for labeling anti-Tax. Finally, the cells were washed twice, analyzed by flow cytometry (FACSCalibur, Becton & Dickinson), and the proportion of CD8+ T cells positive for Tax protein was estimated, indicating the number of CD8+ T cells infected by HTLV-1 capable of expressing the Tax protein.
SAGE procedure
Analysis of the SAGE global gene expression profile was conducted by pooling samples according to clinical status into the HAC and HAM/TSP groups. Each pool was composed by equal amounts of RNA of four individuals whose CD8+ T cells purity was above 80%. Thus, the HAC group was composed of HAC 01, HAC 09, HAC 10, and HAC 11 samples. The HAM/TSP group was composed of HAM/TSP 01, HAM/TSP 05, HAM/TSP 08, and HAM/TSP 09 (Table 2). Total RNA was isolated from CD8+ T cells using TRIzol LS Reagent (Invitrogen) according to the manufacturer's instructions. Twenty-five micrograms of total RNA was used for the SAGE procedure carrying out the I-SAGE Kit (Invitrogen) based on the original SAGE. 25 Amplified inserts were sequenced with forward M13 primer in a MegaBACE 1000 sequencer and the DYEnamic ET Dye Terminator Sequencing Kit (Amersham Biosciences, Piscataway, NJ).
F, female; M, male; HAC, HTLV-1-asymptomatic carriers; HAM/TSP, HTLV-1-associated myelopathy/tropical spastic paraparesis; ND, not determined.
SAGE analysis
HAC and HAM/TSP SAGE tags were extracted from concatamer sequences and analyzed by SAGE 2000 software, version 4.5 (
Real-time quantitative PCR
For qRT-PCR analysis, we studied a total of 55 samples, including the eight samples used to prepare SAGE libraries. Of the total, 24 were CT individuals, 17 were HAC, and 14 had HAM/TSP.
The RNA was reverse transcribed using a High Capacity cDNA Reverse Transcription Kit (Applied Biosystems). Real-time quantitative PCR was conducted in the cDNA of 55 individuals (unpooled) and was performed in 7,500 Real-Time PCR System (Applied Biosystems) using TaqMan Gene Expression Assays (Applied Biosystems) as recommended by the manufacturer. Primers (Applied Biosystems) for the following functionally diverse set of genes were used: perforin 1 (PRF1) (Hs00169473_m1), granzyme B (GZMB) (Hs0018051_m1), granzyme H (GZMH) (Hs00277212_m1), chemokine (C–C motif) ligand 5 (CCL5
Quantitative flow cytometry analysis
PBMCs were analyzed by quantitative flow cytometry for PRF1 and GZMB. Frozen PBMCs were used for intracellular staining of PRF1 and GZMB. A total of nine uninfected individuals, 15 and 14 patients from the HAC and HAM/TSP groups, respectively, were analyzed. Samples were thawed and washed with PBS and stained with antihuman-CD8-FITC or antihuman-CD8-PE, and with antihuman-CD3-PerCP (Becton & Dickinson). Cells were fixed in PBS containing 4% (v/v) paraformaldehyde (Sigma-Aldrich) and permeabilized with PBS containing 0.1% (v/v) Triton X-100 (Sigma-Aldrich). After washing, the cells were incubated with antihuman-PRF1-clone δG9 anti-PRF1-PE or anti-GZMB-FITC (Becton & Dickinson). Finally, the cells were washed and analyzed by flow cytometry (FACSCalibur, Becton & Dickinson). The mean fluorescence intensity (MFI) was determined, indicating the protein expression level.
Statistical analyses
The statistical analyses to compare the differences in PVL between the HAC and HAM/TSP groups were performed using the Mann–Whitney test. The Mann–Whitney test was also used to evaluate the differences in gene expression quantification between the two groups. Data related to expression levels among three groups were compared by ANOVA followed by Tukey post hoc analyses. To draw correlations between PVL and gene expression we used the nonparametric Spearman test. The statistical analyses were performed using SPSS software version 14. Values of p lower than 0.05 were considered statistically significant.
Results
Epidemiological and clinical features of HTLV-1-infected patients
A total of 83 individuals were tested; of them, 40 were CT individuals, 24 were HAC, and 19 had HAM/TSP. The values of WBC ranged from 2,800 to 12,500 cells/mm3 but the mean value was similar among groups (Table 1). Nine samples (CT 03, CT 07, CT 08, CT 17, HAC 20, HAM/TSP 03, HAM/TSP 06, HAM/TSP 09, and HAM/TSP 15) showed a WBC count below the reference value whereas five samples (CT 05, CT 22, CT 39, HAM/TSP 12, and HAM/TSP 17) had higher values. For CD4+ and CD8+ count, the values were similar among groups (Table 1), ranging from 1.02 to 4.94. Three individuals (CT 16, HAC 15, and HAM/TSP 11) showed a CD4+/CD8+ ratio below 1.2. The PVL in the HAM/TSP group was six times higher (mean 1,075.1 copy number/105 cells) than in the HAC group (mean 173.5 copy number/105 cells) (p<0.05) (Table 1).
The proportion of CD8+ T cells infected by HTLV-1, evidenced by the Tax protein expression, was 2.2 times higher in the HAM/TSP group (1.607% mean value) compared to the HAC group (0.731% mean value) (p=0.0294).
SAGE library analysis
To access the identity of CD8+ T cell libraries, we used hierarchical cluster analysis to compare the gene expression profile of our libraries with data from libraries of different leukocyte types. The dendrogram revealed that lymphoid and myeloid cells clustered separately. Notably, CD8+ T cell libraries derived from HTLV-1-infected individuals were grouped together in the lymphoid cluster as shown in Fig. 1, indicating similarity in the gene expression patterns with lymphoid cells. HAC and HAM/TSP libraries also showed a tight correspondence, branching together.
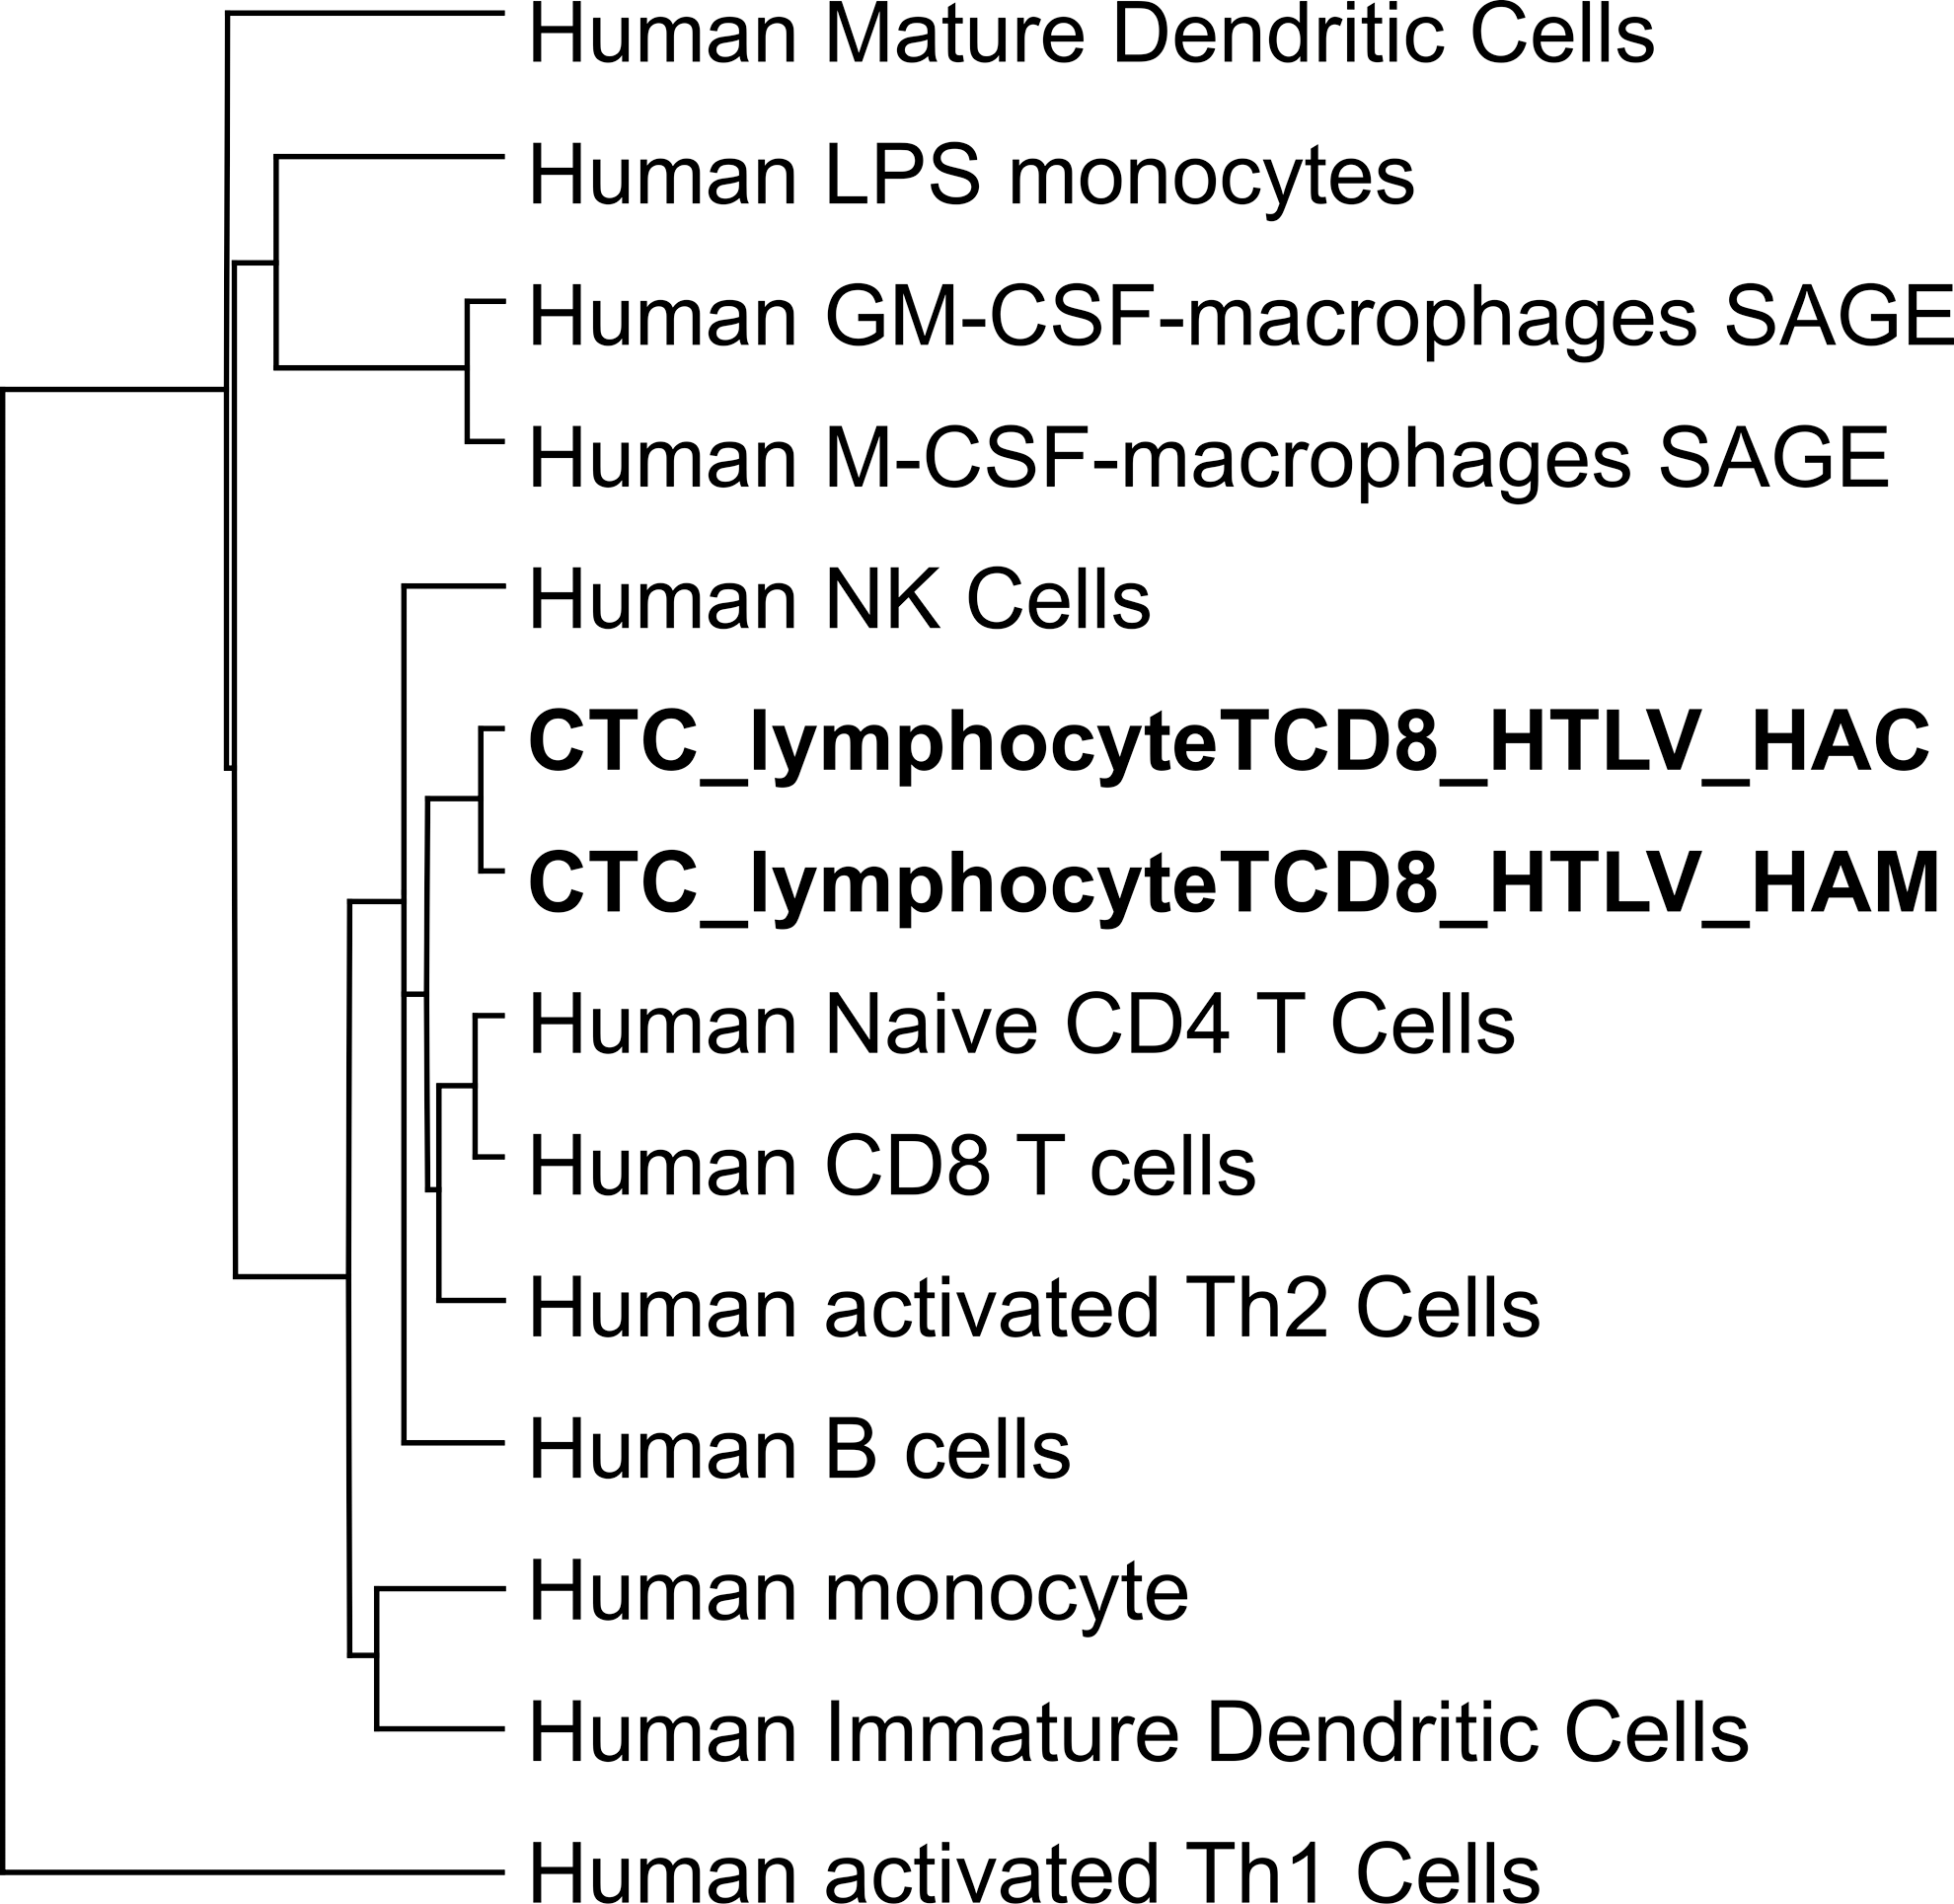
Hierarchical clustering of leukocytes, dendritic cells, macrophages, and CD8+ T cells isolated from human T lymphotropic virus type I (HTLV-1)-infected individuals. Briefly, a dendrogram was generated by pairwise average linkage (Euclidean distance) using Cluster 3.0 software. Myeloid and lymphoid cells were differentially clustering. CD8+ T cell libraries derived from HTLV-1-infected individuals were grouped together in the lymphoid cluster.
A total of 62,432 and 60,620 tags were sequenced from HAC and HAM/TSP libraries, respectively. These tags yielded 12,262 and 13,025 unique tags mapped to known genes. Most identified and mapped tags (60%) appeared only once. Both libraries showed a large number of ribosomal protein tags. Supplementary Tables S1 and S2 (Supplementary Data are available online at
Gene expression patterns observed in HAC versus HAM/TSP groups
We used SAGE libraries of pooled HAC and HAM/TSP CD8+ T cells to screen for differentially expressed pathways involved in HAM/TSP development. Comparison of gene expression profiles between the HAC and HAM/TSP groups showed 285 differentially expressed tags. Tables 3 and 4 show the top 20 increased tag-associated transcripts in the HAC and in the HAM/TSP libraries, respectively. Of the 285 deregulated tags observed between HAC and HAM/TSP, 174 were overexpressed in the HAM/TSP group. To investigate the role of those differentially expressed tag-associated genes they were classified according to their biological function. We performed Ingenuity Pathways Analysis, which resulted in the annotation of the following most represented functional categories: apoptosis, cytolysis, cytotoxicity, cellular development, growth and proliferation, immunological and neurological diseases, inflammatory response, and diseases and infection. Additionally, we classified the differentially expressed genes into a number of functional categories according to Gene Ontology terms of interest (Table 5) to search for genes involved in HAM/TSP development. We found molecules related to immune response, such as zeta-chain (TCR)-associated protein kinase 70 kDa (ZAP70), leukocystatin (CST7), and linker for activation of T cells (LAT); apoptosis, such as granzyme H (GZMH), integrin beta 2 (ITGB2), and programmed cell death 4 (PDCD4); and inflammatory response, such as chemokine (C–C motif) ligand 5 (CCL5) and natural cytotoxicity triggering receptor 3 (NCR3), among others (Table 5).
HAC, HTLV-1-asymptomatic carriers; HAM/TSP, HTLV-1-associated myelopathy/tropical spastic paraparesis; FC, fold change; FDR, false discovery rate. The tag sequence represents the 10-bp SAGE tag. Normalized frequencies were obtained using SAGE software by calculating the total number of 300,000.
HAC, HTLV-1-asymptomatic carriers; HAM/TSP, HTLV-1-associated myelopathy/tropical spastic paraparesis; FC, fold change; FDR, false discovery rate. The tag sequence represents the 10-bp SAGE tag. Normalized frequencies were obtained using SAGE software by calculating the total number of 300,000.
HAC, HTLV-1-asymptomatic carriers; HAM/TSP, HTLV-1-associated myelopathy/tropical spastic paraparesis; FC, fold change. The tag sequence represents the 10-bp SAGE tag. Normalized frequencies were obtained using SAGE software by calculating the total number of 300,000.
Gene expression patterns observed in CT versus HTLV-1-infected groups (HAC or HAM/TSP)
We searched for differentially expressed tags between a public library of CD8+ T cells from normal healthy volunteers (CT) and HAC and also between CT and HAM/TSP in order to identify genes deregulated in HTLV-1 infection. Although this comparison has some drawbacks due to methodological and ethnical differences among samples, we could identify 899 differentially expressed tags from the comparison between CT and HAC, whereas CT and HAM/TSP revealed 855. From these tags we determined that many cytokine-related genes including chemokine (C–X–C motif) receptor 4 (CXCR4), interleukin 8 (IL-8), chemokine (C–C motif) ligand 20 (CCL20), and chemokine (C–C motif) receptor 7 (CCR7) were decreased in HTLV-1-infected groups (HAC and HAM/TSP), whereas IL-23, alpha (IL23A), lymphotoxin beta (LTB), IL-24, and CCL5 expressions were increased, when compared to the CT library.
Genes related to cytotoxicity were also identified as differentially expressed between CT and HTLV-1-infected libraries. For example, GZMH and granzyme A (GZMA) have a higher expression in HTLV-1-infected individuals than in the CT group.
Expression levels of cytotoxicity and cytokines genes were different between HAC and HAM/TSP patients
To further investigate the involvement of specific genes in HTLV-1 infection based on fold change in SAGE libraries and on their biological function, we selected the CCL5, GZMH, and ZAP70 genes to assess their gene expression levels by real time PCR in 55 samples. We also tested the cytolytic genes granzyme B (GZMB) and PRF1 and the cytoskeletal adaptor paxillin (PXN) to better explore their associated pathways.
In SAGE libraries, CCL5 was 3.5 times higher, GZMH was 2 times higher, and ZAP70 was 5.8 times higher in the HAM/TSP group than in HAC (Table 5). When we compared the expression levels of GZMB, PRF1, and PXN between the HAC and HAM/TSP libraries, we found an expression ratio lower than 2.0.
Relative quantification of CCL5 and GZMH by qRT-PCR corroborated SAGE data showing that their expression levels were significantly higher in the HAM/TSP than in the HAC group and also than in the CT group (Fig. 2A and B). When we tested ZAP70 by qRT-PCR we found a different result from SAGE, since no difference was observed between the HAC and HAM/TSP groups. Interestingly, we found that all infected patients (HAC+HAM/TSP) showed a significantly higher expression level of ZAP70 than the CT group (Fig. 2E). Expression of the cytotoxicity gene PRF1 was significantly higher in the HAM/TSP group than in the CT group (Fig. 2C). Analyzing gene expression of PXN by qRT-PCR, we found a significant increase in the HAM/TSP group compared to the CT group and also compared to the HAC groups (Fig. 2D).

Gene expression in CT, HAC, and HAM/TSP CD8+ T cells using qRT-PCR.
We also tested expression levels of GZMB and although no difference was observed among the CT, HAC, and HAM/TSP groups, we found a significant increase in whole infected patients (HAC+HAM/TSP) compared to the CT group (Fig. 2F).
PRF1 and GZMB protein levels were differentially expressed among HAC and HAM/TSP groups
To more directly confirm the results of gene expression data, we quantified proteins level of PRF1 and GZMB by quantitative flow cytometry. When we performed intracellular staining of PRF1, we detected significantly higher MFI in the HAM/TSP group compared to the HAC group (Fig. 3A). Moreover, the GZMB intracellular expression also revealed a significant increase of MFI in HAM/TSP patients than the HAC group, as shown in Fig. 3B.
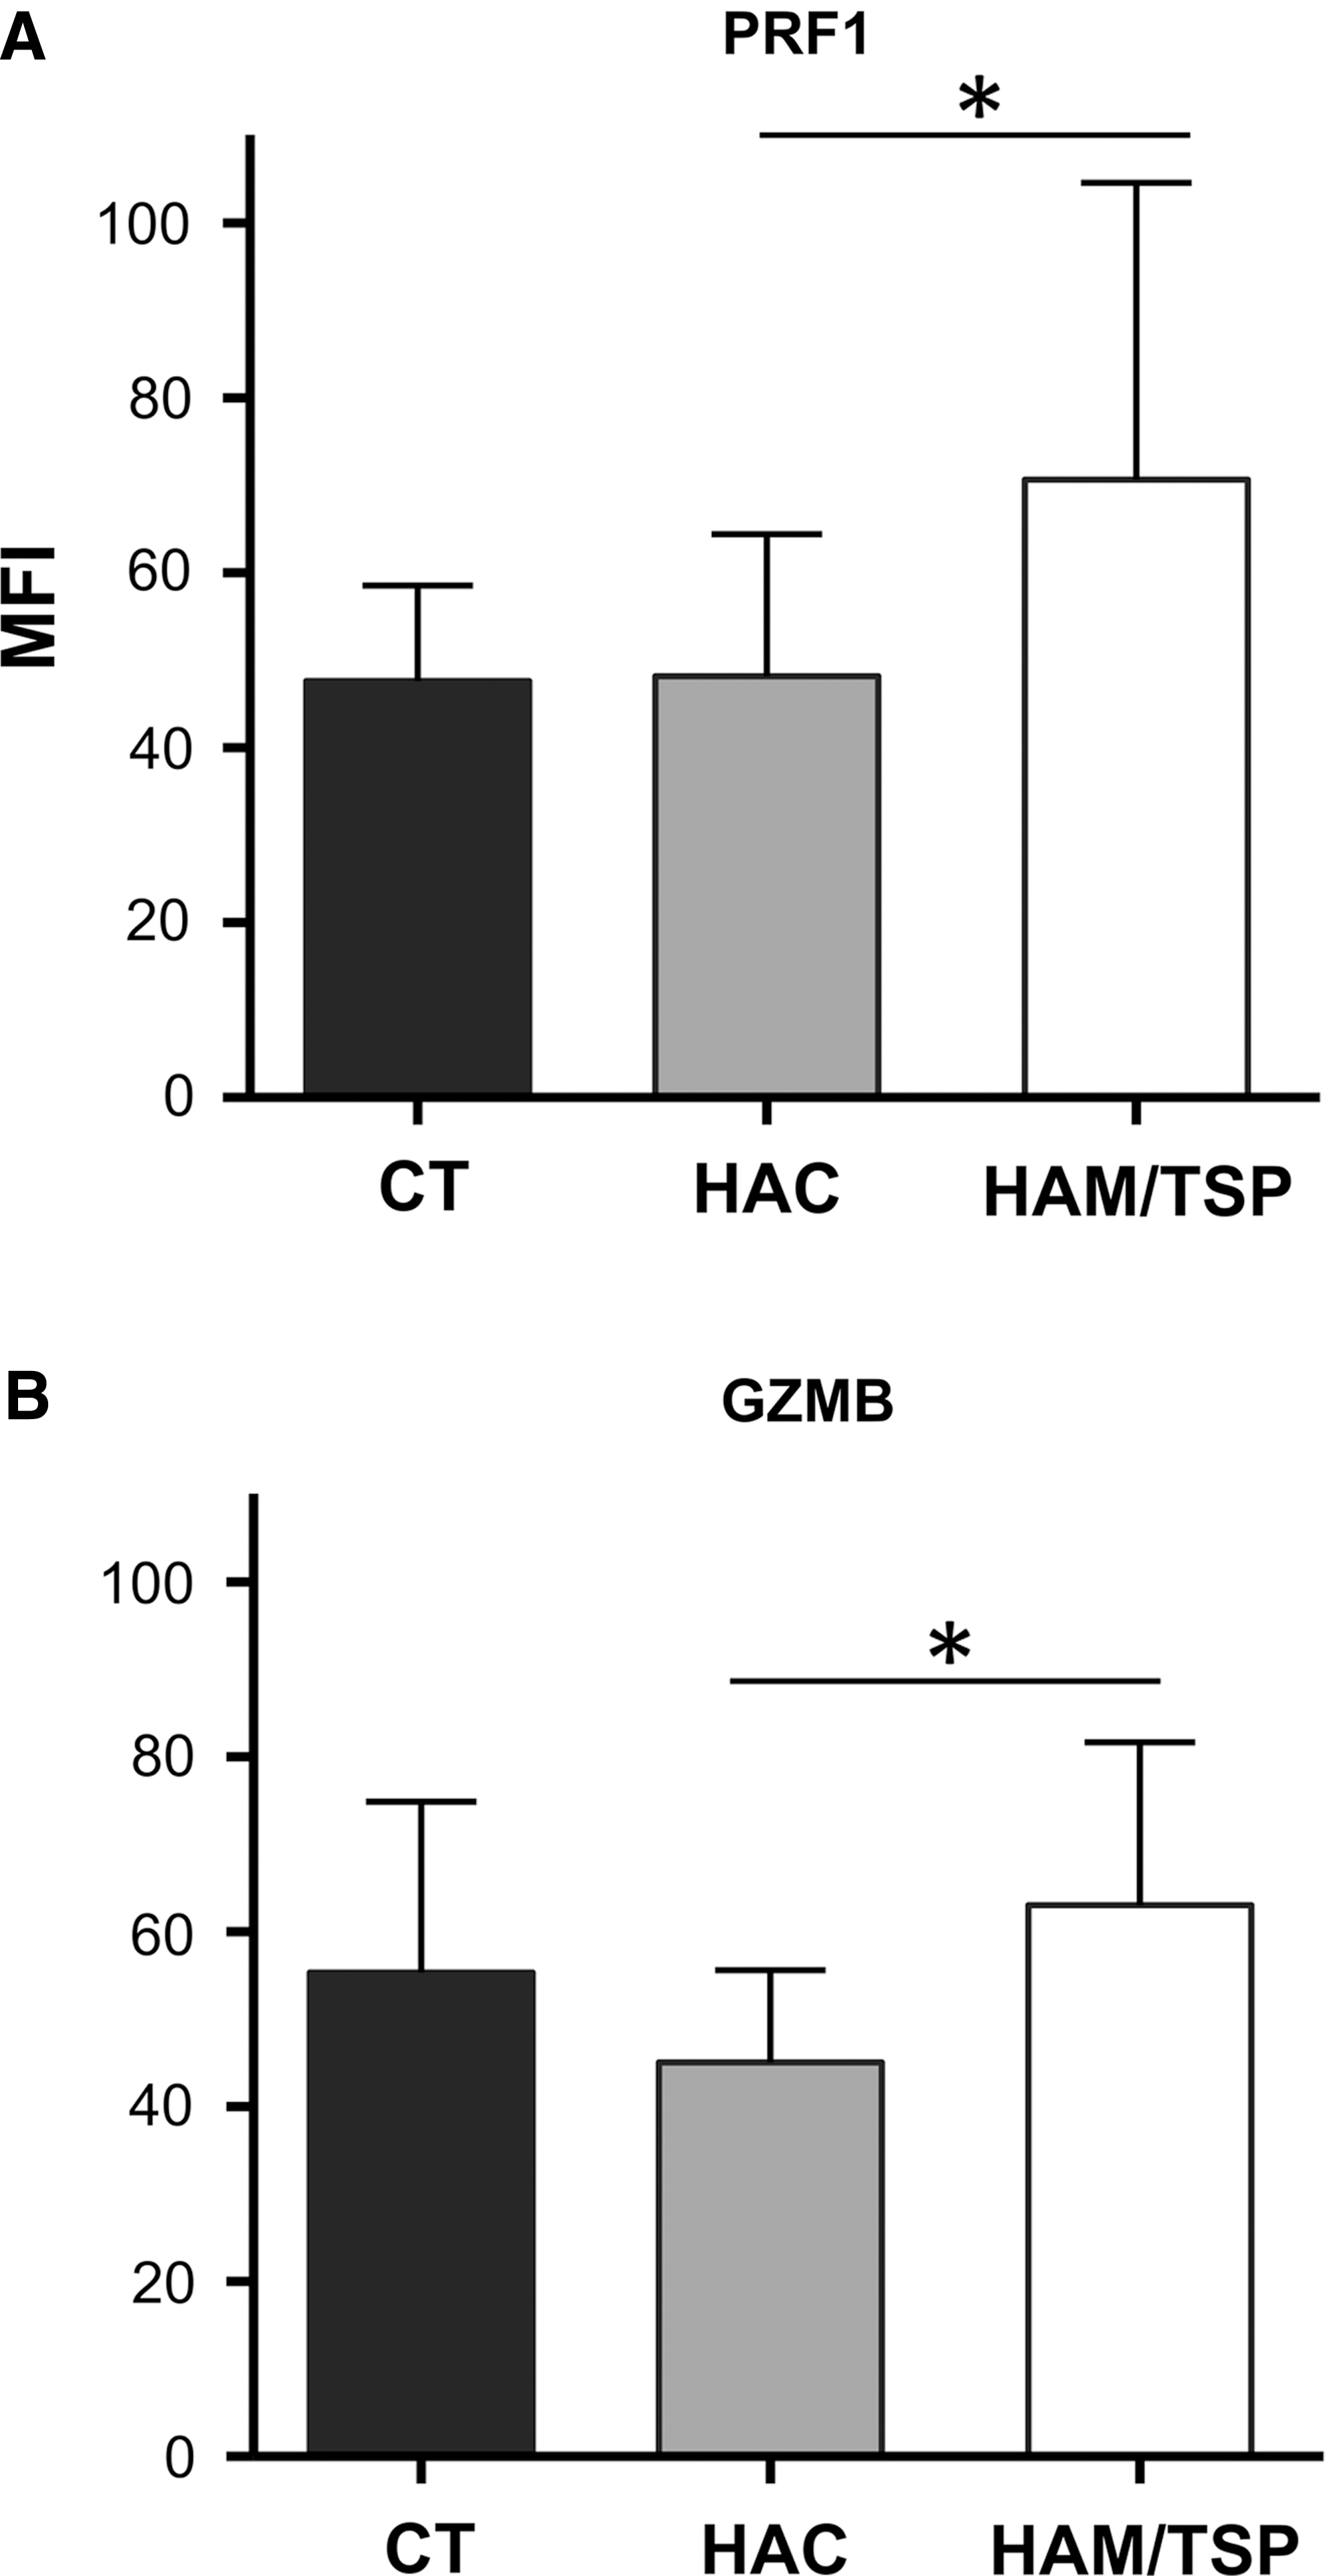
Quantitative flow cytometry of PRF1
Distinct correlation between gene expression and PVL
We considered if there was an association between PVL and the gene expression data and we saw no correlation among PVL and PRF1, GZMB, ZAP70, or PXN (p>0,05). However, PVL correlated positively with GZMH (r=0.3947, p=0.0345) and CCL5 (r=0.5257, p=0.0060).
Discussion
CD8+ T cells play an important role in HTLV-1 infection and their frequency and efficiency are related to PVL levels, which in turn might be associated with HAM/TSP development. In our study, we found that a distinct gene expression profile of CD8+ T cells between the HAC and HAM/TSP groups exists. Using SAGE methodology, we screened for some differentially expressed genes associated with a number of functional categories, including apoptosis, cytolysis, cytotoxicity, cellular development, growth and proliferation, immunological and neurological diseases, inflammatory response, and diseases and infection. Due to their potential biological role in HTLV-1 infection, we focus on cytotoxicity and cytokine-related genes and assessed the levels of expression of GZMB, GZMH, PRF1, ZAP70, PXN, and CCL5.
Our results showed that patients with HAM/TSP have high expression levels of genes related to cell-mediated lysis, namely GZMH and PRF1. Moreover, GZMH expression showed a significant positive correlation with PVL. In addition, we found that HTLV-infected patients (HAC+HAM/TSP) expressed higher levels of GZMB than the noninfected group (CT). In agreement with mRNA measurements, we detected higher protein expression levels of PRF1 and also of GZMB in HAM/TSP patients, compared to the HAC group.
CD8+ T cells are responsible for combatting target cells bearing antigens recognized by the T cell receptor (TCR). When CD8+ T cells encounter cells presenting HTLV antigens, they are supposed to release specialized granules containing cytolytic molecules, including perforin and granzymes, and to kill them. During HTLV-1 infection, overexpression of these cytolytic molecules, as we found here, might be explained as an effect of the vast antigen stimulus due to circulating infected cells, which is more prominent in HAM/TSP patients who have a high PVL. These findings suggest that CD8+ T cells are activated during HTLV-1 infection, mainly in HAM/TSP patients, although they are not able to limit viral replication and control disease development.
In contrast to our results, Sabouri et al. 32 detected that HTLV-1-infected individuals express lower protein levels of PRF1 as compared to CT. The same study found that GZMB shows higher levels in the HAM/TSP group than in HAC, corroborating our data. Vine et al. 33 compared the gene expression of CD8+ T cells from HTLV-1-infected individuals with low and high levels of PVL. They found that a number of genes related to cell-mediated lysis (including PRF1 and GZMB) were overexpressed in patients with low PVL, suggesting that there is an association between a strong cytotoxic CD8+ T cell activity and an effective HTLV-1 suppression, which diverges from our findings.
At this point we cannot explain these apparently contrasting results. In fact, the investigation of PRF1 and granzyme expression is complex. CD8+ T cell degranulation does not require new gene transcription and can occur within 30–60 min of stimulation 34 making mRNA and mainly protein measurement a challenge.
We also detected ZAP70 increased expression in HTLV-infected patients (HAC+HAM/TSP) compared to the noninfected group (CT), suggesting that CD8+ T cells of HTLV-1-infected individuals are activated. ZAP70 is a protein tyrosine kinase associated with TCR, which is involved in signal transduction that leads to cell response upon TCR activation. 35 The high ZAP70 expression can also be an effect of the vast antigens circulating during infection, as we proposed for cytolytic altered genes.
Another cytokine investigated in our study was CCL5 (RANTES), with higher expression in the HAM/TSP group as compared to the HAC and CT groups. This cytokine is associated with immunomodulation and inflammatory processes. In agreement with our findings, several studies have demonstrated that elevation of CCL5 expression is observed in HTLV-1-infected cell lines, in peripheral blood cells, and in lymph nodes from HAM/TSP and ATLL patients. 36 –38 High levels of this chemokine were also found in the cerebrospinal fluid from HTLV-1 patients. 38 It is likely that CD8+ T cells from HTLV-1-infected individuals are somehow chronically activated, probably in response to HTLV-1 antigens. Additionally, mediating leukocyte recruitment and T cell stimulation, CCL5 might play a role in HAM/TSP physiopathology.
At last, we detected an increase of PXN in the HAM/TSP group compared to the CT and to HAC groups. Paxillin is a cytoskeletal adaptor protein that plays an important role in cell adhesion and motility in adherent cells. During HIV-1 infection, PXN was described as a positive regulator of viral infection. In other words, PXN is involved in host cytoskeleton organization that allows viral entry in the target cell during virological synapse. 39 Additionally, in human cytomegalovirus infection, PXN regulation plays a role in the process of viral entry into monocytes and consequently in viral dissemination. 40 It is not clear what role PXN plays in T cells, but there is evidence that PXN is involved in CD8+ T cell degranulation in immunological synapse. Once TCR is activated, there is a microtubule organizing center reorientation, movement, and fusion of the cytolytic granules with the plasma membrane, with PXN involvement. 34 In this way, although there is no report of PXN participation in HTLV infection, as we found a high expression level of ZAP70 and of the cytolytic genes PRF and granzymes, we propose that PXN is overexpressed in HAM/TSP patients due to the intense granules releasing in the immunological synapses. PXN could also be involved in HTVL spread, although CD8+ T cells are not the main infected cells during the infection.
To investigate whether the gene expression differences found between the HAC and HAM/TSP groups were caused by the differences in PVL, we assessed the correlation between PVL and the gene expression data. We could not answer this question since half of the genes showed a correlation with PVL whereas the rest of them did not. The analysis of data with similar PVL and different clinical status would be useful to address the gene expression differences between the HAC and HAM/TSP conditions. However, in our cohort, we could not identify a group of HAC and HAM/TSP patients with similar PVL.
In this study, we analyzed the whole CD8+ T cell population, which comprises specific CD8+ T cells to a variety of antigens, including HTLV-1-specific CD8+ T cells, and also includes CD8+ T cells infected by HTLV-1. To identify genes involved in HTLV-1 infection, it would be preferable to study purified HTLV-1-specific CD8+ T cells; however, these cells were not isolated here because current quantification techniques of antigen-specific cells may modify gene expression. It is known that 10% of total circulating CD8+ T cells are HTLV-1-specific CD8+ T cells. 41 Thus, we believe that the gene expression profile generated here is most likely the result of virus-activated cells.
We also performed Tax protein quantification, which is a marker of proviral expression, to estimate the frequency of HTLV-1-infected CD8+ T cells capable of expressing Tax protein. We found that this frequency, despite being higher in HAM/TSP, was low in both groups, compared to the frequency of HTLV-1-infected CD4+ T cells (data not shown). Since HTLV-1-infected CD8+ T cells are not the main reservoir of HTLV-1 in vivo, we believe that the frequency of these cells did not undermine our results.
We found some discordant results among the different employed methodologies: SAGE, qRT-PCR, and flow cytometry. We understand that each methodology has its particularities and some inherent drawbacks, and we believe the main reason for our discordant findings is that we could not perform SAGE, qRT-PCR, and flow cytometry with the same number of samples.
Our findings showed that CD8+ T cells of HAM/TSP patients have an inflammatory and active profile. PXN and ZAP70 overexpression in HTLV-1-infected patients was described for the first time here and reinforces this concept. However, although active and abundant CD8+ T cells exist, they are not able to completely eliminate infected cells and prevent the development of HAM/TSP. Moreover, these active cells might contribute to the pathogenesis of the disease by migrating to the CNS, as we found deregulation of CCL5 expression in infected patients.
Our results provide a large-scale perspective of gene expression that should be further tested with biological functional assays to increase our understanding of the role these molecules play in the development of HTLV-1-related diseases.
Sequence Data
SAGE data have been deposited in the NCBI Gene Expression Omnibus (
Footnotes
Acknowledgments
We thank Rochele Azevedo, Larissa Deadame de Figueiredo Nicolete, Rodrigo Haddad, Adriana Aparecida Marques, and Patricia Viana Bonini Palma for their assistance in laboratory techniques. We also thank Prof. Charles Bangham for training us in Tax expression analysis. The authors are also grateful to the patients. This work was supported by Fundação de Amparo a Pesquisa do Estado de São Paulo (FAPESP), Centro de Terapia Celular/Fundação Hemocentro de Ribeirão Preto (CTC/FUNDHERP), and Conselho Nacional de Desenvolvimento Científico e Tecnológico (CNPq), Brazil.
Author Disclosure Statement
No competing financial interests exist.
References
Supplementary Material
Please find the following supplemental material available below.
For Open Access articles published under a Creative Commons License, all supplemental material carries the same license as the article it is associated with.
For non-Open Access articles published, all supplemental material carries a non-exclusive license, and permission requests for re-use of supplemental material or any part of supplemental material shall be sent directly to the copyright owner as specified in the copyright notice associated with the article.
