
Abstract
In Italy, the HIV-1 epidemic is still mainly sustained by the subtype B genetic form, although other and novel subtypes and circulating recombinant forms (CRFs) have been reported. A total of 215 HIV-1 pol gene sequences were collected between 1992 and 2010. Multiple alignments spanning subtype-specific HIV-1 B pol sequences were analyzed by Bayesian phylogenetic methods. Subtype B represented 90.7% (n=195) of the sequences. Three main clusters were detected. The root of the tree dated to 1987. Most of the observed viral gene flow events occurred from heterosexual to intravenous drug users (IDUs). Phylogenetic and molecular clock analysis showed an early HIV-1 subtype B introduction in the mid-1980s and dissemination within local risk-specific clusters. This is the first study to describe in detail the HIV-1 molecular epidemiology in one of the largest islands in the European basin. The future potential of the Sardinian epidemic as a hub between Southern and Northern Europe has to been considered.
Introduction
T
In Italy, the HIV-1 epidemic is still mainly sustained by the subtype B genetic form, although other and novel subtypes and circulating recombinant forms (CRFs) have been reported. 5,6 In the past years the migration trends from Africa to Western Europe have been changing the face of the AIDS epidemic in terms of subtype distribution/prevalence leading to the introduction and successful spread of non-B subtypes, such as CRF02_AG, recently introduced in Italy from Cameroon. 7
At the end of 2010, in Italy, 62,976 persons were cumulatively diagnosed as affected by AIDS, with an estimated number of new infections in 2009 of 2,588 cases. At the beginning of the epidemic the most common route of transmission for HIV-1 was needle sharing among injecting drug users (IDUs), 8 which accounted for more than 50% of the cases. In more recent years, heterosexual contacts have become the leading cause (79 %) of infection. 9 The incidence of HIV-1 shows a decreasing trend along the north–south axis of the country, from Emilia Romagna in Northern Italy where the incidence is estimated to be 9.3 per 100,000 cases, to Calabria in Southern Italy with an incidence of 1.6 per 100,000 cases. In Italy the incidence of new diagnoses of HIV-1 had spiked in 1987 (about 25 per 100,000 people), then declined until 1997, and leveled at about 6.0 per 100,000 people in 2009. In Sardinia, the second major Italian island in the Tyrrhenian Sea (Central-Eastern Italy), the incidence rates of newly diagnosed HIV-1 infections have remained constant over time and were reported to be 2.7 per 100,000 residents in 2009. 9
The present study employed a phylogenetic Bayesian approach to identify the origin of the HIV-1 epidemic in Sardinia and investigate, for the first time, potential epidemiological networks within the local, well-defined setting of the Italian island. In addition, given the central geographic position of Sardinia in the Mediterranean basin, we sought to investigate the viral flow in populations with different risk factors to evaluate the potential of Sardinia acting as an epidemic hub between Southern and Northern Europe.
Materials and Methods
Patients and data set
A total of 215 HIV-1 pol gene sequences (from position 2661 to 3256) were collected through routine testing between 1992 and 2010, in patients attending the Division of Infectious Disease, Sassari in Sardinia Island (Italy). The sequences were linked to demographic and clinical data through an anonymous numerical code according to the standards of the local ethical committee and information on geographic region, self-reported route of transmission, and date of sampling was retained. Ethical approvals were obtained from the local ethical committee. All study participants signed an informed consent and completed a study questionnaire.
Four different data sets were built. The first contained 215 HIV-1 pol gene sequence isolates from Sardinian patients plus 28 reference sequences downloaded from the HIV Los Alamos database (
HIV-1 genotyping
Viral RNA was extracted from the patients' plasma, reverse transcribed, amplified, and sequenced using The Viroseq HIV-1 Genotyping System (Celera Diagnostics, CA), according to the manufacturer's instructions. Capillary electrophoresis was undertaken on the ABI-Prism- 3130 Genetic Analyzer. To rule out contamination between samples and to collect information on the most similar published gene sequences, each sequence was compared with others amplified at the same time as already described. 10
Phylogenetic analysis
For each data set, sequence alignments were obtained with the Clustal algorithm implemented in Clustal X 10 followed by manual editing with the BioEdit software, to remove gaps and identical sequences. 10 Subtype was determined uploading sequences individually into the REGA HIV-1 automated Subtyping Tool v2.0 11 and confirmed by in-house phylogenetic analysis. Maximum likelihood (ML) phylogenies were estimated with the best-fitting nucleotide substitution model, tested by using a hierarchical likelihood ratio test as described by Swofford and Sullivan 12 using a neighbor-joining tree as the starting tree and the TBR algorithm for branch swapping. Calculations were performed with PAUP* 4.0b10 written by D.L. Swofford (Sinauer Associates, Sunderland, MA).
Time-scaled phylogenies
Multiple alignments spanning subtype-specific HIV-1 B pol sequences were analyzed by Bayesian phylogenetic methods. Bayesian genealogies were inferred with the Beast program, v 1.6.1 as already described, 13 –15 with the GTR+G+I model of nucleotide substitution. A log normal prior to the evolutionary rates was used and rates were estimated taking into account the known sampling time of the sequences. As prior coalescent, different parametric demographic models (a constant population size and exponential and logistic growth) and a nonparametric Bayesian skyline plot (BSP) were compared under strict and relaxed clock conditions, and the best models were selected by means of a Bayes factor (BF, using marginal likelihoods) implemented in Beast. 16 In accordance with Kass and Raftery, 17 the strength of the evidence against H0 was evaluated as follows: 2 ln BF<2, no evidence; 2–6, weak evidence; 6–10, strong evidence; >10, very strong evidence. A negative value indicates evidence in favor of H0. Only values of >6 were considered significant. A tree search was carried out running a Markov chain Monte Carlo (MCMC) sampler for 250 million generations (initial burn in of 10%), sampling every 25,000th generation. Convergence of the MCMC was assessed by calculating the ESS for each parameter. ESS values >250 were considered robust. Maximum clade credibility trees were obtained from the trees posterior distributions with the Tree-Annotator software v 1.6.1, 18 and statistical support for specific monophyletic clades was assessed by calculating the posterior probability. Monophyletic clades with a posterior probability of 1 and including only Sardinian sequences were considered as potential epidemiological clusters. For cluster groups containing ≥4 sequences, dated trees, evolutionary rates, and population growth were estimated with the same Bayesian MCMC approach described above.
Viral gene flow analysis
The MacClade version 4 program (Sinauer Associates, Sunderland, MA) was used to test viral gene out/in flow among HIV-infected subjects with different risk factors using a modified version of the Slatkin and Maddison test. 19 A one-character data matrix was obtained from the original data set by assigning to each taxon (viral sequence) in the tree a one-letter code indicating the risk factor of the patient infected with that specific HIV-1 strain. The putative origin of each ancestral sequence (i.e., internal node) in the tree was inferred by finding the most parsimonious reconstruction (MPR) of the ancestral character. The final tree length, i.e., the number of observed viral gene flow events in the genealogy, can easily be computed and compared to the tree-length distribution of 10,000 trees obtained by random joining-splitting (null distribution). Observed genealogies significantly shorter than random trees indicate the presence of subdivided populations with restricted gene flow. The viral gene flow among different risk factors (character states) was traced with the State changes and stasis tool (MacClade software), which counts the number of changes in a tree for each pairwise character state. When multiple MPRs were present (as in our data sets), the algorithm calculated the average migration count over all possible MPRs for each pair. Gene flow was also calculated for the null distribution to assess whether the gene flow events observed in the actual tree were significantly higher (>95%) or lower (<95%) than the values in the null distribution at the p=0.05 level.
Results
The study included 215 HIV-1-infected patients followed in a single clinical center in Sassari from 1992 to 2010. Six patients (2.8%) were in acute infection [primary HIV infection (PHI) or <6 months after seroconversion], while the others were all chronically infected patients. The majority of the patients (155, 72%) were males, 90% of which were Italians. The median age was 30 years [interquartile range (IQR): 35–40]. The median CD4 cell count was 368 mm3 (IQR: 277–610) and the median viral load was 32,000 copies/mm3 (IQR: 10,200–310,000). The main exposure groups and other epidemiological characteristics were all represented and are summarized in Table 1 for both B and non-B subtypes.
Range.
No treatment.
IDU, intravenous drug use; MSM, men who have sex with men; HAART, highly active antiretroviral therapy.
Rega subtyping analysis and in-house phylogenetic analysis (Supplementary Fig. S1; Supplementary Data are available online at
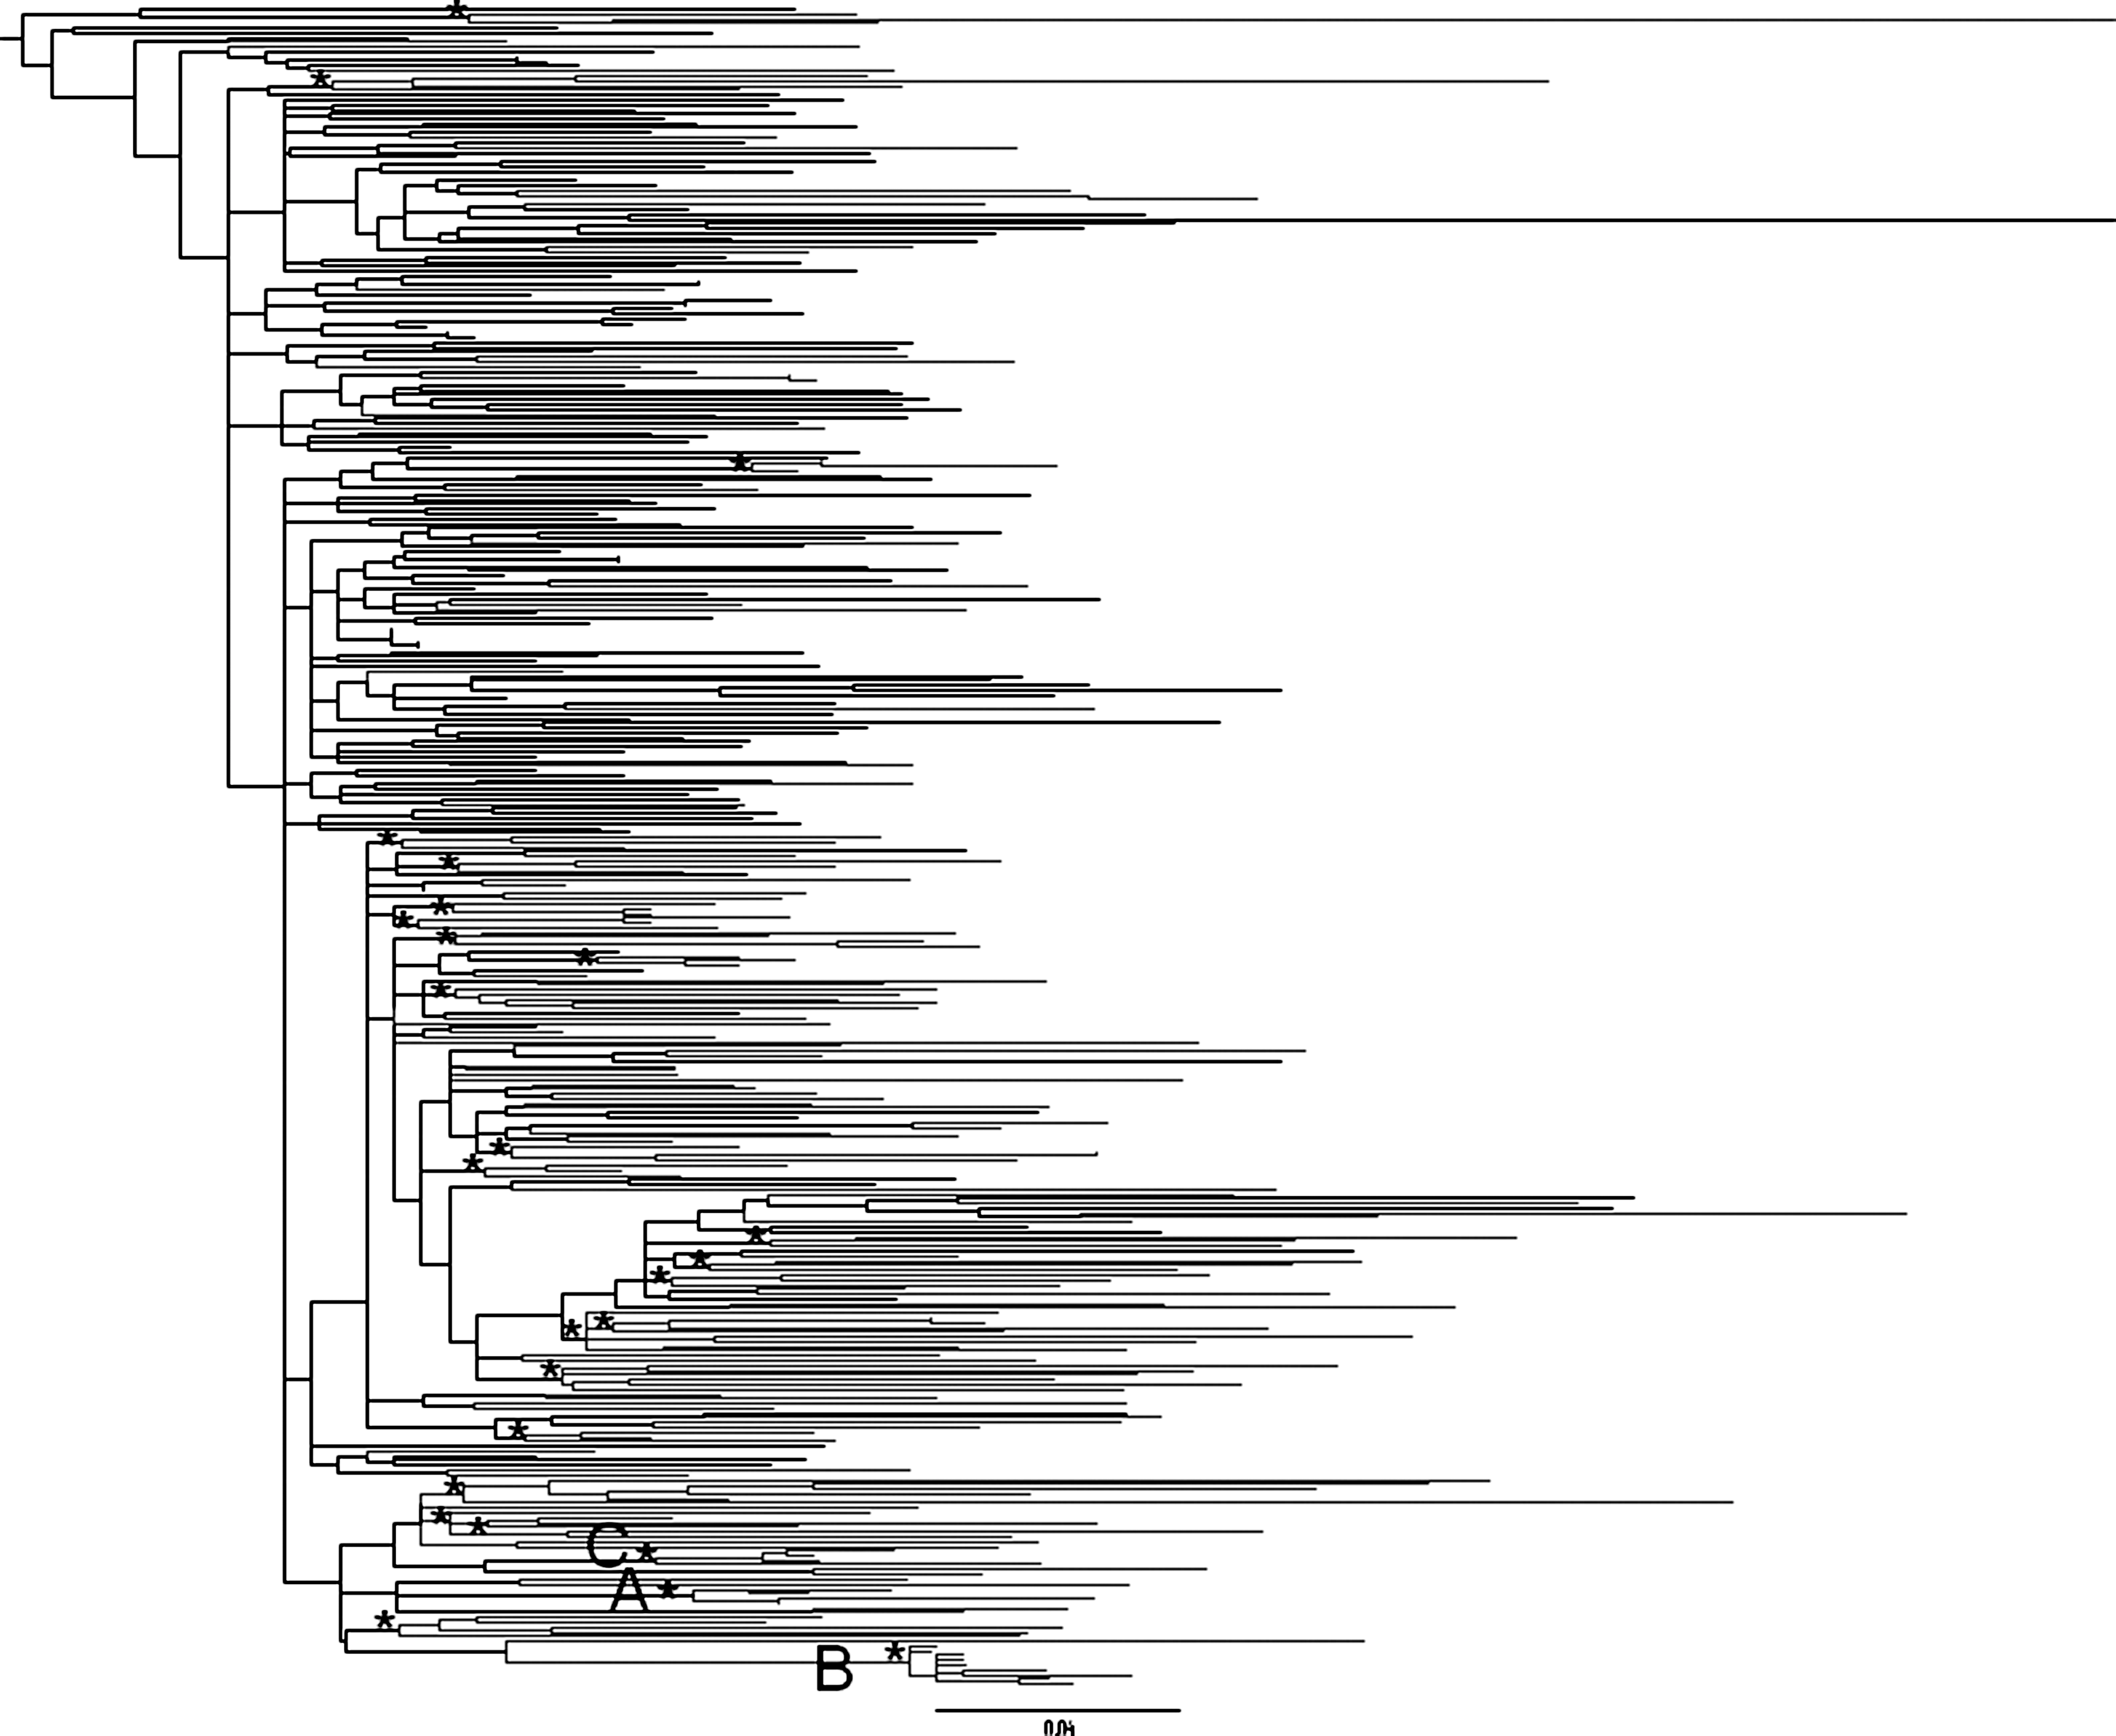
Maximum likelihood phylogenetic analysis including 195 Sardinian and 158 foreign HIV-1 B pol sequences. The branches of the Sardinian sequences are in bold. The tree was rooted by the midpoint rooting. Branch lengths were estimated with the best fitting nucleotide substitution model according to a hierarchical likelihood ratio test, and were drawn to scale with the bar at the bottom indicating 0.04 nucleotide substitutions per site. One asterisk (*) along the branches represents significant statistical support for the Sardinian clusters subtending that branch (p<0.001 in the zero-branch-length test and bootstrap support >70%).

Bayesian phylogenetic tree of 195 HIV-1 B Sardinia pol sequences. One asterisk (*) along the branches represents significant statistical support for the clade subtending that branch (posterior probabilities >97%). Statistically supported clusters ≥4 sequences are indicated with letters A, B, and C. Years are reported on the scale axis below.
Interestingly, two of the six sequences from acutely infected subjects clustered with naive chronically infected patients, while one acute infection clustered with both naive and treated chronically infected patients. For all clusters, a Bayesian skyline plot (BSP) model of population growth was significantly favored over a constant, exponential, and logistic population size model (data not shown).
Molecular clock analysis estimated the time of most recent common ancestor (TMRCA) for cluster A in 2004 (95% HPD 1999–2007). The clade included four naive individuals, one with a heterosexual risk group and three homosexual; two were chronic infections and two were acute. Cluster B TMRCA was 2005 (95% HPD 2002–2008). The cluster included nine individuals (seven naive, one treated chronically infected, and one naive acutely infected patient), eight of which were homosexual and one heterosexual. Cluster C TMRCA was 2000 (95% HPD 1993–2006). The root of the tree dated to 1987 (95% HPD 1972–1999). The clade included four homosexual chronically infected patients, two of whom were naive and two treated (Fig. 3). It is important to note that this is not the TMRCA of subtype B, which more likely has been dated to the early 1960s, but it should rather be considered as the most recent common ancestor that gave rise to the Sardinian subclusters.
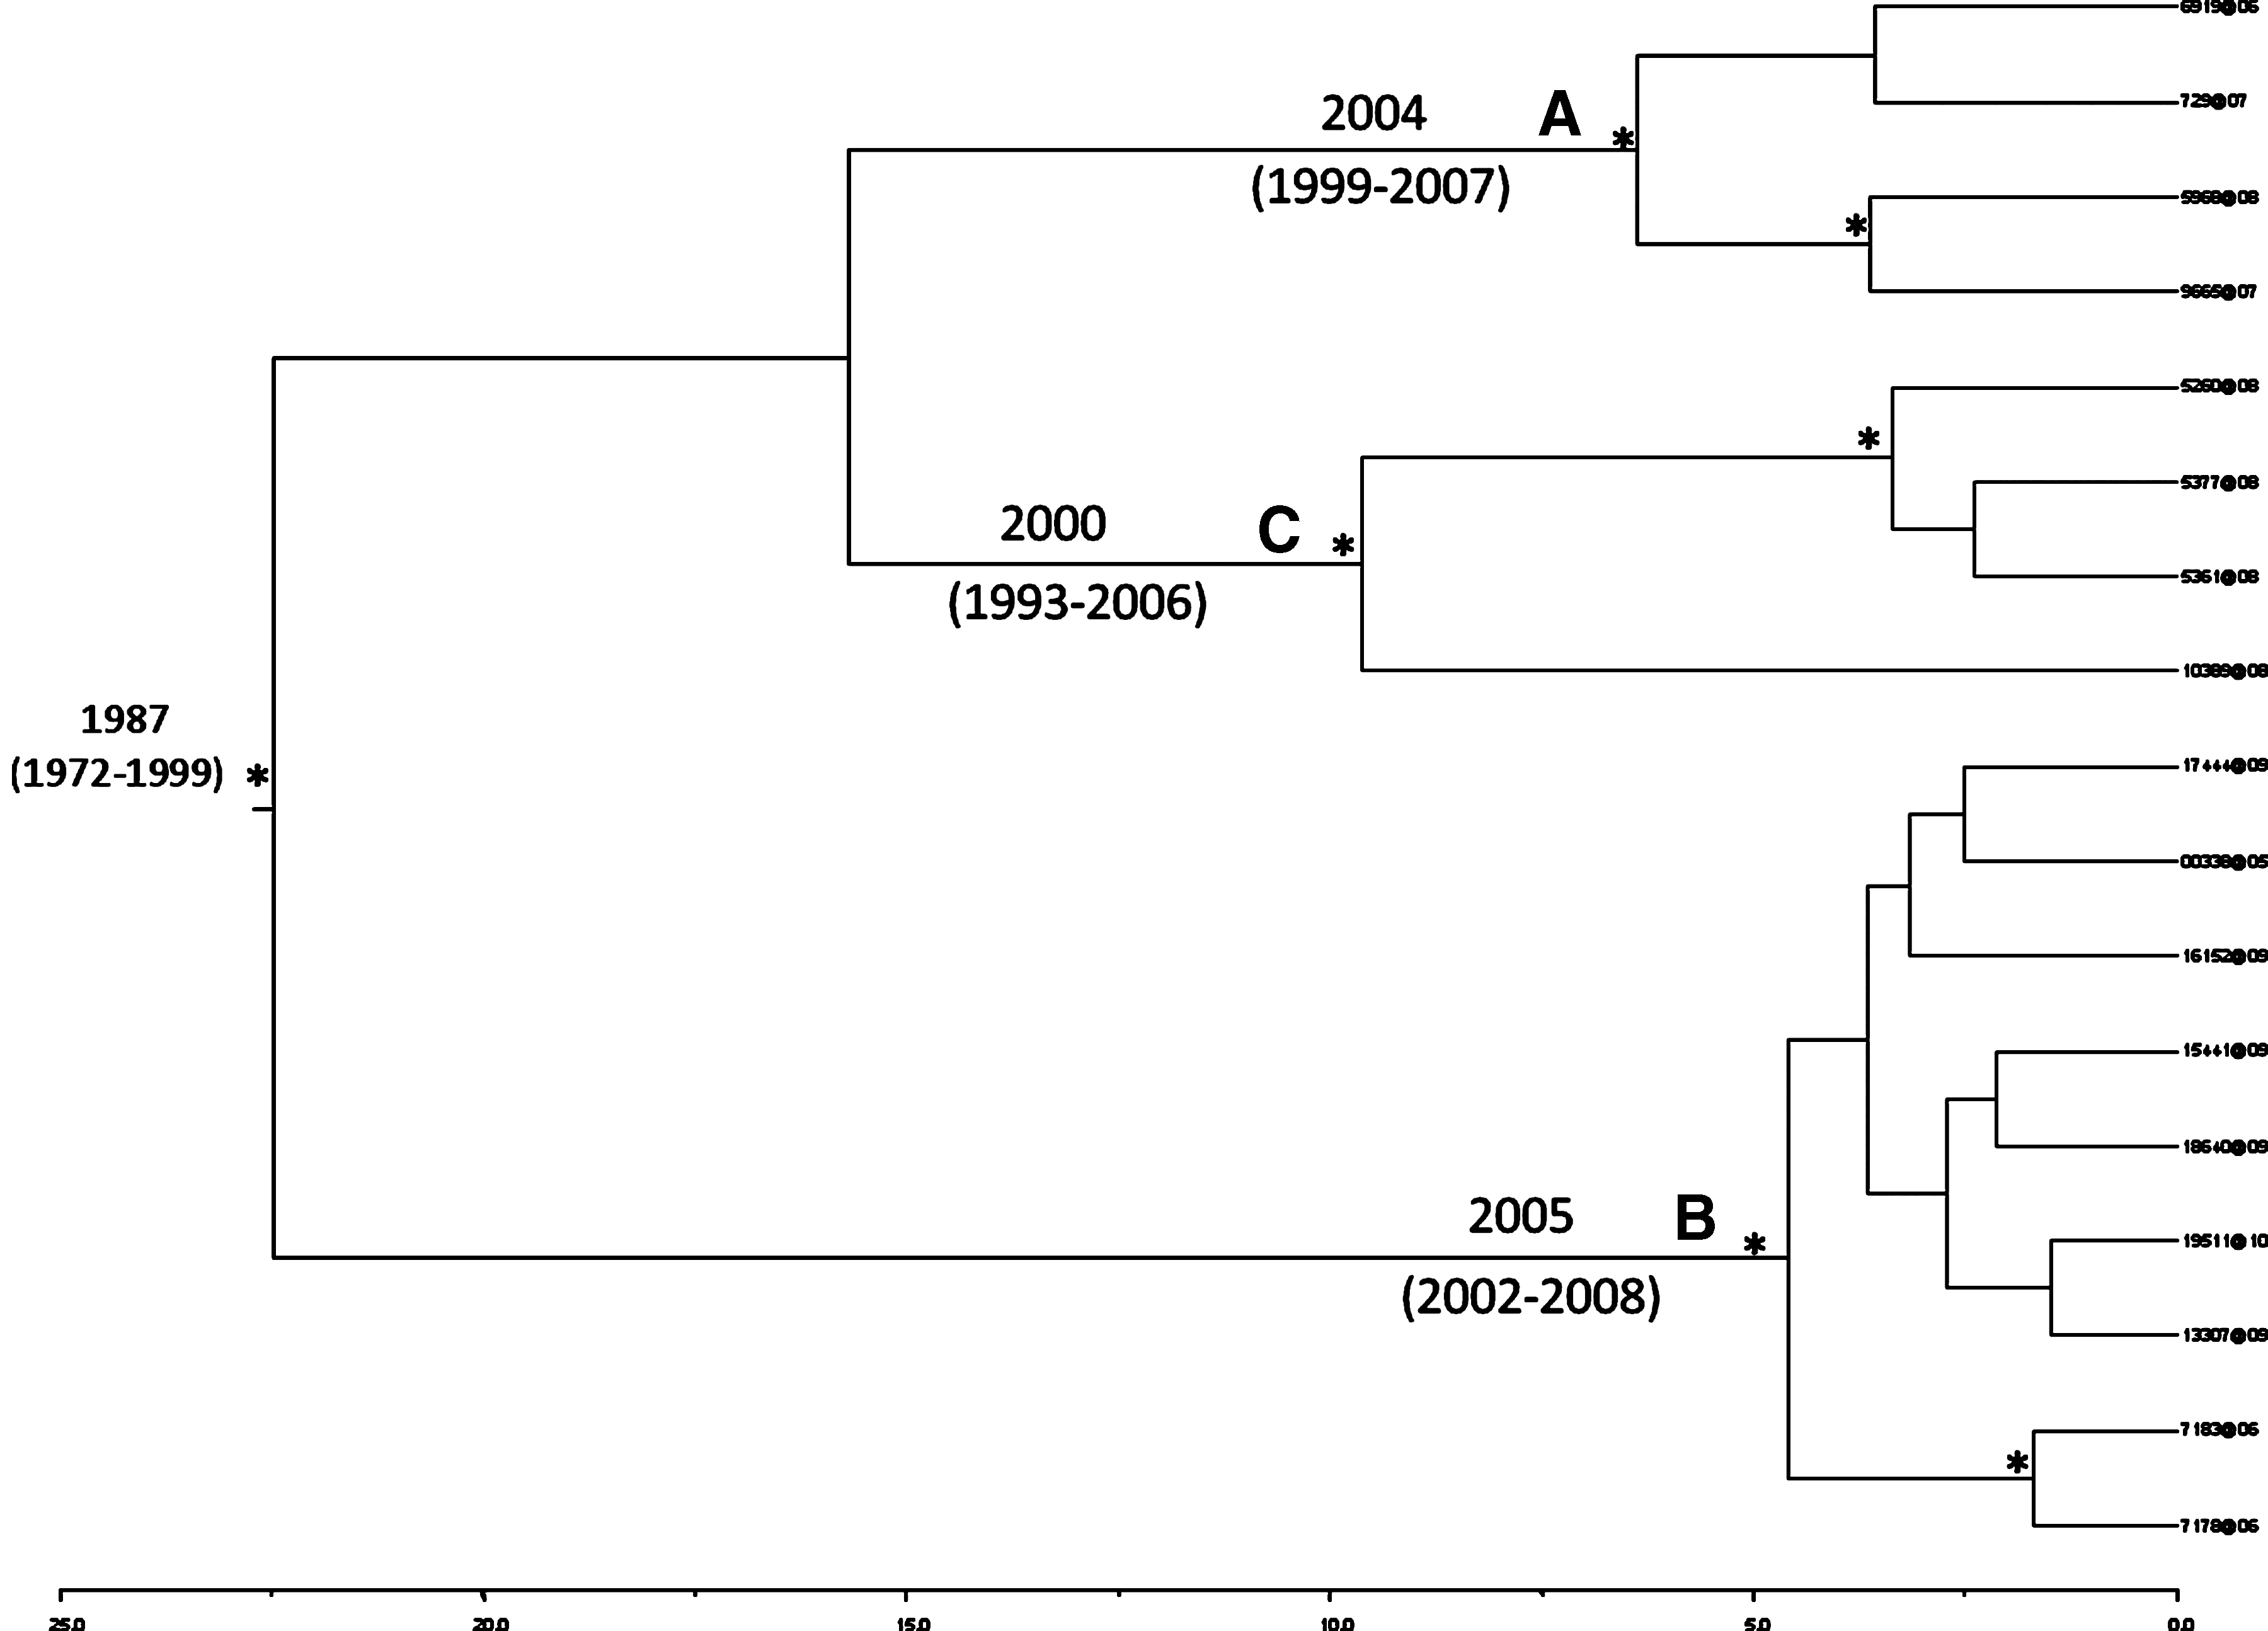
Bayesian phylogenetic tree of HIV-1 B Sardinia clusters with ≥4 sequences. One asterisk (*) along the branches represents significant statistical support for the clade subtending that branch (posterior probabilities >97%). Clusters are indicated with letters A, B, and C. Years are reported on the scale axis below.
HIV-1B Sardinian sequences were assigned to three risk groups—men who have sex with men (MSM), heterosexuals, and injecting drug users (IDUs)—and gene flow among the groups was estimated (Fig. 4). The null hypothesis of panmixia (i.e., no population subdivision or complete intermixing of sequences from different geographic areas) was rejected by the randomization test (p<0.0001), suggesting the presence in the island of risk-group-specific subepidemics. Most of the observed viral gene flow events (32%) occurred from heterosexual to IDUs (32%), but the observed events were not significantly different from the ones expected under a null distribution (p<0.05). On the other hand, gene flow significantly higher than expected by chance (p<0.05) was observed from IDUs to homosexuals (25.4%, p<0.05), as well as in the opposite direction (16.9%) from homosexuals to IDUs, suggesting the central role of these two risk groups as a potential drive of the HIV-1 Sardinian epidemic.
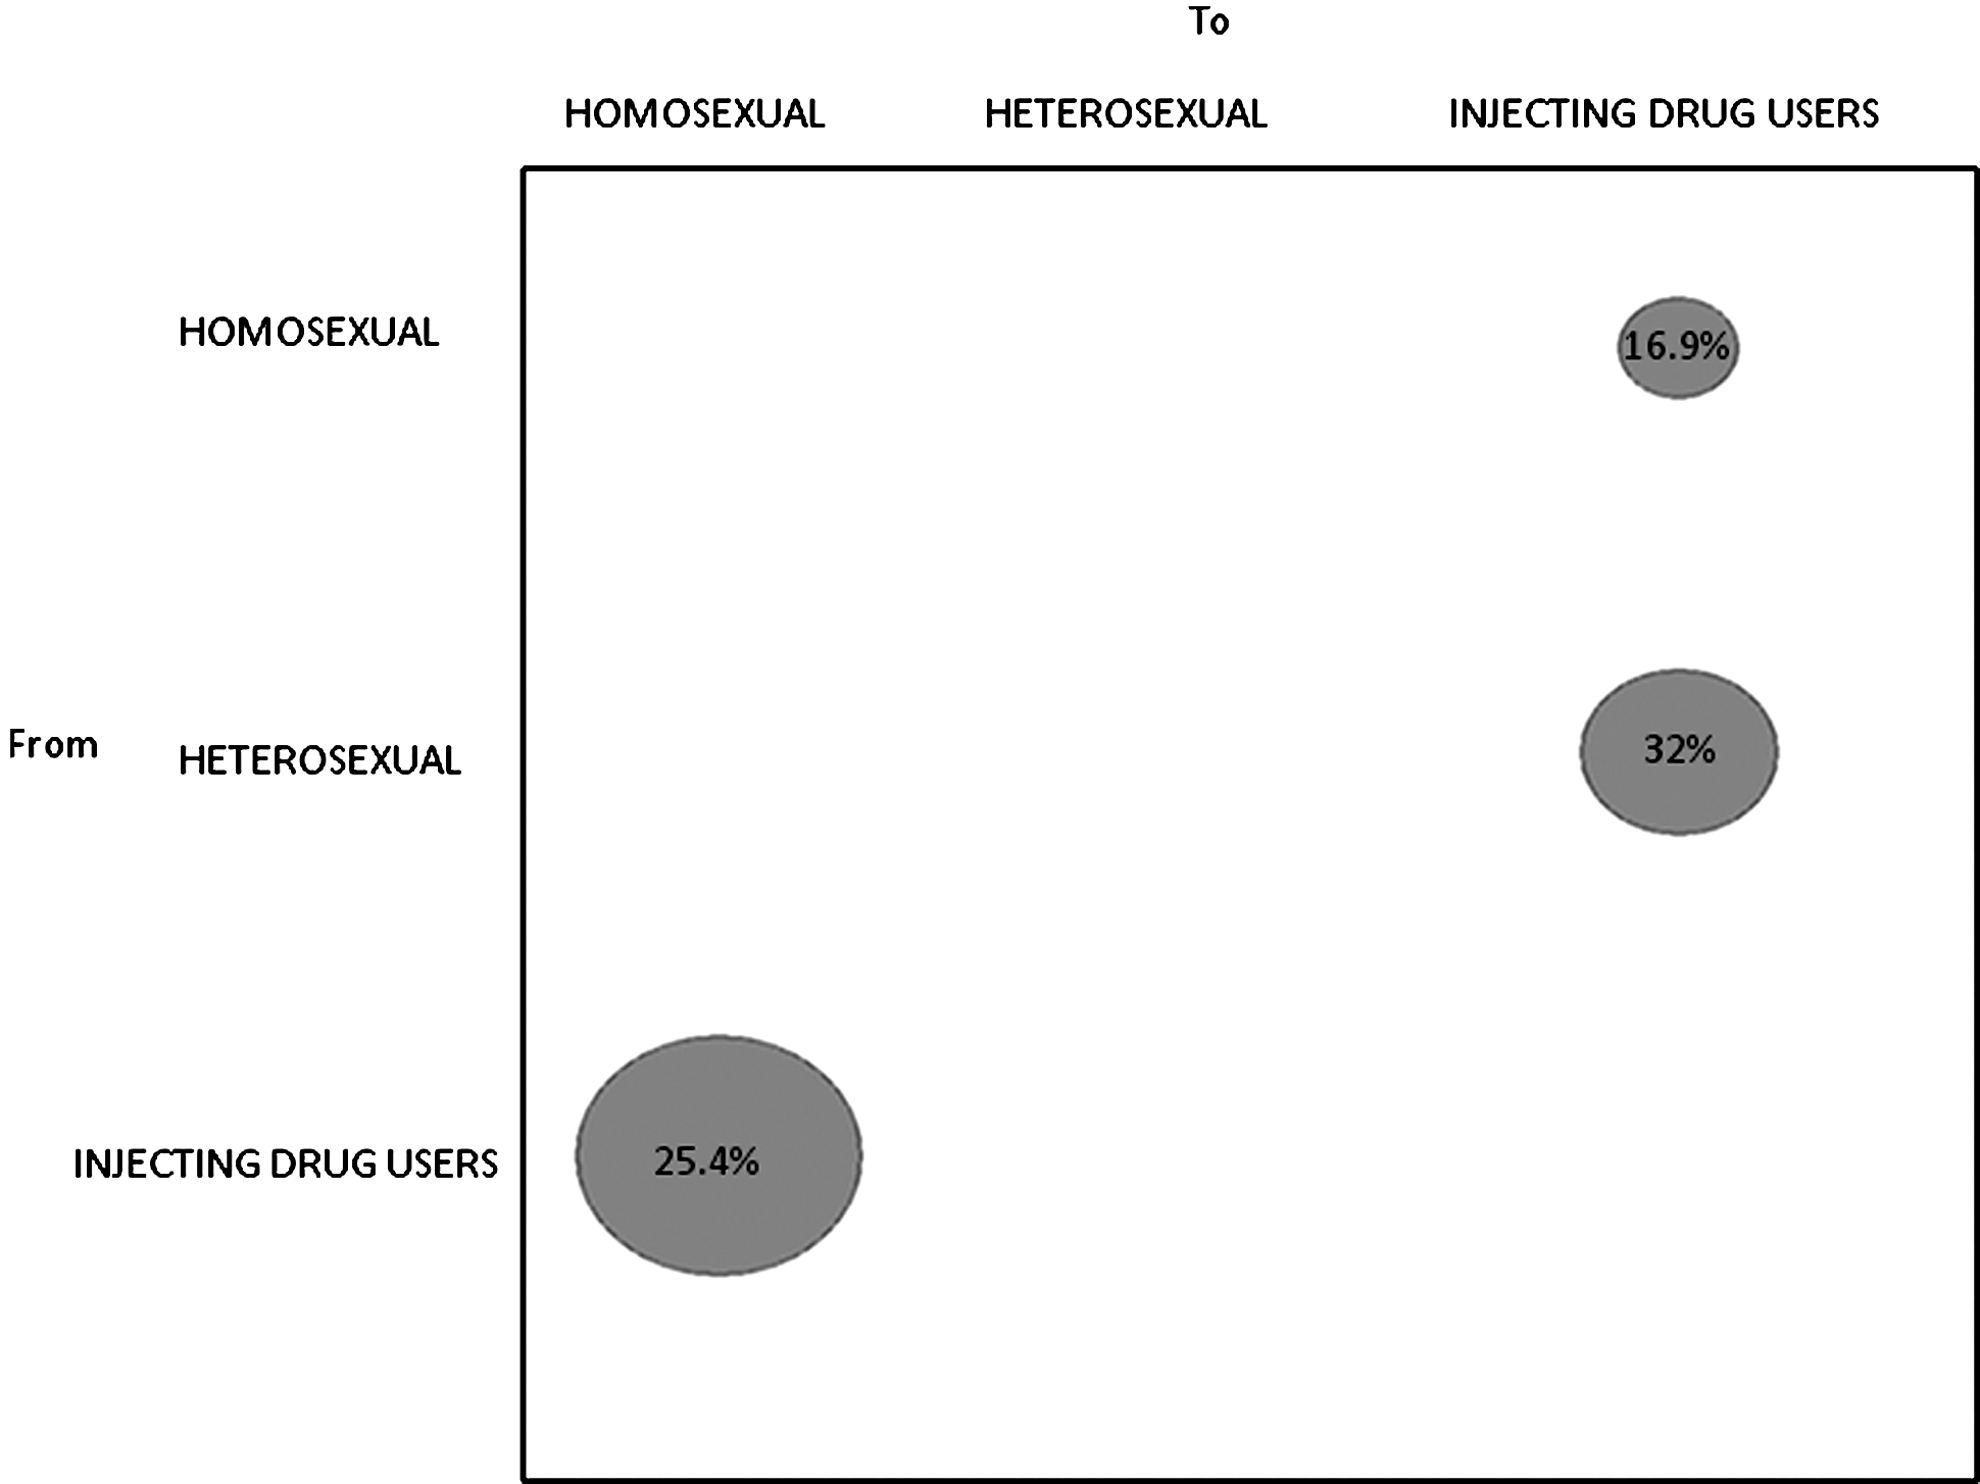
Maximum parsimony migration patterns of HIV-1 B Italian (Sardinian) sequences to/from different risk groups. The bubblegram shows the frequency of gene flow (migrations) to/from different risk groups, as the percentage of the total observed migrations estimated from the maximum likelihood trees for different subtypes with a modified version of the Slatkin and Maddison test. The surface of each circle is proportional to the percentage of observed migrations given within the circle.
Discussion
The data presented herein showed that the HIV-1 epidemic in Sardinia, one of the largest Italian islands, is mainly due to B subtype infections (>90%), and strongly suggested an early introduction (around the mid-1980s) of the virus followed by a dissemination fostered by local risk groups of MSM and IDUs. Subtype B is the most common subtype circulating in Western countries and phylogenetic analysis has shown that HIV-1B sequences from Europe and the United States usually intermix in typical star-like genealogies representing both the exponential growth of the epidemic and the high degree of intermix/lack of geographic structure within this subtype. On the other hand, HIV-1B Sardinian isolates represent clearly distinguishable clusters within the B subtype. The finding suggests the successful compartmentalization of HIV-1 within the island, which is also supported by the relatively low prevalence of non-B subtypes in Sardinia (a countertrend compared to the rest of Europe, where incidence has consistently been increasing), as well as the steady incidence and prevalence of the virus on the island during the past 20 years.
Since Darwin's observations on the Galapagos, islands have long been recognized as “laboratories” for the study of evolution. The size, isolation, and boundaries of islands combine to create selective pressures that are quite distinct from those that act on the mainland. Also, these species (humans or microorganisms) often evolve from very small populations that are subject to genetic bottlenecks, which spur change. From 2008 in Sardinia a negative migration rate occurred (
In conclusion, this is the first study to describe in detail HIV-1 molecular epidemiology in one of the largest islands in the European basin. HIV-1B predominates, although sporadic non-B strains were identified. Phylogenetic and molecular clock analysis showed well-supported Sardinian clusters compatible with an early HIV-1 subtype B introduction in the mid-1980s, followed by dissemination within local risk-specific clusters. These observations deserve further investigation not only to understand the ecological factors driving the successful compartmentalization of the virus in Sardinia, but also to evaluate, given the central position of the island in the Mediterranean sea, the future potential of the Sardinian epidemic as a hub between Southern and Northern Europe.
Footnotes
Author Disclosure Statement
No competing financial interests exist.
References
Supplementary Material
Please find the following supplemental material available below.
For Open Access articles published under a Creative Commons License, all supplemental material carries the same license as the article it is associated with.
For non-Open Access articles published, all supplemental material carries a non-exclusive license, and permission requests for re-use of supplemental material or any part of supplemental material shall be sent directly to the copyright owner as specified in the copyright notice associated with the article.