
Abstract
As the AIDS pandemic progresses, an increasingly broad range of genetic diversity continues to be reported within the main (M) group of HIV-1 viruses with viral subtype predominating in specific geographic areas. To determine the genetic diversity of HIV-1 subtypes among Kenyan individuals, the env–C2-V3 gene was successfully sequenced in samples from 176 patients. Analysis of the sequences showed that a majority of them belonged to subtype A1: 73.9% (130/176), followed by C: 10.8% (19/176), D: 10.2% (18/176), and 0.6% (1/176) for G and A2 as pure subtypes while the rest were recombinants of A1/U: 2.3% (4/176) and 0.6% (1/176) each for D/U, A/C/U, and AC. Similar to previous studies conducted in other parts of Kenya, HIV-1 subtype A1 still remains the most predominant subtype while subtype C continues to show an increasing prevalence. Continued surveillance of circulating subtypes of HIV-1 in Kenya is important in determining the evolution of the HIV/AIDS epidemic in Kenya.
A
HIV-1 genetic variants are unevenly disseminated in different geographic locations. 4 It has been found that from the beginning of the epidemic, distribution of different genetic variants has been changing due to population movements and the emergence of new recombinant forms. 4,5 On a global scale, the M group HIV-1 representatives are predominant, with the most common subtypes being C, A, B, and G and recombinants CRF02_AG and CRF01_AE in that order. 2 Subtype C accounts for almost 50% of all HIV-1 infections worldwide. 2,5 There is considerable geographic influence on circulating subtypes with some countries having a very high proportion of infections of a single subtype. 6 For example, the predominant subtype in North America and Europe is B while it is C in sub-Saharan Africa. 6,7 However, multiple subtypes coexist in populations and this can lead to the generation of intersubtype recombinant forms. 6
It has been postulated that HIV-1 subtypes A and D were introduced into East Africa after the 1950s and spread exponentially during the 1970s, with the rapid spread, in part, being due to the strong interconnectivity between major population centers in the area. 7 Studies in Kenya, mainly based in Nairobi, have confirmed the predominance of subtype A, with subtype D being much less common, with occasional other subtypes and recombinants being detected. 8,9 Kenya is one of the many countries of the sub-Saharan Africa region in which the HIV pandemic has had an overwhelming effect on the population. 10 –12 HIV-1 subtype surveillance has shown that the majority of these infections belong to HIV-1 subtype A1 with subtypes A2, D, C, and G being described. 10 –12 This shows that there is an increasing prevalence of other subtypes and recombinants due to the nature of the virus and continued interactions of infected people from different regions of the world. 12
Nairobi is one of the largest Kenyan cosmopolitan cities serving a population of about 3 million people. However, not much work has been done on the surveillance of HIV subtypes in the general population of Nairobi and its environs. Though few studies have been carried out, they may have had limited sample sizes, been done long ago, or targeted specific high-risk groups. 13
The subjects who were enrolled this study were individuals who resided in Nairobi and it surrounding environs. The main comprehensive HIV-1 clinics selected for the study because they serve Nairobi and its environs were the Kenyatta National Hospital, the Kasarani, Kangemi, Ngong, and Kitengela Clinics, and the Kamiti Maximum Prison clinic, which serves inmates from the Kamiti Maximum Prison. The target population consisted of patients, the general population, and prison inmates from the Kamiti Maximum Prison. It has been shown that most of subtype epidemiological studies carried out in Kenya have been done in urban areas 12 with none among inmates. The purpose of this study was to carry out a rapid analysis of samples collected from patients visiting HIV-1 comprehensive clinics in Nairobi and its surrounding environs. HIV-1 env–C2-V3 primer-based amplification and direct sequencing were conducted to determine the genetic diversity of HIV-1 strains circulating in the general population including prison inmates. All samples were collected during the period between 2009 and 2010 after obtaining approval from the KEMRI/National Ethical Review Committee, SCC No. 1394.
In this cross-sectional study, 5 ml of whole blood was collected in EDTA vacutainer tubes from consenting participants who were 18 years or older. Collected samples were tested for HIV-1 antibodies using a rapid detection kit (Determine HIV1/2; Abbott, Japan) and Bioline HIV1/2; Republic of Korea). Peripheral blood mononuclear cells were extracted from whole blood by density gradient centrifugation using Ficoll-Paque Plus (Pharmacia) and Proviral DNA was extracted using DNAzol (Gibco BRL) and ethanol precipitation as previously described. 13,14
A part of the HIV-1 group M env gene covering 450 bp (C2-V3 corresponding to 6975–7520 nt in HIV-1HXB2) was amplified by nested polymerase chain reaction (PCR) using primers M5 (5′-CCAATTCCCATACATTATTGTGCCCCAG CTGG-3′) and M10 (5′-CCAATTGTCCCTCATATCTCCTCC TCCAGG-3′) in the first round and M3 (5′-GTCAGCACAG TACAATGCACACATGG-3′) and M8 (5′-CCTTGGATGGG AGGGGCATACATTGC- 3′) in the second round. The cycling conditions for this PCR were similar, i.e., a hot start at 95°C followed by 35 cycles of denaturation at 95°C for 30 s, annealing at 55°C for 30 s, and extension at 72°C for 1 min, and a final extension of 72°C for 10 min. 11 PCR amplification was confirmed by visualization with ethidium bromide staining of agarose gels. 14 The amplified products were further labeled using Big Dye with a set of nested primers and directly sequenced using the ABI 310 genetic analyzer (Applied Biosystems, Foster City, CA). Generated sequences excluding those that were hypermutated were aligned using CLUSTAW W version 1.81 with subsequent inspection and manual modification. 14,15 The frequency of nucleotide substitution in each base of the sequences was estimated by the Kimura two-parameter method. 14 Phylogenetic trees were constructed by the neighbor-joining method and alignments were gap stripped for the generation of trees. Resulting trees were visualized using Treeview. 14
From the 176 samples that were successfully amplified and sequenced, analysis of the sequences showed that the majority belonged to subtype A1: 73.9% (130/176), followed by C: 10.8% (19/176), D: 10.2% (18/176), and 0.6% for G and A2 (1/176) as pure subtypes, while the rest were recombinants of A1/U: 2.3% (4/176) and 0.6% (1/176) each for D/U, A/C/U, and AC. Figure 1 shows a representative phylogenetic tree of all the 176 samples that were analyzed together with reference sequences from the Los Alamos HIV database. However, HIV subtyping tools, genotype (

A phylogenetic tree of the HIV-1 env C2V3 gene in relation to reference sequences from the Los Alamos HIV database (boldface).
Previous studies have shown that HIV-1 subtype A1 is the most dominant virus in circulation in Kenya. 12,15 This study showed that HIV-1 subtype A1 was the dominant subtype in circulation, involving 73.9% of the entire sample analyzed (Fig. 1). Consistent with findings in other parts of Kenya, HIV-1 subtype A1 is the most dominant virus in circulation. 12 Among the sampled prison inmates, these findings remained the same, implying possibly that they might have been infected before going into prison. We can confirm that the HIV/AIDS epidemic in Kenya is driven mainly by HIV subtype A1. The HIV-1 subtype A1 sequences clustered with reference sequences mainly from East African countries showing that the viruses were probably of East Africa origin (Fig. 2).

Sampled HIV-1 subtype A phylogenetic tree of the HIV-1 env C2V3 gene in relation to reference sequences from the Los Alamos HIV database (boldface).
The samples that were HIV-1 subtype C clustered with reference sequences from Botswana, Ethiopia, Britain, Kenya, and Sweden 3,9,15 (Fig. 3). The HIV-1 subtype D sequences were clustered with reference sequences from Uganda and Kenya, while subtype G clustered with those from Kenya (Fig. 4). Phylogenetic analysis of these sequences showed three clusters that were related to previously described samples from Kenya, particularly those of the A1 subtype (Fig. 1). We acknowledge that our sample size was not representative of the entire Kenyan population, but the trends of the HIV subtype continue to diversify. However, the remarkable HIV-1 genetic diversity in this urban setting and possible intraprison transmission links described in this study do raise important public health concerns. Moreover, our data highlight the need for routine surveillance of HIV-1 infections. Considering the high disease burden and risk behaviors among populations including correctional facilities, it is important to monitor the trends of HIV subtypes. There are also great benefits when specific programs aimed at STD, especially HIV prevention, counseling, screening, and treatment, are achieved.
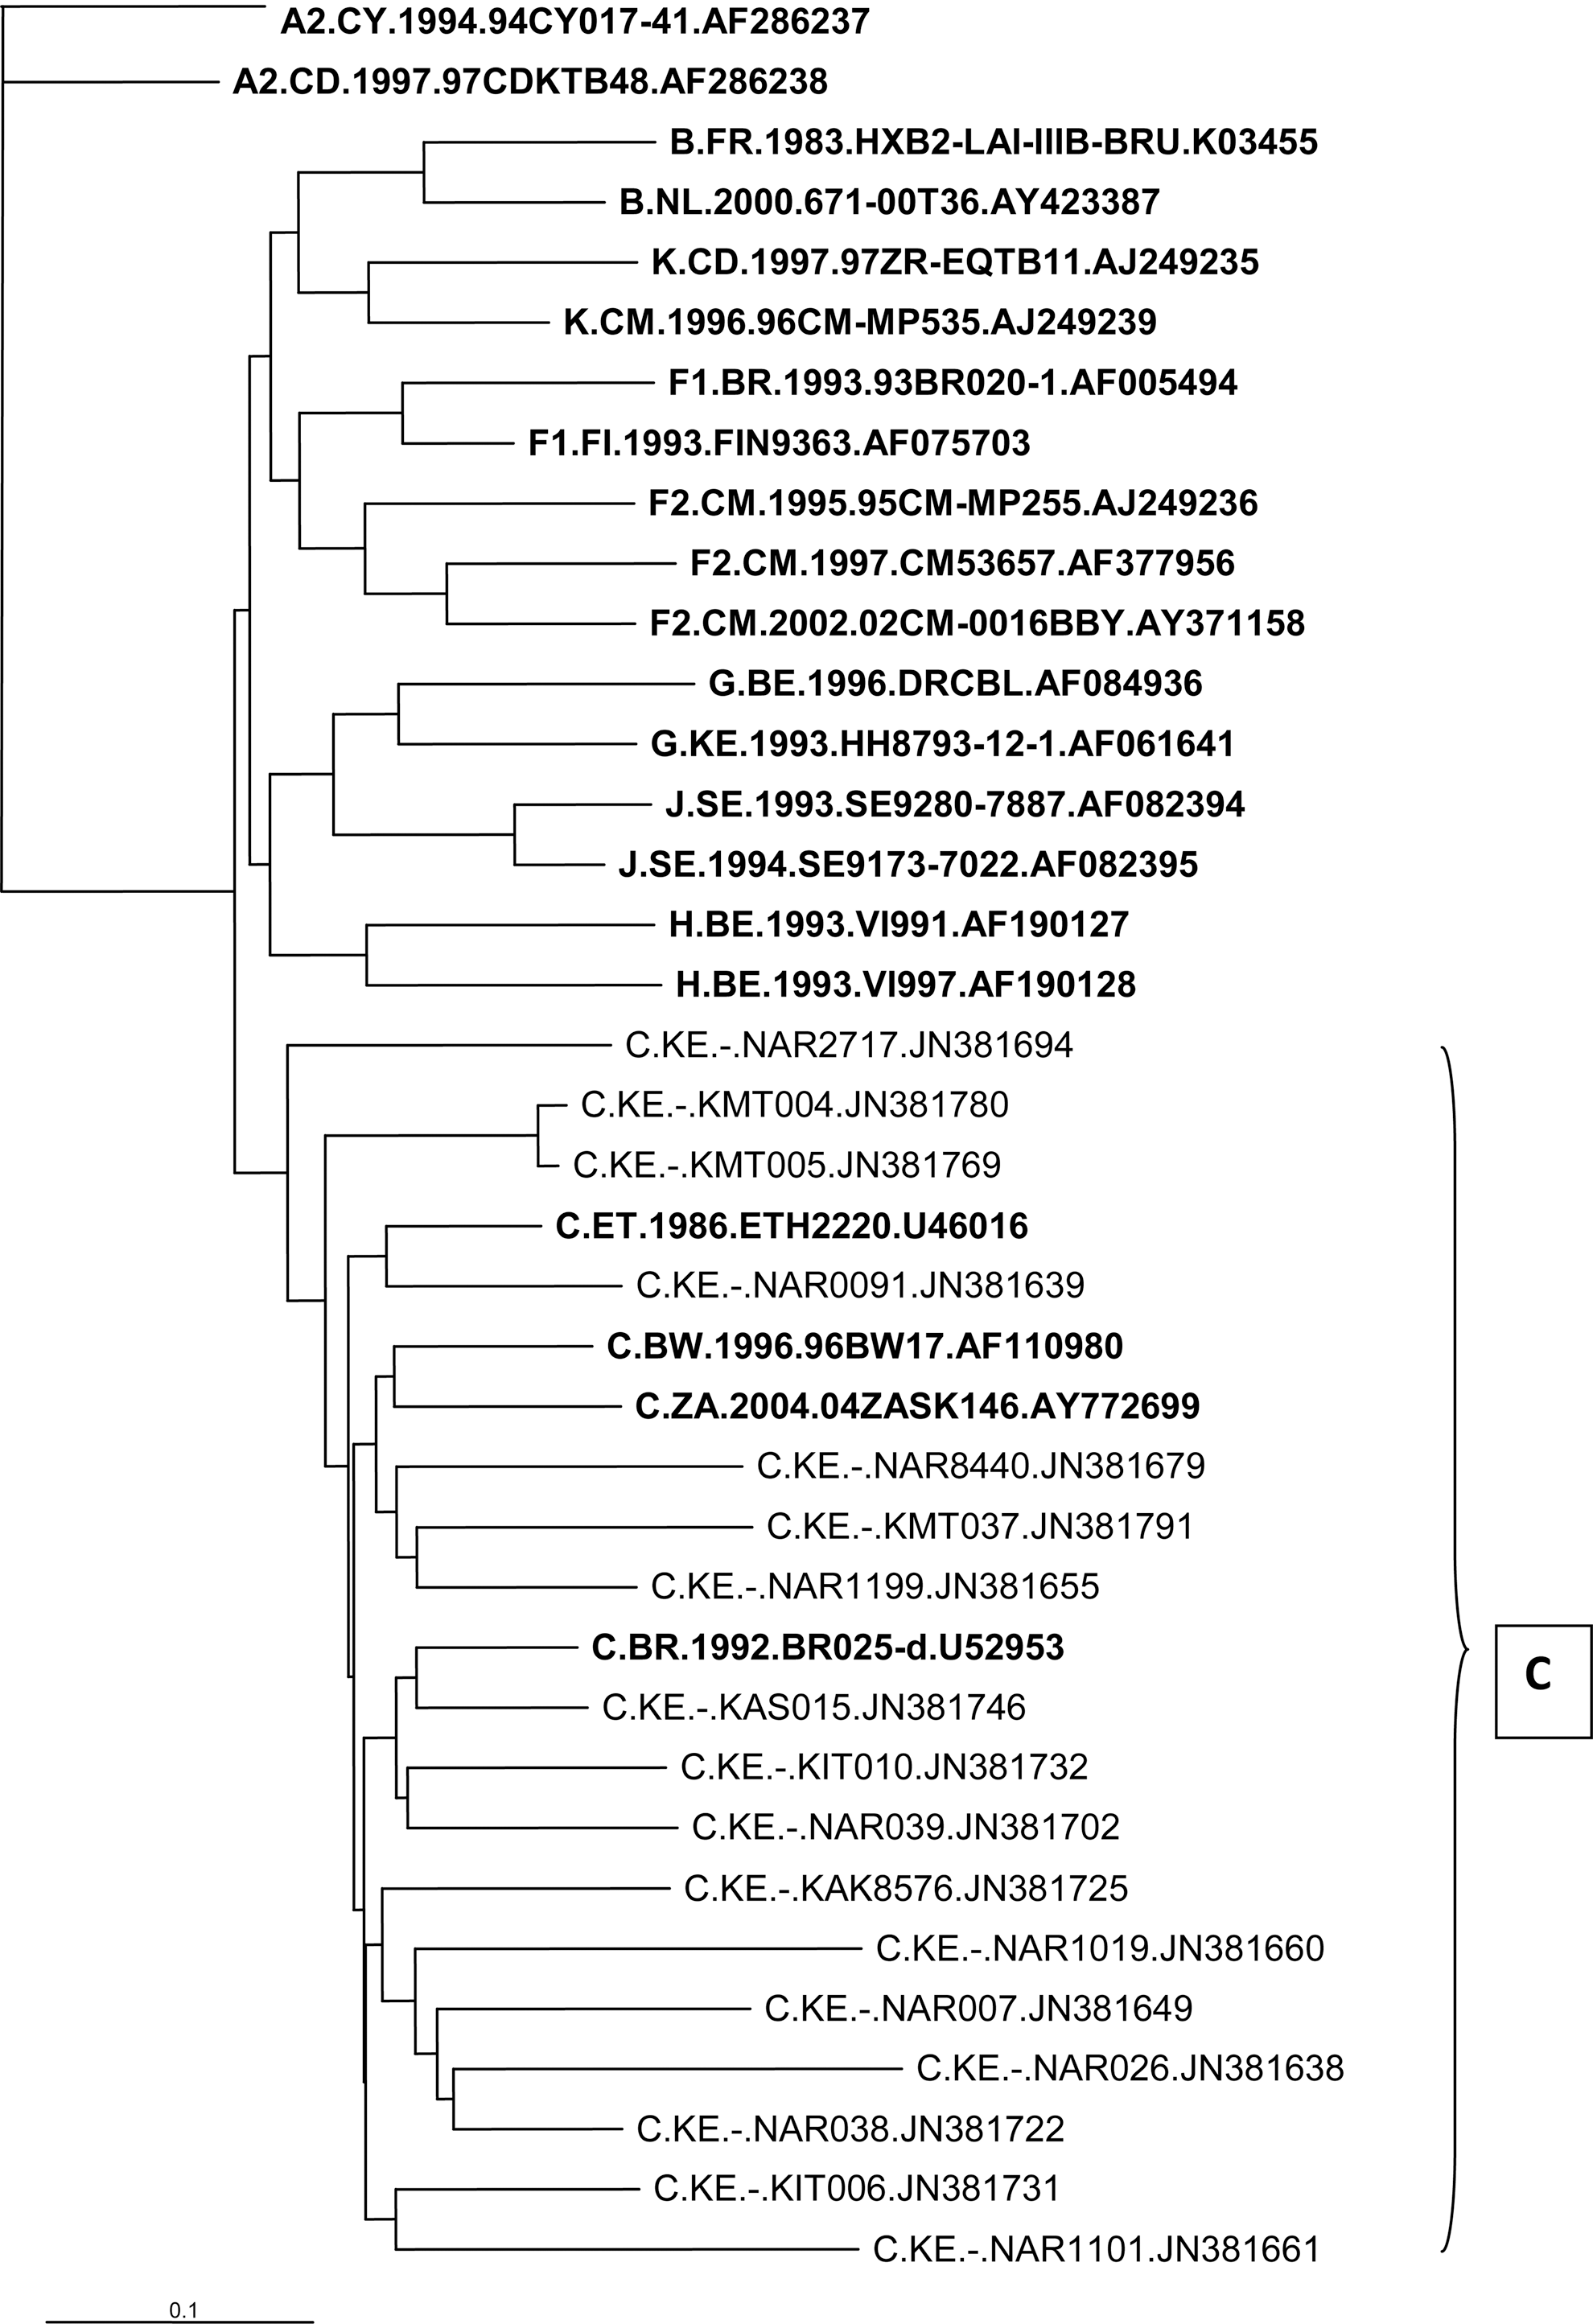
Sampled HIV-1 subtype C phylogenetic tree of the HIV-1 env C2V3 gene in relation to reference sequences from the Los Alamos HIV database (boldface).
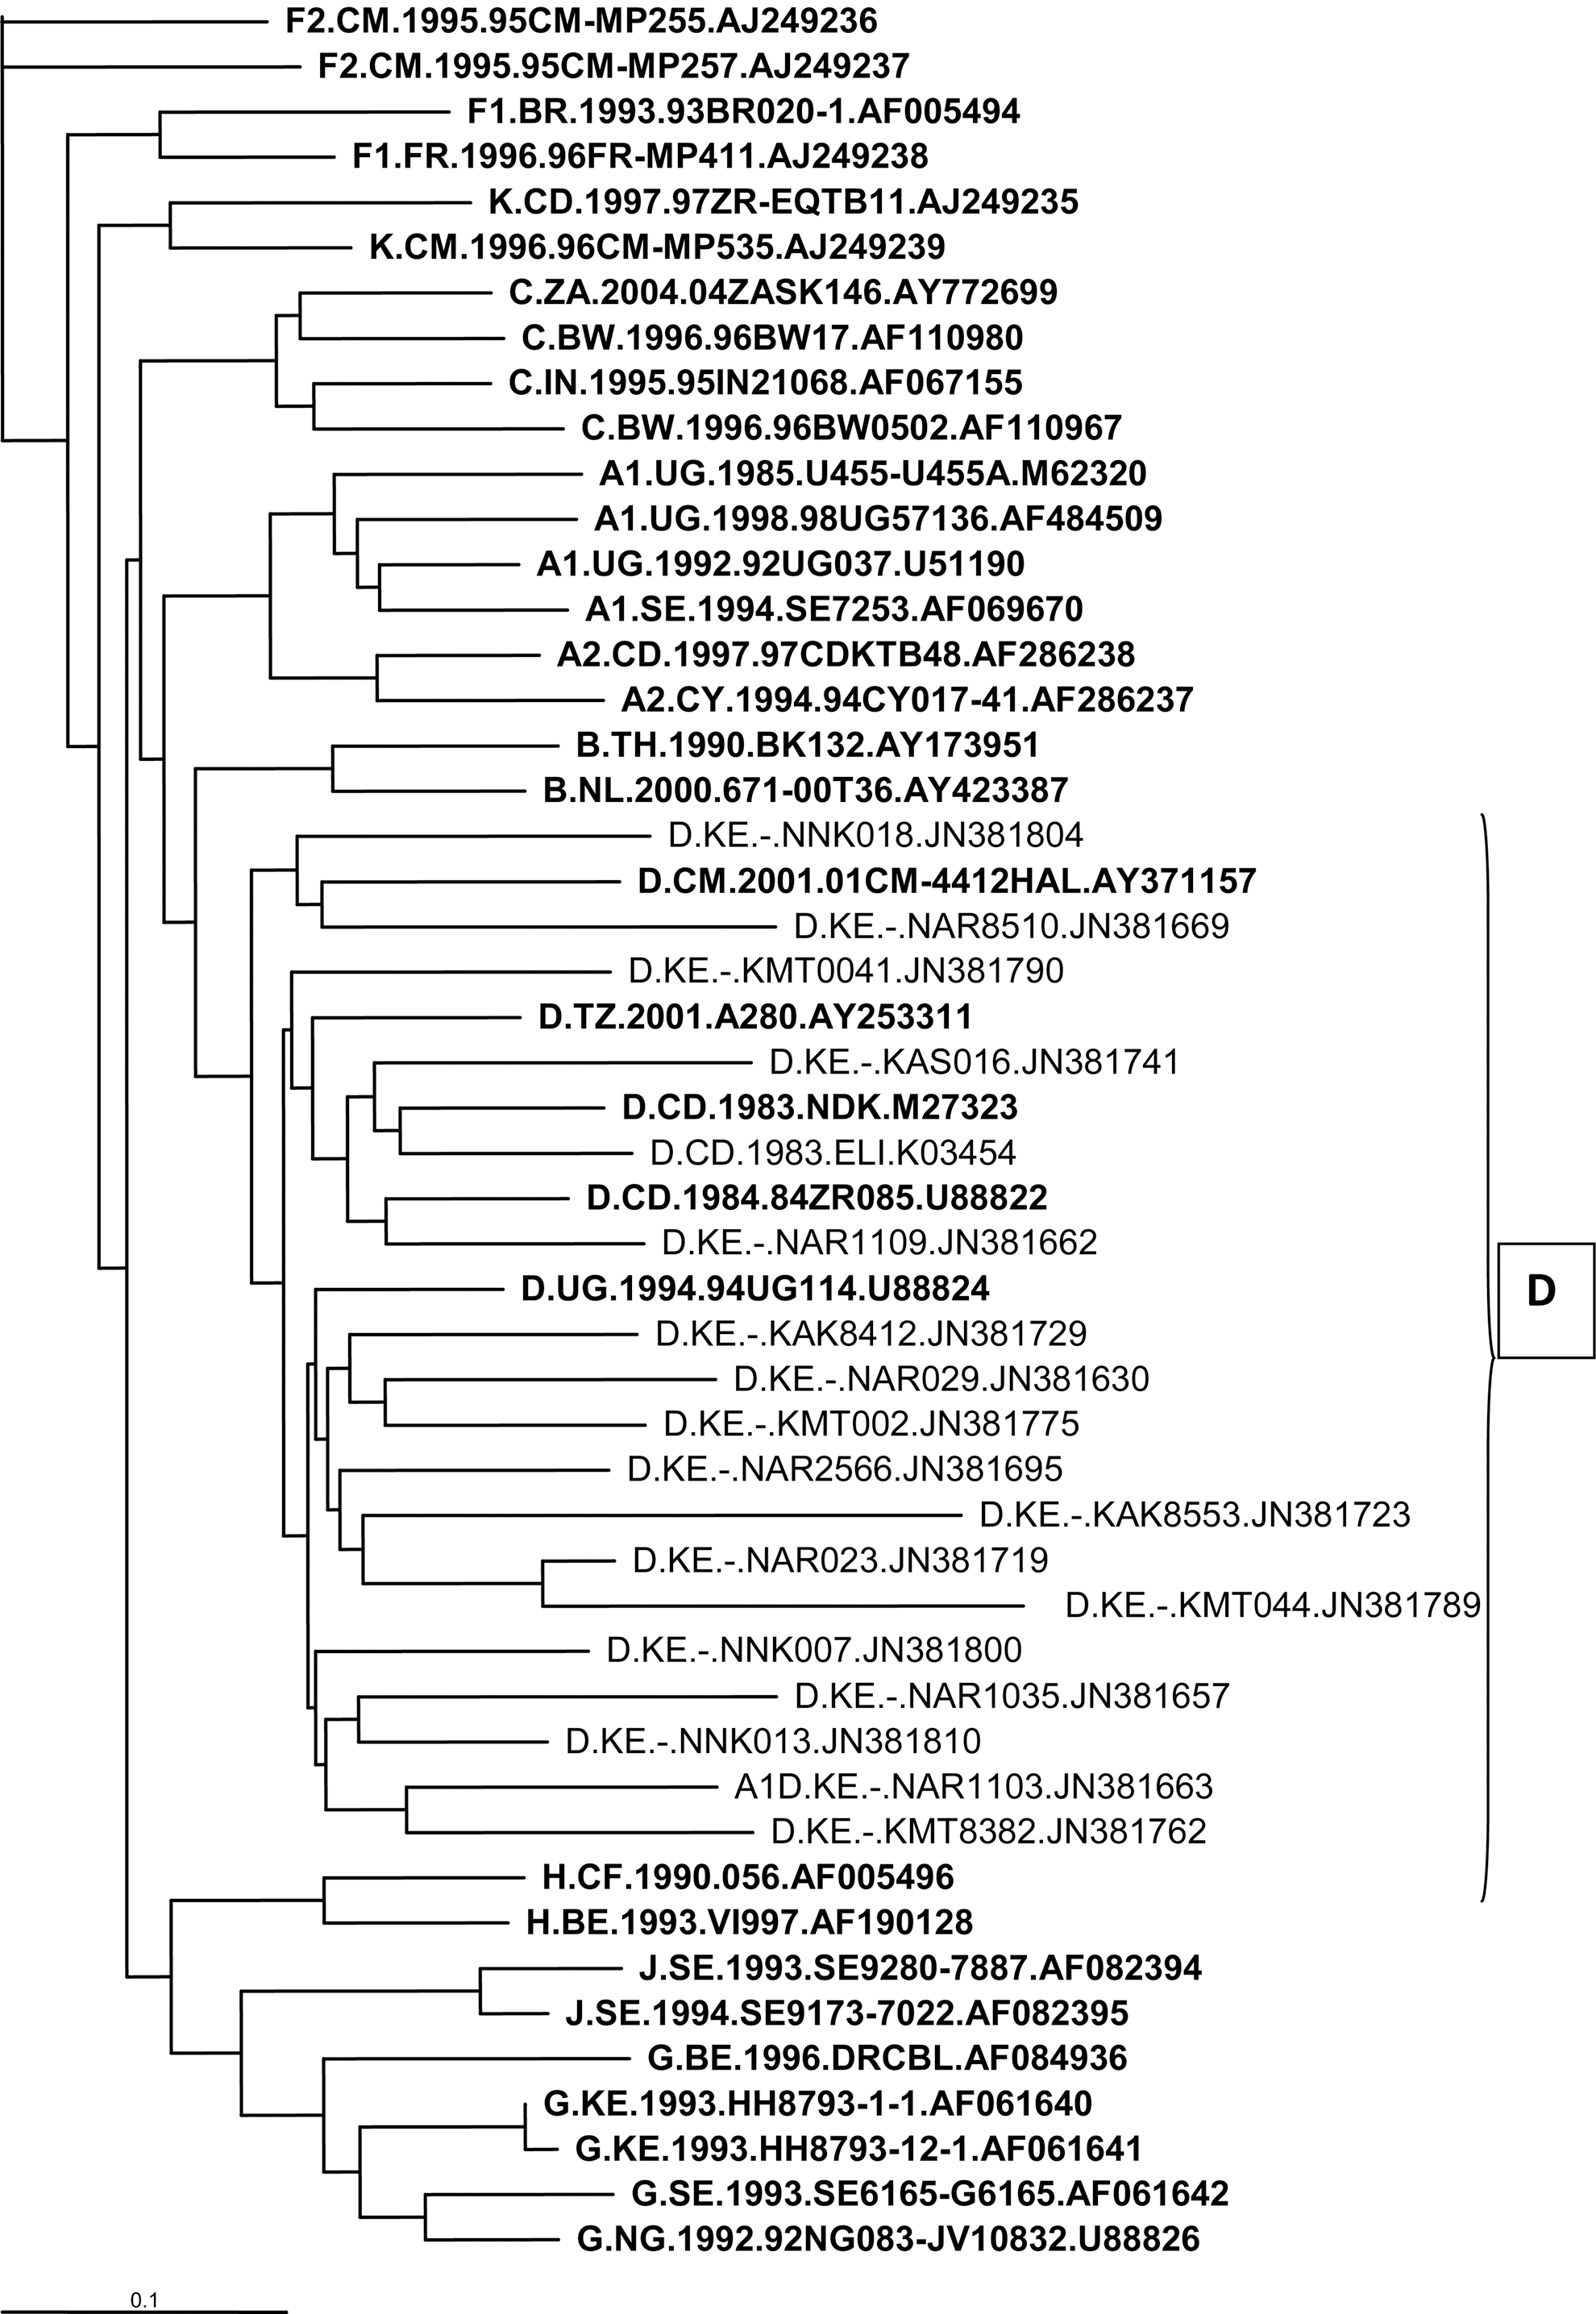
Sampled HIV-1 subtype D phylogenetic tree of the HIV-1 env C2V3 gene in relation to reference sequences from the Los Alamos HIV database (boldface).
Sequence Data
GenBank accession numbers of the sequences reported in this study are JN381760–JN381798.
Footnotes
Acknowledgments
Dr. Anthony Kebira is recipient of the International Society of Infectious Disease small grant and HIV-trust scholarship that funded this study.
Author Disclosure Statement
No competing financial interests exist.