
Abstract
No African studies have examined the effect of first-line nonnucleoside reverse transcriptase inhibitor (NNRTI)-based and second-line protease inhibitor (PI)-based antiretroviral therapy (ART) on body composition. We compared body composition in HIV-infected black South African women receiving NNRTI-based ART (ART1, n=344), PI-based ART (ART2, n=91), and those not on ART (ART-naive, n=309). Accordingly, body composition was measured using dual energy x-ray absorptiometry (DXA) and anthropometry in a cross-sectional study. Despite similar body mass index (BMI), ART1 and ART2 had greater central fat mass (FM) [median (IQR): 44.2 (39.4–50.1) and 46.9 (39.3–52.8) vs. 41.1 (36.3–45.2) %FM, p<0.01] and less leg FM [41.2 (34.8–45.8) and 40.2 (32.9–45.7) vs. 43.9 (39.3–48.1) %FM, p<0.01] than ART-naive women. Within ART1, waist:hip was greater [0.87 (0.81–0.92) vs. 0.84 (0.78–0.89), p=0.006], while calf skinfold was lower [15.2 (9.4–21.5) vs. 17.4 (12.0–23.6) mm, p=0.033] in women receiving efavirenz compared to nevirapine. ART2 had a greater waist:hip, and abdominal, subscapular, and suprailiac skinfolds than ART1 (p<0.05). After adjusting for time on d4T (stavudine), ART2 had greater body fat than ART1 (p<0.05). With increasing time on d4T, the decrease in leg fat (%FM) was higher in ART1 than ART2 (p=0.012, for time×treatment effect). A similar interaction was reported for total time on ART treatment (p=0.002 for time×treatment effect). In conclusion, ART was associated with increased central fat and reduced peripheral fat. Changing to a PI-based regimen in ART2, which also substitutes stavudine with zidovudine, partially reversed the peripheral fat loss observed on ART1.
Introduction
T
It is not known whether the effect of ART on body fat distribution in black South African women will be different from that reported in HIC and other LMICs in Africa. There are few studies that have examined ART-associated fat redistribution in Africa and of those, most include small numbers and all have only used anthropometric measures of body composition. 9 –12 More objective and precise measures of whole body composition may provide additional information on the effects of different ART regimens on body composition at specific sites. Dual energy x-ray absorptiometry (DXA) is a well-accepted, accurate, and reliable measure of body composition, which is able to distinguish fat from fat-free tissue in different anatomical regions.
Therefore the aim of this study was to compare body composition, using DXA and anthropometry in HIV-infected black South African women receiving South African Department of Health first-line ART [stavudine (d4T) or zidovudine (AZT), lamivudine (3TC), plus efavirenz or nevirapine], South African Department of Health second-line ART including (lopinavir/ritonavir, AZT, didanosine (dDI)], and ART-naive women.
Materials and Methods
Participants
Participants were a convenience sample of HIV-infected women presenting to ART clinics in Cape Town. At the clinics, the folders of consecutive patients were reviewed, and if they met the inclusion criteria, they were invited to participate in the study. Of the 1,035 patients recruited, 217 did not present at the laboratory for testing, and a further 74 patients had missing data or were excluded due to technical difficulties. There were three groups of participants: those not yet on ART (ART-naive; n=309), those on the South African National Department of Health first-line ART regimen consisting of d4T or AZT, 3TC, and efavirenz or nevirapine (ART1; n=344), and those on South African Department of Health second-line ART including [lopinavir/ritonavir, AZT, dDI (ART2; n=91)]. The participants for the first two groups were recruited from the Crossroads Clinic. The ART2 participants were recruited from a number of ART clinics because there were few receiving this therapy at any single clinic in Cape Town at the time of the study. In accordance with the 2004 South African National Department of Health guidelines for ART, patients are commenced on the second-line regimen if they fail to show a suppressed viral load despite compliance on the first-line regimen. Participants were excluded if they had a history of diabetes mellitus or impaired glucose tolerance, had been on ART for less than 6 months, had an active acute opportunistic infection, had severe diarrhea, had tuberculosis within 1 month of commencing treatment, had received glucocorticoid therapy within the past 6 months, or were pregnant or known to have renal failure. The study was approved by the Research Ethics Committee of the Faculty of Health Sciences at the University of Cape Town. Written informed consent was obtained from all participants prior to participation in the study.
Testing procedures
Sociodemographic details were collected via questionnaire and subjects' clinical records were used to obtain data on ART regimen, time on ART, and CD4 count.
Weight, height, circumferences (waist, hip, mid-upper arm, and mid-thigh), skinfold thickness (bicep, tricep, subscapular, abdomen, suprailiac, thigh, and calf), 13 and sagittal abdominal diameter (SAD) 14 were measured as previously described. 15 Fat mass and fat free soft tissue mass (FFSTM) were measured using DXA (Hologic Discovery-W, software version 12.7; scan region 195×65 cm2 and weight limit 160 kg) in a subsample of the three groups (ART-naive: n=143; ART1: n=103; ART2: n=70). Percentage fat mass for the whole body was obtained and fat mass for the various regions of interest, including the trunk and limbs, were derived by using DXA cutoff lines positioned at anatomical markers. The trunk included the region between the neck (line below the bottom of the jaw) and waist (line above the iliac crest) cuts with the lateral boundaries positioned to achieve separation of the upper arm and trunk at the glenoid fossa, and the inclusion of vertical lines on either side of the spine were positioned in order to exclude the spine. The arms included the region below the line through the glenoid fossa. To isolate the legs, vertical lines extending downward from the waist cut were positioned to separate the thigh from the hands, and oblique lines were positioned to pass through the femoral neck and join the central vertical line between the legs. Limb composition was determined by summing the arm and leg data, and the percentage of these regions of interest was calculated as a proportion of whole body fat mass.
Statistical analyses
All unadjusted data are presented as median and interquartile range. Missing CD4 count data was imputed. One-way analysis of variance was used to compare body composition between ART-naive, ART1, and ART2 groups, with Bonferroni post hoc analysis. If a parametric test was performed on data that were not normally distributed, a Levene's test of variation was used to determine homogeneity of the continuous data. If the variance of the groups was not equal, data were normalized (1/square root) for further analysis. Analysis of covariance, adjusting for age, was used to compare body composition data between women receiving efavirenz and nevirapine (using normalized data when required). In addition, analysis of covariance was used to compare body composition between women on ART1 and ART2, adjusting for time on d4T and total ART treatment. Adjusted data are presented as mean±standard error.
Results
Participant characteristics are presented in Table 1. ART-naive women were significantly younger than the women on ART1 and ART2, but this difference did not alter any findings and hence unadjusted (for age) values are presented. Socioeconomic status, based on housing density, was significantly lower in the ART1 group compared to the other two groups. Although the current CD4 count was significantly different between the three groups, the CD4 count at the initiation of ART was not different between the two ART groups.
p<0.05 and A p<0.01 for HIV ART-naive vs. ART1.
p<0.05 and B p<0.01 for HIV ART-naive vs. ART2.
p<0.05 and C p<0.01 for ART1 vs. ART2.
All values are mean±standard deviation.
ART, antiretroviral therapy; d4T, stavudine; AZT, zidovudine.
Anthropometric and DXA-derived measures of body composition of the ART-naive, ART1, and ART2 groups, including adjustment for time on d4T treatment and total time on ART treatment, are presented in Tables 2 and 3, respectively. Compared to the ART-naive group, women on both ART1 and ART2 treatments were heavier, but had similar BMI and fat mass (kg and %) and greater centralization of body fat, characterized by increased waist circumference, WHR, SAD, abdominal, subscapular, and suprailiac skinfold thicknesses, and trunk fat (% FM). Conversely, when compared to the ART-naive group, ART treatment was associated with lower limb wasting, characterized by reduced calf circumference and limb and leg fat (% FM). Consequently, trunk/limb fat and trunk/leg fat mass were lower in the ART-naive compared to the ART treatment groups.
p<0.05 and A p<0.01 for HIV ART-naive vs. ART1.
p<0.05 and B p<0.01 for ART-naive vs. ART2.
p<0.05 and C p<0.01 for ART1 vs. ART2.
p<0.05 and D p<0.01 for ART1 vs. ART2 adjusted for d4T time.
p<0.05 and E p<0.01 for ART1 vs. ART2 adjusted for total time on ART.
Unadjusted values are median (interquartile range) and adjusted values (for time on d4T and total time on ART) are mean±standard error.
WHR, waist:hip ratio; MAC, mid-upper arm circumference; SAD, sagittal abdominal diameter.
p<0.05 and A p<0.01 for HIV ART-naive vs. ART1.
p<0.05 and B p<0.01 for ART-naive vs. ART2.
p<0.05 and C p<0.01 for ART1 vs. ART2.
p<0.05 and D p<0.01 for ART1 vs. ART2 adjusted for d4T time.
p<0.05 and E p<0.01 for ART1 vs. ART2 adjusted for total time on ART.
Unadjusted values are median (interquartile range) and adjusted values (for time on d4T and total time on ART) are mean±standard error.
FM, fat mass; FFSTM, fat-free soft tissue mass.
When comparing the third drug within ART1, women receiving efavirenz (n=171) were significantly older than those receiving nevirapine (n=174) (37.8±9.5 vs. 32.7±7.0 years, p<0.01). After adjusting for age, BMI and body fatness were similar between those receiving efavirenz and nevirapine [BMI: 27.3 (24.3–30.9) vs. 26.7 (23.9–31.3) kg/m2, p=0.14 and %FM: 36.1 (29.8–41.4) vs. 37.1 (31.0–41.5)%, p=0.47]. When examining differences in anthropometry between groups, we found that waist:hip ratio was greater [0.87 (0.81–0.92) vs. 0.84 (0.78–0.89), p=0.006] while calf skinfold was lower [15.2 (9.4–21.5) vs. 17.4 mm (12.0–23.6), p=0.033] in the women receiving efavirenz compared to those receiving nevirapine, after adjusting for differences in age. No differences in DXA-derived measures of body fat or distribution were found between those on efavirenz or nevirapine.
Compared to women on ART1, those on ART2 had greater WHR, MAC, abdominal, subscapular, and suprailiac skinfold thickness than ART1, but the groups did not differ in any of the DXA-derived measures. When comparing efavirenz and nevirapine as individual components of the ART1 regimen, to ART2, the differences in abdominal, subscapular, and suprailiac skinfold thicknesses persisted in both groups (p<0.01 for all measures). However, those receiving efavirenz had similar waist circumference (p=0.242) and waist:hip ratio (p=0.200), but lower calf skinfold thickness (p=0.041) than those on ART2. In contrast, those receiving nevirapine had lower waist circumference (p=0.017) and waist:hip ratio (p=0.010), but similar calf skinfold thickness (p=0.747) to those on ART2. No differences in DXA-derived measures of body fat or distribution were found between ART2 and ART1 with efavirenz or nevirapine as the third-line drug.
When comparing ART1 to ART2, but adjusting for time on d4T, all anthropometric and absolute DXA-derived measures of body fat (total, and % trunk, limb, arm, leg fat mass) were greater in ART2 compared to ART1, whereas all regional measures of body fat (%FM) and trunk/limb and trunk/leg fat ratios were not different between groups. There was also a significant interaction effect between time on d4T and ART treatment groups and body fat distribution. With increasing time on d4T, leg fat decreased significantly in both groups (p=0.030) (Fig. 1A). When expressed as a percentage of total fat mass (%FM) the decrease in leg FM was greater in women on ART1 than on ART2 (p=0.012, for time×treatment effect, respectively; Fig. 1B). Consequently, there was a significant interaction effect between time on d4T and ART treatment and trunk/leg fat ratio (p=0.021). In contrast, trunk FM did not change with increasing time on d4T (p=0.396).
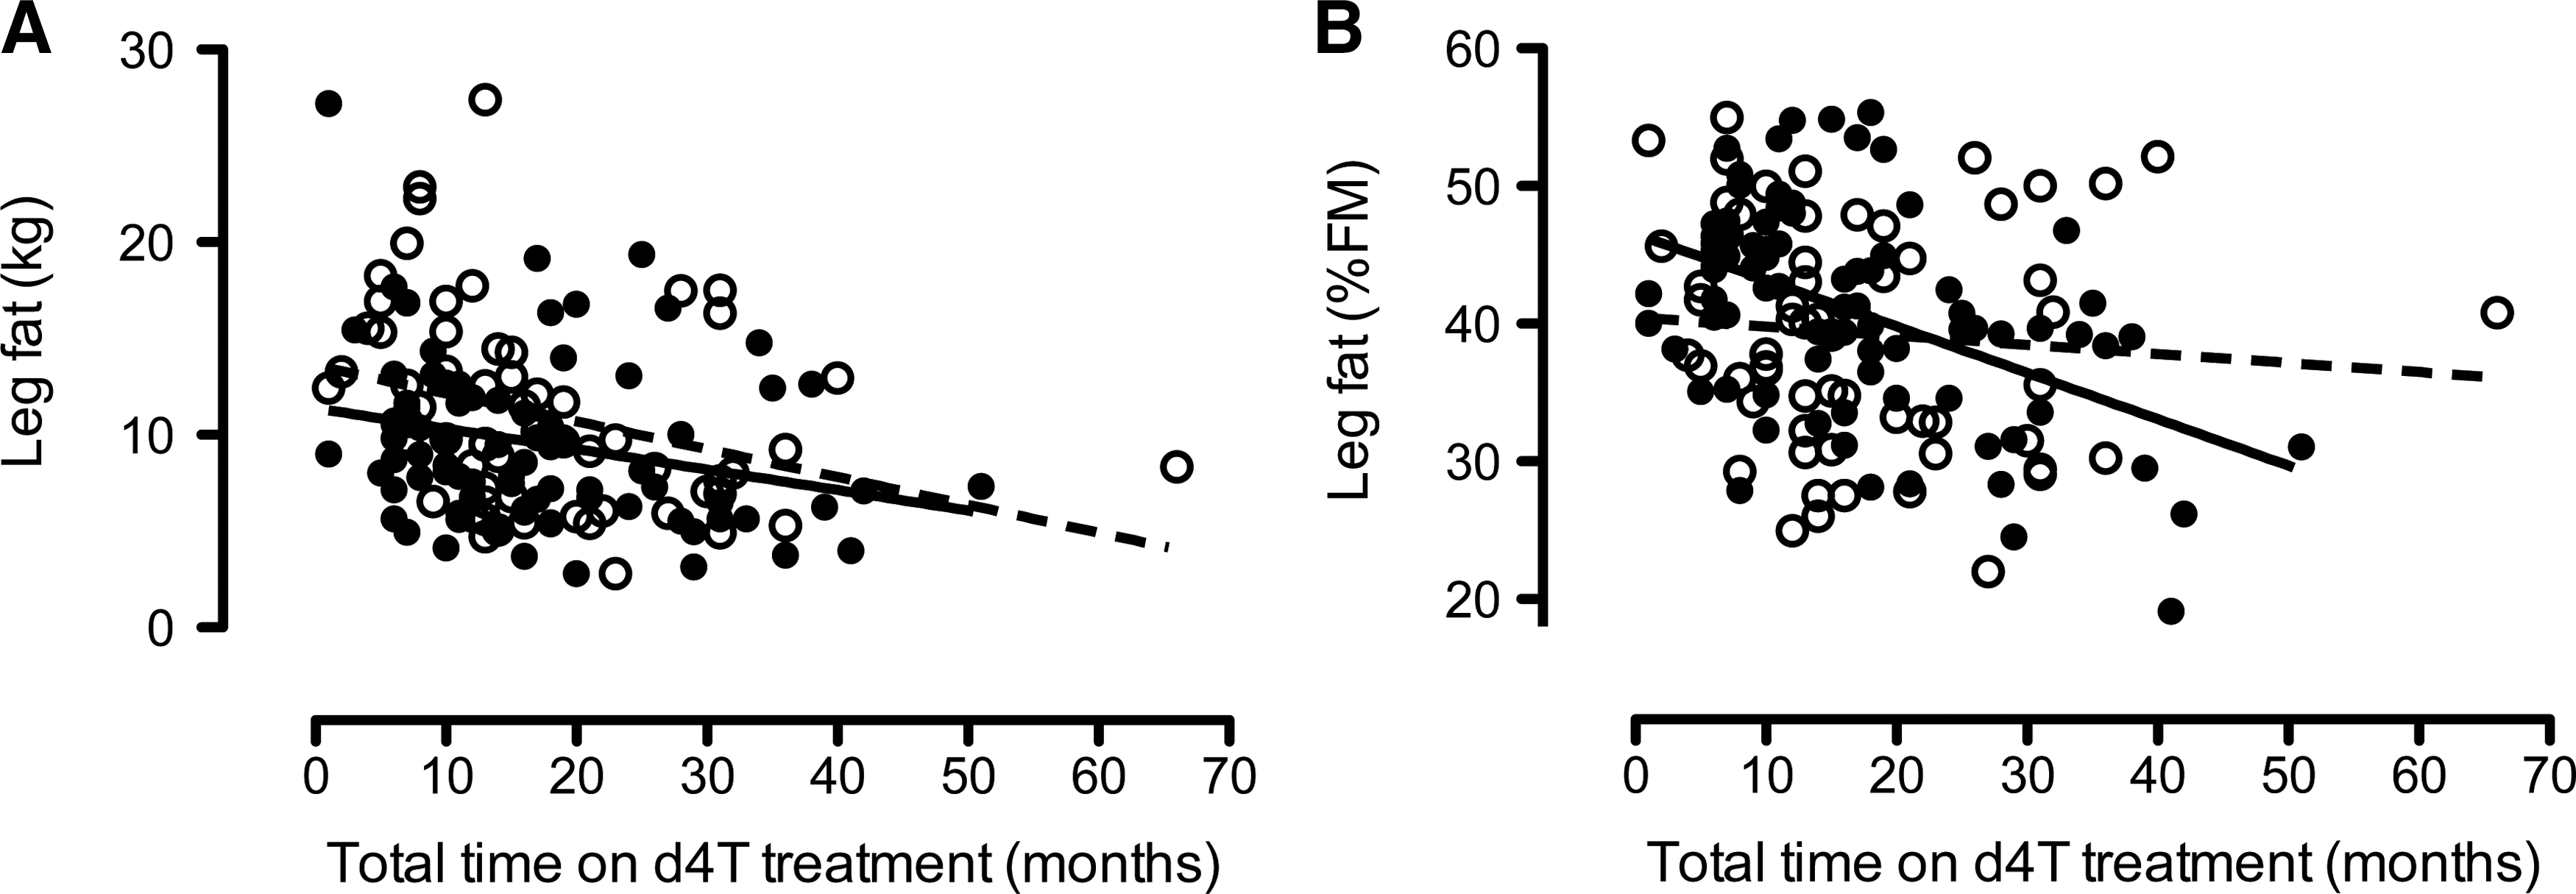
Differences in the associations between total time on stavudine (d4T) leg fat mass in women on ART1 and ART2 treatments. Graphs display the association between leg fat mass (kg) and time on d4T treatment (
When adjusting for total time on ART treatment, abdominal, tricep, thigh, and calf skinfold thickness and mid thigh circumference were higher in the ART2 than the ART1 group. Furthermore, DXA-derived measures, including total fat mass (%) and limb and leg fat (kg and %FM) were also greater in the ART2 compared to the ART1 group, whereas trunk/leg fat mass was lower in ART2 than ART1 after adjustment for total time on ART. When exploring the association between total time on ART treatment and trunk and leg fat mass (kg), trunk fat did not change (p=0.260), but leg fat decreased significantly in both groups (p=0.030). When expressed as a percentage of total fat mass (%FM), there was a significant interaction effect (p=0.003 and p=0.002 for time×treatment effect, respectively), such that the increase in trunk fat and a decrease in leg fat mass with increasing time on treatment were higher in women on ART1 than on ART2. Consequently, there was a significant interaction effect between time on d4T and ART treatment and trunk/leg fat ratio (p=0.002).
Discussion
This is the first African study, to our knowledge, to have used DXA, in addition to anthropometry, to characterize differences in body fat distribution between ART-naive and ART-treated women. It is also the first African study to report body fat composition in patients on second-line (PI-based) ART. We found that (1) despite a similar BMI, those on ART weighed more and had a greater central and lower peripheral distribution of fat compared with ART-naive women; (2) the effects of ART on peripheral body fat distribution were largely mediated by the effects of the first-line ART regimen (Fig. 1); (3) within the context of ART1 treatment, efavirenz was associated with greater centralization of body fat and more peripheral wasting than nevirapine; and (4) after adjusting for time on d4T, all anthropometric and DXA-derived measures of body fat (total, trunk, limb, arm, leg fat mass) were greater in women on second-line than on first-line ART.
The centralization of body fat we observed in ART-treated women occurred in conjunction with decreased peripheral fat, especially in those women on ART1. With increasing time on d4T, which is still widely used in first-line ART in LMIC, we found a reduction in peripheral fat mass. The lipodystrophic effects of d4T have been reported in a study from Rwanda, in which d4T was associated with a 3-fold higher prevalence of lipoatrophy compared to AZT-containing regimens. 16 In our study, after adjusting for time on d4T, patients on ART2 had significantly more limb fat than those on ART1, suggesting that ART2 may partially reverse lipoatrophy due to d4T. Similarly, in a study from Uganda, Thompson et al. 10 showed a significant increase in most body composition measurements, after 12 months of treatment with a zidovudine-containing regimen compared to an HIV-uninfected control group, suggesting that zidovudine may delay the loss in peripheral fat mass. These findings are corroborated by a randomized controlled trial in which switching from d4T to zidovudine, which occurs when patients are changed from ART1 to ART2, resulted in an increase in limb fat. 17 In addition, when combined with dual NRTIs, efavirenz is associated with more lipoatrophy than PIs, 18 –21 which could reflect protection against lipoatrophy by PIs due to their antiapoptotic properties. 22 Together, these findings suggest that less peripheral wasting and centralization of body fat, which we have shown in our study when comparing ART2 to ART1, may be associated with the dual effects of removing d4T and efavirenz and introducing PIs.
Data from Africa on body composition are limited to subjective assessment and/or anthropometric and bioelectrical impedance measurements in individuals using WHO-recommended first-line (NNRTI-based) ART. 10,11,16 In a cross-sectional study from Rwanda, van Griensven et al., 16 using questionnaire and clinical assessment, found that 34% of their patients on ART had lipodystrophy (29% had isolated lipoatrophy, 14% had isolated lipohypertrophy, and 57% had a mixed pattern of lipoatrophy and lipohypertrophy). Mercier et al., 23 using circumferences and skinfold measurements in a cross-sectional study from Senegal, reported a similar prevalence of moderate to severe lipodystrophy (31.1%); however, the majority of patients had either lipoatrophy (13.3%) or lipohypertrophy (14.5%), while the minority had a mixed pattern (3.3%). In the latter study, although a low prevalence of a mixed pattern was reported, HIV-infected patients on ART had a lower BMI and smaller skinfold thickness (tricep, subscapular, suprailiac), but greater centralization of fat (WHR, p<0.0001), compared to HIV-uninfected controls. The discrepancy in these findings may relate to different methods of defining lipodystrophy. In our study, both DXA and extensive anthropometric measurements of body composition were taken. Both of these methods showed that ART treatment was associated with peripheral wasting and centralization of body fat. However, due to the cross-sectional nature of this study, we cannot determine whether peripheral wasting and centralization of fat were independent of each other as the percentage change from baseline for each patient is unknown. However, in a longitudinal study in South Africa, George et al. 9 showed both peripheral fat wasting and centralization of body fat after treatment with ART for 2 years. Similarly, a 2-year longitudinal study in Benin showed peripheral fat wasting and centralization of body fat with ART when using bioelectrical impedance and skinfold thickness to measure body composition. 12 However, when using a clinical measure of lipodystrophy, Zannou et al. 12 reported only a 2.5% prevalence of mixed lipodystrophy, findings similar to the cross-sectional studies that also reported disparate findings between anthropometric and clinical assessment of lipodystrophy.
The greater waist circumference, trunk fat, and SAD without a concomitant increase in abdominal skinfold thickness in the ART1 group suggests that the increase in centralization of body fat on ART1 may be due to an increase in visceral, rather than subcutaneous adipose tissue deposition. In contrast, the greater waist circumference in the ART2 group compared to the ART-naive women was accompanied by an increase in abdominal skinfold thickness as well as SAD, suggesting an increase in both visceral and subcutaneous abdominal fat deposition. This may be due to the patients on ART2 being clinically better (higher CD4 counts) or may be due to an effect of the PIs on body fat distribution. 24 Although computerized tomography and magnetic resonance imaging are the gold standard measures of visceral fat, SAD has been shown to be a proxy measure of visceral adipose tissue (VAT) 25 while skinfolds are a proxy measure for subcutaneous adipose tissue (SAT). Future studies are required to verify this finding of greater VAT accumulation in response to ART1 using the gold standard measures in this population.
The major strengths of this study were that body fat and its distribution were measured using DXA in a large group of women from sub-Saharan Africa who were ART-naive or on first- and second-line ART. DXA provides an objective measure of body fat with high precision. In contrast, the measurement of body fat distribution using skinfold thickness and circumferences is influenced to a greater extent by measurement error and is limited when used in overweight and obese populations. However, the difference in DXA-derived leg fat between ART-naive and ART2 groups was not reflected by the calf skinfold measure. This is likely to be due to the calf skinfold measurement reflecting fat mass of only the lower leg, not including the thigh, rather than measurement error of the calf skinfold. The skinfolds were measured by a single experienced biokineticist and stringent quality control assessment was in place. Alternatively, the smaller number of patients who underwent a DXA scan could explain this result. Nonetheless, skinfold thickness measures tracked those of DXA for most sites, suggesting that in resource-poor communities, skinfolds can be used to measure body fat distribution. Our study has some limitations. The cross-sectional nature of the design does not allow us to infer causality, we did not include an HIV-uninfected control group, and viral load was not always measured at the same time as the DXA measurement. In addition, due to policy changes in South Africa, the dosage of d4T changed during the study period and the initiation of ART was at different time points for the groups. However, the majority of the participants were recruited while taking d4T 30 mg twice daily.
In conclusion, in this large cohort of black African HIV-infected women, we showed that ART was associated with increased central and reduced peripheral fat mass. Changing to a PI-based regimen, which also substitutes stavudine with zidovudine, partially reversed the peripheral fat loss and was also associated with an increase in total body fat. These effects of d4T and efavirenz on body composition should be part of a patient counseling protocol. Future African studies should evaluate body fat distribution longitudinally, ideally using a measure of visceral fat, and compare this with HIV-uninfected people of both sexes.
Footnotes
Acknowledgments
We would like to acknowledge Carmen Delport for coordinating the study and Linda Bewerunge for performing the DXA scans. This research was supported by grants from the World Diabetes Foundation and the South African Department of Health. G. Maartens was supported in part by the National Research Foundation.
Author Disclosure Statement
No competing financial interests exist.