
Abstract
HIV-1-infected patients have an increased risk of osteoporosis and fractures. The main objective of this study was to evaluate the bone metabolism in HIV-1-infected patients exposed to calcitriol and cholecalciferol. We also investigated the relationship between T cells and bone markers. We conducted a placebo-controlled randomized study running for 16 weeks including 61 HIV-1-infected males, of whom 51 completed the protocol. Nineteen participants were randomized to daily treatment with (A) 0.5–1.0 μg calcitriol and 1,200 IU (30 μg) cholecalciferol, 17 participants to (B) 1,200 IU cholecalciferol, and 15 participants to (C) placebo. At baseline and after 16 weeks, we determined collagen type 1 trimeric cross-linked peptide (CTx), procollagen type 1 N-terminal peptide (P1NP), parathyroid hormone (PTH), ionized calcium, 25-hydroxyvitamin D (25OHD), and 1,25-dihydroxyvitamin D [1,25(OH)2D]. We determined naive CD4+ and CD8+, activated CD4+ and CD8+, and regulatory CD4+CD25+CD127(low) T lymphocytes. Baseline levels of P1NP and CTx correlated (coefficient 0.5, p<0.001) with each other but not with PTH, 25OHD, or 1,25(OH)2D. In patients receiving calcitriol and cholecalciferol, the mean levels of P1NP (p<0.001) and CTx (p= 0.002) declined significantly compared to our placebo group. Based on changes in P1NP and CTx, we estimated that net bone formation occurred more frequently in group A compared to groups B and C. PTH correlated inversely with naive CD4+ and CD8+ cells. Otherwise, no relationships between bone markers and T lymphocytes were demonstrated. Supplementation with calcitriol and cholecalciferol induced biochemical indications of bone formation in HIV-1 patients.
Introduction
B
The loss of bone mineral in HIV-1-infected patients could be caused by alterations in the number of circulating T lymphocytes and especially regulatory T lymphocytes (Tregs). Tregs have the ability to suppress the proinflammatory components of the immune system and reduce the effects of an elevated inflammatory state, 9 but only a few papers have addressed the influence of Tregs on bone metabolism. In one study, transgenic mice with an expanded Treg population were found to have an increased bone mass, and one in vitro study has demonstrated suppressive effects of Tregs on osteoclast activity and bone resorption. 10,11 One clinical study has addressed the relationship between Tregs and bone metabolism, and found that the levels of Tregs correlated inversely with serum markers of osteoclastogenesis, indicating that reduced levels of Tregs are related to increased bone resorption. 12
Biochemical bone markers of bone formation and resorption can be used to evaluate bone metabolism. Bone formation can be assessed by osteocalcin, bone-specific alkaline phosphatase, and N-terminal and C-terminal propeptides of type I procollagen (P1NP, P1CP). Useful markers of bone resorption include N-terminal and C-terminal cross-linking telopeptides of type I collagen (NTx, CTx) and deoxypyridinoline (DPD). 13
We speculated whether substitution with vitamin D would change bone marker levels in patients with HIV-1 infection. We chose to measure CTx and P1NP in order to evaluate resorption and formation. We also wanted to investigate whether any changes in CTx and P1NP would be associated with changes in CD4+, CD8+, and Treg fractions of the T lymphocyte compartment. We conducted a prospective, double-blind, randomized study using cholecalciferol and calcitriol as study medication to test our hypothesis.
Materials and Methods
Patient population
The present study was a substudy using the same cohort as our primary study, which evaluated the effects of cholecalciferol and calcitriol on T lymphocytes. 14 Patients were included from July 2008 through September 2009 from the outpatient clinic at the Department of Infectious Diseases, Hvidovre Hospital. We recruited HIV-1-seropositive males receiving HAART. The exclusion criteria were age under 18 years, previous bone disease, tuberculosis, sarcoidosis, active malignant disease with bone metastasis, or elevated serum calcium. Written informed consent was obtained from all participants. The regional Ethics Committee and the National Board of Health approved the study (2006-005039-40). The study was registered at clinicaltrials.gov (NCT00990678) and was monitored by the Department of Good-Clinical-Practice at the University of Copenhagen.
Therapy
Excel was used to generate a randomization list and we assigned the participants to one of three groups receiving daily treatment for 16 weeks with either (A) 1.0 μg calcitriol, 1,200 IU cholecalciferol, or 800 g of calcium or (B) 1,200 IU cholecalciferol and 800 g of calcium, or (C) 800 g of calcium. Placebo tablets were used. To ensure a rapid increase in the levels of 25-hydroxyvitamin D (25OHD), groups A and B received 100,000 IU cholecalciferol as a subcutaneous injection, while group C received a saline injection. Patients and investigators were blinded throughout the study period.
Endpoints
Our primary outcomes were the bone metabolism markers CTx and P1NP measured at entry and finish of the study at the biochemical department at the Hospital of Aarhus (cobas 6000 platform, Roche Diagnostics). The normal ranges for CTx varied with age and were 0.16–0.87 μg/liter for men aged less than 30 years, 0.09–0.63 μg/liter for men aged 30–50 years, 0.04–0.84 μg/liter for men aged 50–70 years, and 0.08–1.05 μg/liter for men older than 70 years. The normal range for P1NP was 20–76 μg/liter. The intermediate precision coefficients of variance (CV) were 3.0% for CTx and 2.3% for P1NP. The other biochemical endpoints were PTH (Cobas e601, Roche Diagnostics, reference range 1.1–7.1 pmol/liter, CV% 3.4%), ionized calcium (Vitros 5.1, Ortho Clinical Studies, reference range 1.18–1.32 mmol/liter, CV% 2.3%), 25OHD (Thermo Fisher Scientific, reference range>50 nmol/liter, CV% 9.6%), 1,25(OH)2D (Perkin Elmer, reference range 60–180 ng/ml, CV%, 6.8–14%), and HIV-1-RNA (COBAS AmpliPrep/TaqMan HIV-1 test, Roche Diagnostics, CV% 8%). However, data on HIV-RNA were not suitable for statistical analysis due to maximal suppression of viral replication in all but three participants.
In our analysis, we also included data from our primary study on T lymphocyte subsets. In short, all blood samples were analyzed using a FACSCalibur (BD) and data were handled using CellQuestPro (BD). Five subsets were reported: CD3+CD4+CD25+CD127 low regulatory T lymphocytes (Tregs), naive CD4+ (CD4+CD45RA+CD27+CD62L+), activated CD4+ (CD4+CD38+HLA-DR+), naive CD8+ (CD8+CD45RA+CD27+CD62L+), and activated CD8+ (CD8+CD38+HLA-DR+). Details on the quantification of T cells have been previously reported. 14
Statistical analysis
The sample size estimation was based on changes in 25OHD. 14 A minimal mean change in 25OHD of 20 nmol/liter would need a sample size of 50 patients entering a per-protocol analysis. Any changes in CTx and P1NP with this sample size would be clinically important changes based on earlier reports on drugs that alter bone metabolism. 13 Descriptive data on the participants were tested for normality using Kolmogorov–Smirnov and were presented as means or medians where appropriate. Changes in biochemical outcomes were tested using general linear models. Subsequent pairwise comparisons were Bonferroni corrected. Two-tailed p-values of<0.05 were considered significant. We used the statistical software package SPSS v.17 (SPSS Inc., Chicago, IL). Pharmaceutical preparations and randomization were carried out at the Pharmacy of Odense University and their patients.
Results
Baseline characteristics
A total of 119 patients were eligible to participate in the study. Fifty-eight patients declined due to lack of time (12), interest (39), comorbidity (4), or willingness to pause the vitamin D substitution (3). Sixty-one persons were randomized, of whom 51 completed the protocol. During the months March through August, we included in total 15 patients who were distributed equally among the groups. Table 1 shows the baseline clinical and biochemical characteristics. Between the groups no differences in smoking habits, working status, sun exposing habits, or route of HIV transmission were found. Only two patients used vitamin D supplementation prior to the study. The groups were also comparable with regard to baseline levels of P1NP, CTx, PTH, ionized calcium, daily calcium intake, CD4+ cells, and type of HAART.
P1NP, procollagen type 1 N-terminal peptide; CTx, collagen type 1 trimeric cross-linked peptide; PTH, parathyroid hormone.
Adverse events and compliance
Ten patients were excluded during the study because of failure to follow study appointments (4), lack of time (3), or unacceptable side effects (3). One was from group A, two from group B, and seven from group C (p= 0.06). Unacceptable side effects were constipation, diarrhea, or problems swallowing the tablets. Overall compliance was 77% for calcitriol/placebo and 67% for cholecalciferol/placebo, but 15% of the participants did not return the study medication. Eleven patients experienced adverse events related to the study medication, which included hypercalcemia (>1.35 mmol/liter) in three cases (two in group A and one in group B) and constipation in eight cases. Eleven other patients experienced adverse events not related to the study medication. The study medication was reduced or stopped in six cases (two in each treatment group).
P1NP and CTx
At baseline, P1NP was elevated in three participants and CTx was elevated in one. In simple correlation models, baseline values of P1NP correlated positively with CTx (coefficient 0.5, p<0.001) but not with PTH, ionized calcium, or 25OHD. Neither were any associations between baseline levels of CTx and baseline levels of 25OHD, PTH, or ionized calcium found. The patients receiving tenofovir had levels of P1NP and CTx similar to the rest of the cohort. This was also the case for abacavir and protease inhibitors (PI). However, the users of nonnucleoside reverse transcriptase inhibitors (NNRTIs) had nearly significant lower median levels of CTx (0.25 vs. 0.33, p= 0.016, Bonferroni corrected p-value 0.06) but comparable levels of P1NP (Table 2). Age, smoking habits, and calcium intake prior to the study were not associated with the levels of either P1NP or CTx.
The users of NNRTI had lower levels of CTx compared to nonusers of NNRTI: * p=0.016 (Bonferroni corrected p-value 0.06).
P1NP, procollagen type I N-terminal peptide; CTx, collagen type I trimeric cross-linked peptide; PI, protease inhibitor; NNRTI, nonnucleoside reverse transcriptase inhibitor.
The overall mean changes (SEM) of all groups during the study were –9.8 (1.7) μg/liter in P1NP and –0.09 (0.02) μg/liter in CTx. A significantly larger mean decline of absolute values of P1NP was found in group A compared to group C (–16.3 vs. –2.0 μg/liter, p<0.001), but not compared to group B (–16.3 vs. –9.3 μg/liter, p= 0.1). The absolute decline in CTx was also larger in group A compared to group B (–0.16 vs. –0.04 μg/liter, p= 0.002) and group C (–0.16 vs. –0.04 μg/liter, p= 0.003) (Fig. 1). The absolute changes of P1NP and CTx in groups B and C were similar.
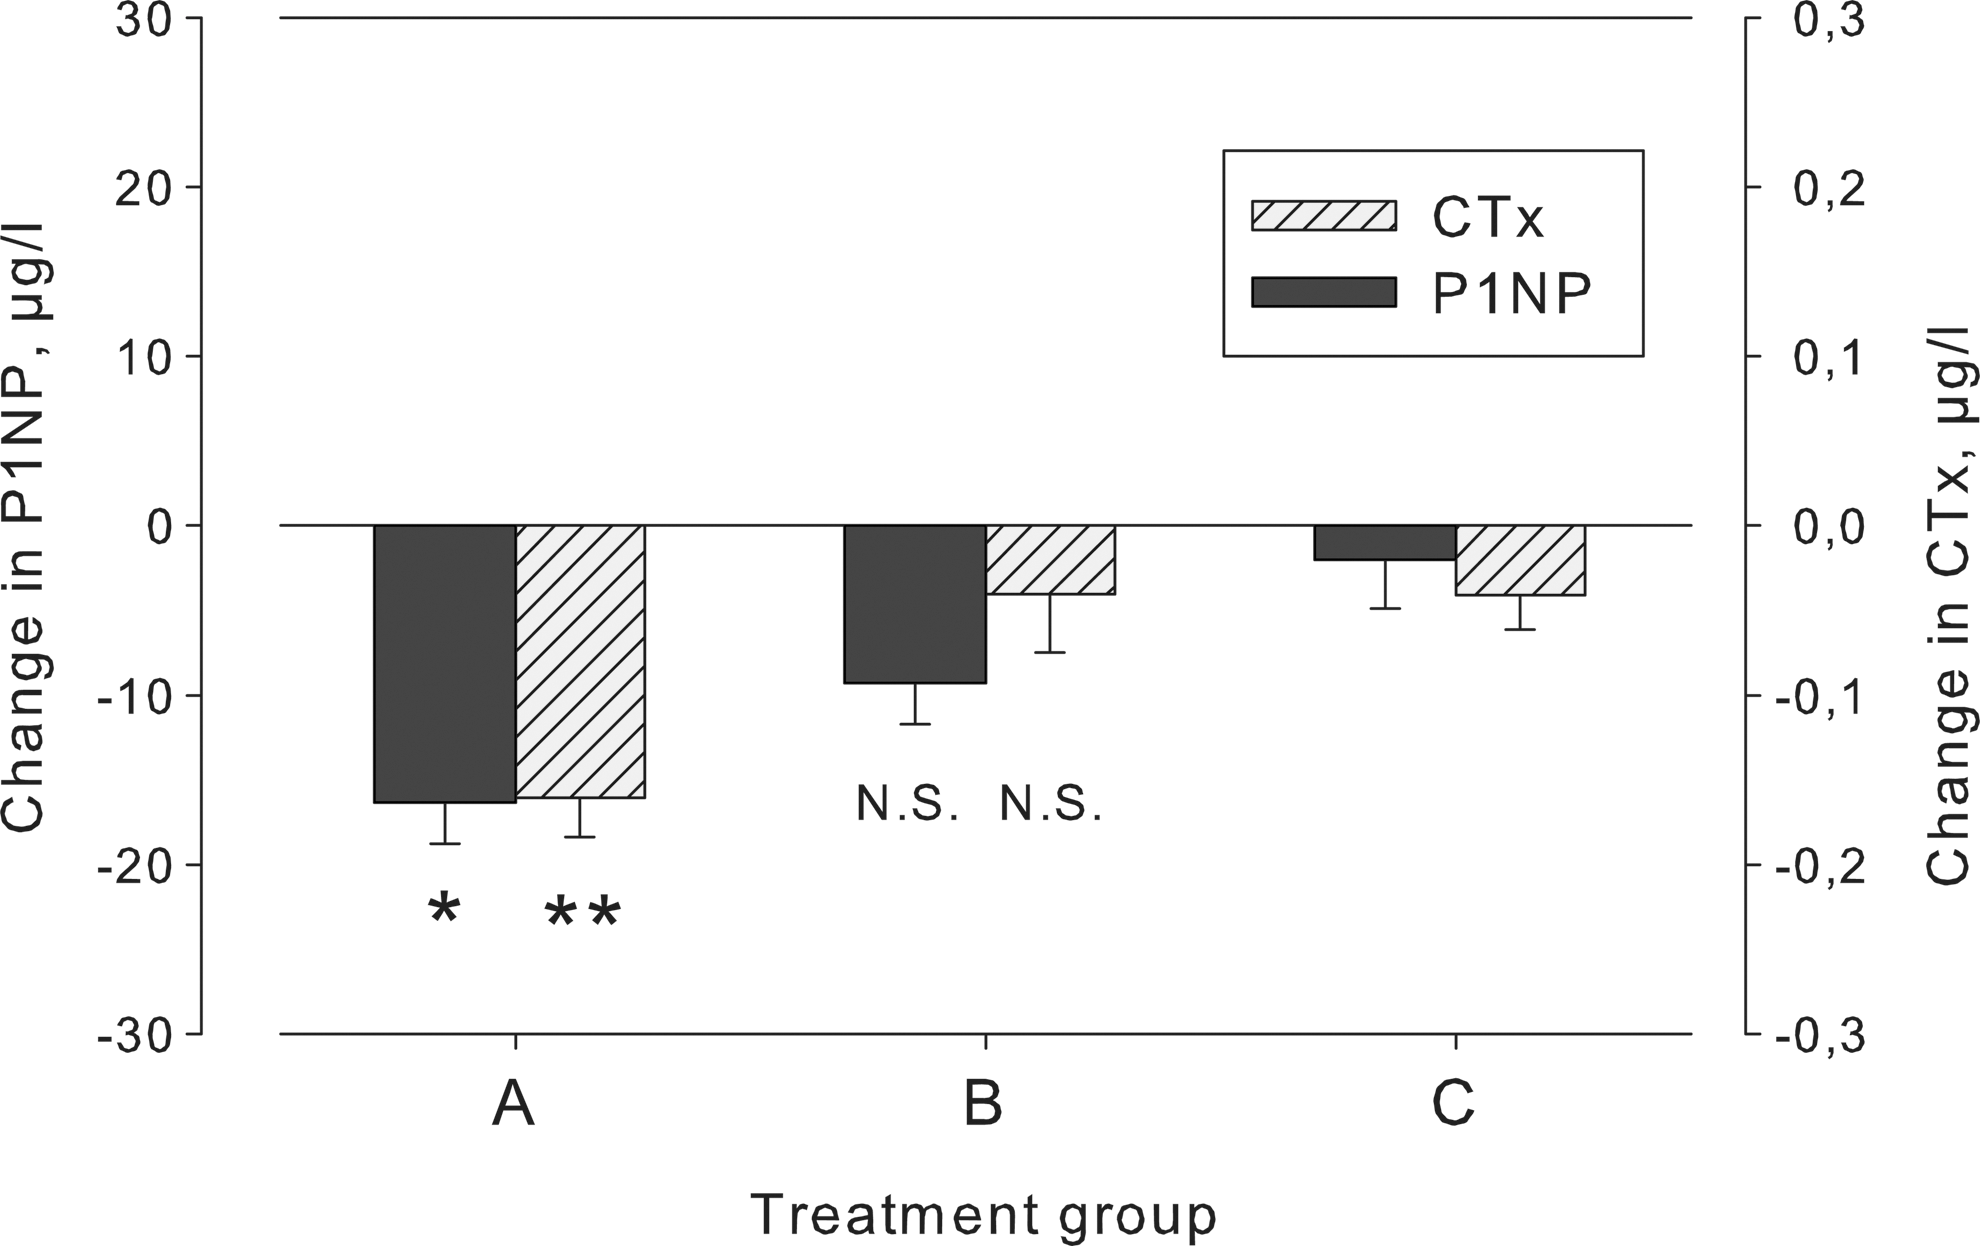
The changes in procollagen type 1 N-terminal peptide (P1NP) and cross-linked peptide (CTx) in 51 HIV-1 patients randomized to 16 weeks of treatment with
The decrease of P1NP relative to the baseline value in group A was 37%, which was larger than the relative change of P1NP in group C (2%, p<0.001). Similarly, CTx decreased relatively more in group A compared to group C (Table 3). If the relative decrease of the bone resorption marker CTx throughout the study was larger than the relative decrease of the bone formation marker P1NP in a particular participant, we assumed that bone formation was stimulated. Consequently, net bone formation was predominant in 16/19 patients from group A compared with 7/17 and 8/15 from groups B and C, respectively. This distribution deviated significantly from the expected (chi-square test, p= 0.02) and no interactions were found with changes in PTH or 1,25(OH)2D in a logistic regression analysis.
We assumed that a net bone formation was taking place in the participants with a larger relative decrease of CTx compared to P1NP and the participants with biochemical indications of bone formation were found more frequently in group A (chi-square test, p=0.02).
P1NP, procollagen type 1 N-terminal peptide; CTx, collagen type 1 trimeric cross-linked peptide.
T lymphocyte fractions
None of the studied T lymphocyte fractions correlated with baseline levels of P1NP or CTx. PTH was not associated with the CD4/CD8 ratio, but we found weak inverse correlations between PTH and naive CD4+ (r=0.4, p= 0.004) and CD8+ T lymphocytes (r=0.3, p= 0.04). These associations remained significant in models adjusted for ionized calcium, 25OHD, and 1,25(OH)2D, but when applying the Bonferroni correction, only the association between PTH and naive CD4+ cells remained significant (p= 0.02) (Fig. 2). Changes in PTH were not associated with changes in naive CD4+ or CD8+ though. During the study, the levels of T lymphocyte fractions remained unchanged in all groups and changes in P1NP and CTx were not associated with changes of any of the T lymphocyte fractions studied. We have previously reported that changes in relative levels of Tregs correlated inversely with changes in PTH (–2% per 10 pmol/liter; p= 0.02) and with 1,25(OH)2D (1% per 100 pmol; p= 0.01). 14
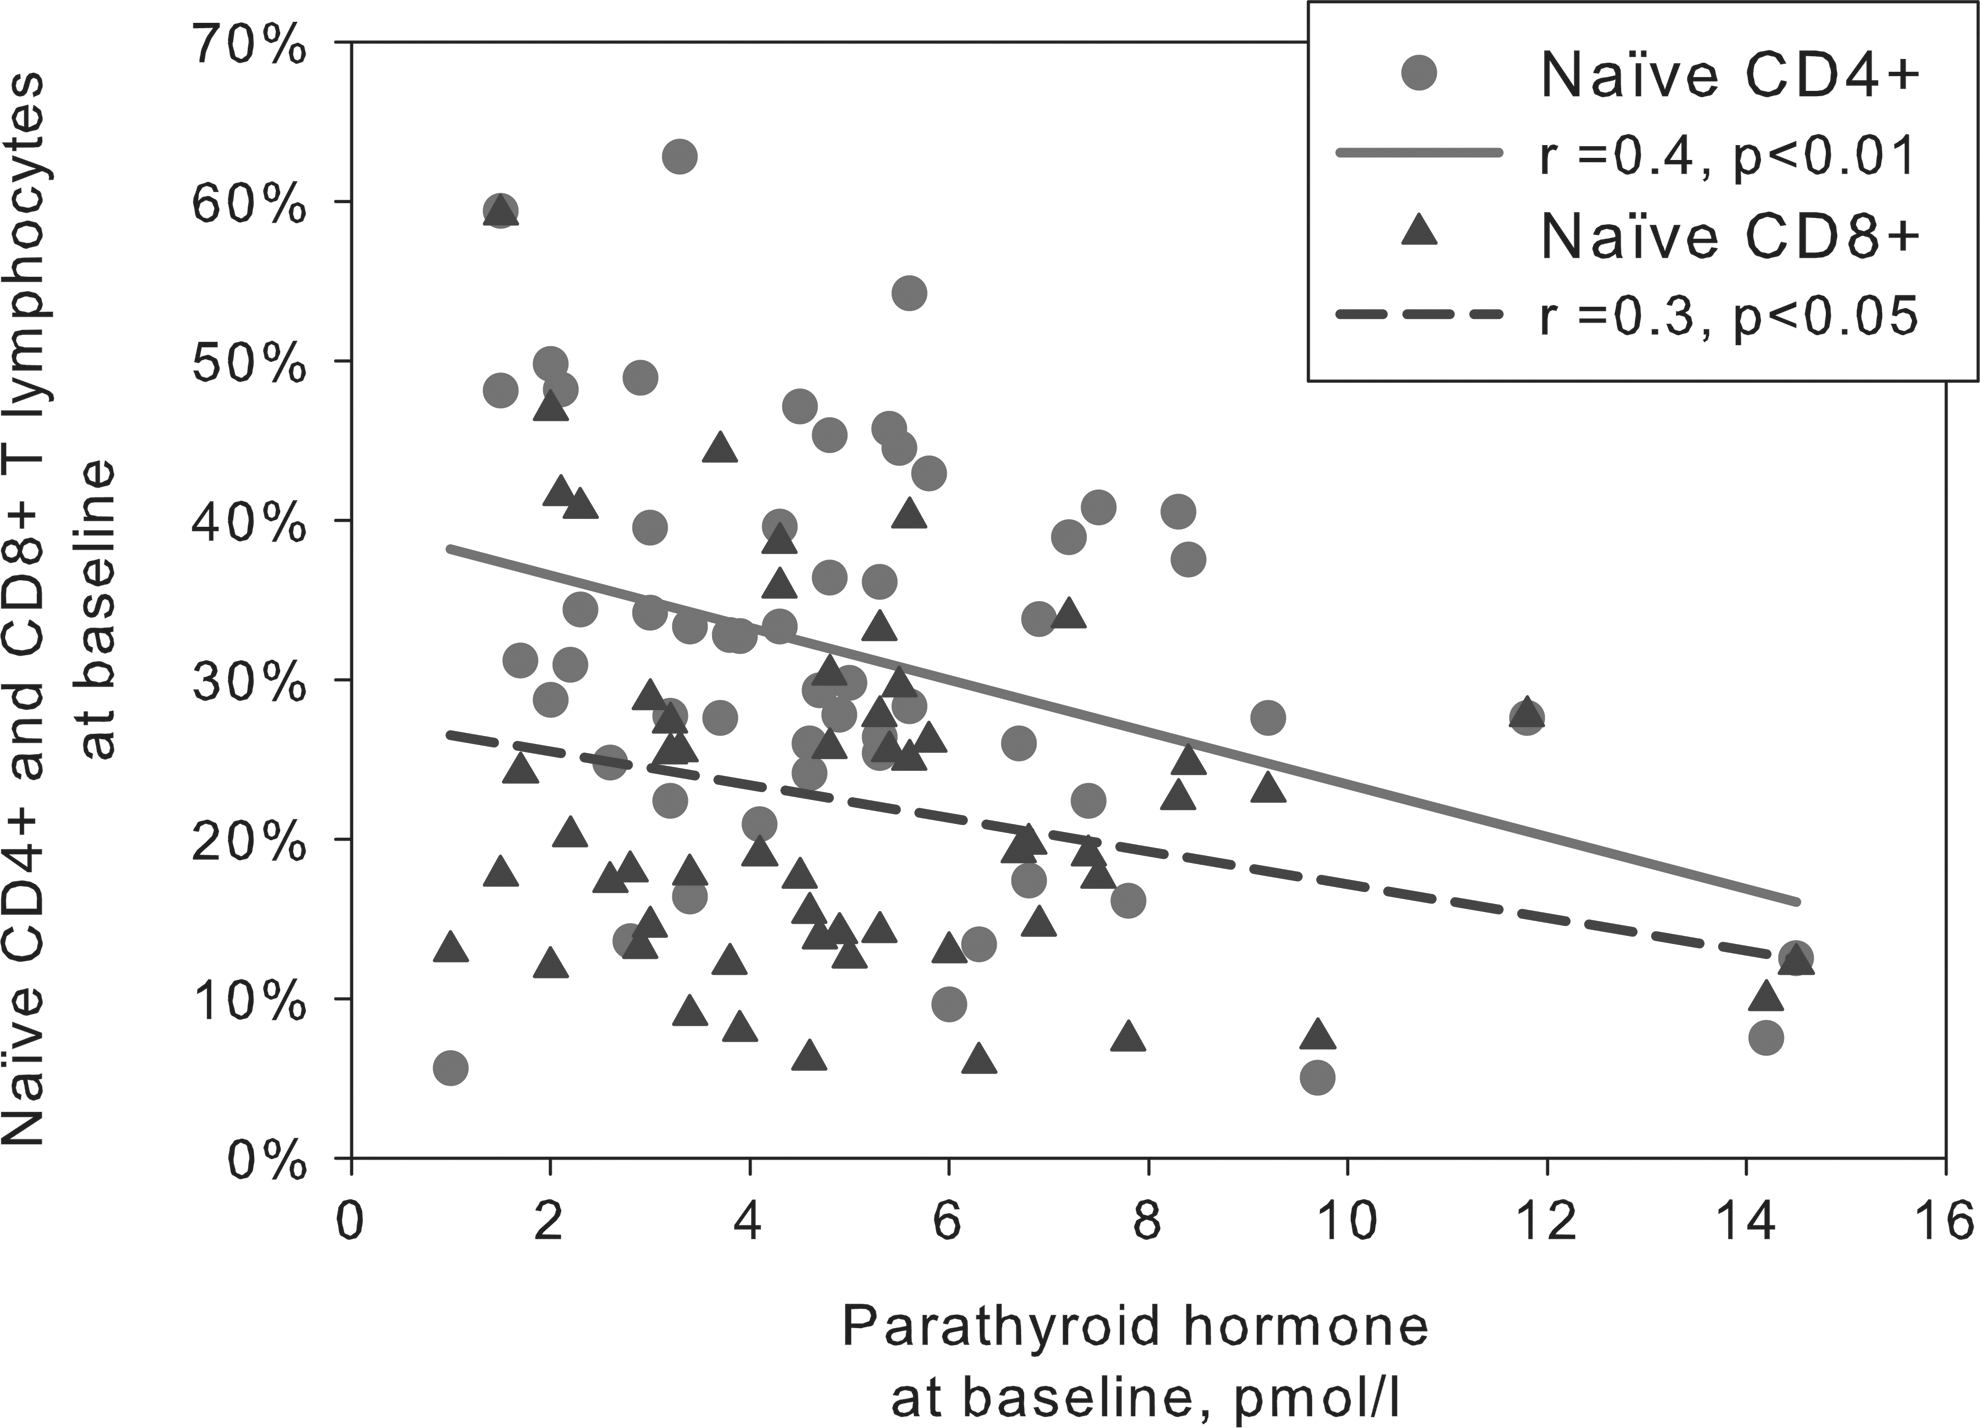
Baseline levels of parathyroid hormone (PTH) correlated inversely with levels of naïve CD4+ and CD8+ T lymphocytes. The correlations were weak to moderate and remained significant when adjusting for ionized calcium, 25-hydroxyvitamin D (25OHD), and 1,25-dihydroxyvitamin D [1,25(OH)2D]. When applying Bonferroni correction, only the association between PTH and naive CD4+ cells remained significant (p=0.02).
PTH, ionized calcium, 25OHD, and 1,25(OH)2D
At baseline, the levels of 25OHD were<25 nmol/liter in 6%, 25–50 nmol/liter in 20%, 50–75 nmol/liter in 48%, and>75 nmol/liter in 27% of the participants. Eleven participants had PTH levels higher than the reference range and only one participant had PTH levels lower than the reference range. Changes in PTH during the study were larger in group A (–3.9 pmol/liter) compared to group B (–0.7 pmol/liter, p<0.001) and group C (0.1 pmol/liter, p<0.001). We found nonsignificantly larger increments of ionized calcium in group A compared to group B (0.05 vs. 0.01 mmol/liter, p= 0.1) and group C (0.05 vs. 0.01 mmol/liter, p= 0.2). The levels of 25OHD increased 13 nmol/liter in group A (p= 0.007) and 11 nmol/liter in group B (p<0.001), but changes in 1,25(OH)2D were similar between groups (p= 0.3) (Table 4).
Absolute changes in PTH, ionized calcium, 25OHD, and 1,25(OH)2D in the three groups expressed in means (SEM) and with Bonferroni corrected p-values of pairwise mutual adjusted comparisons using group C (placebo) as reference.
P1NP, procollagen type 1 N-terminal peptide; CTx, collagen type 1 trimeric cross-linked peptide; PTH, parathyroid hormone; 25OHD, 25-hydroxyvitamin D; 1,25(OH)2D, 1,25-dihydroxyvitamin D.
Decreases in PTH were associated with increases in ionized calcium in a model adjusted for changes in 25OHD and 1,25(OH)2D (Fig. 3). This indicated that the PTH-calcium axis was intact in our participants.
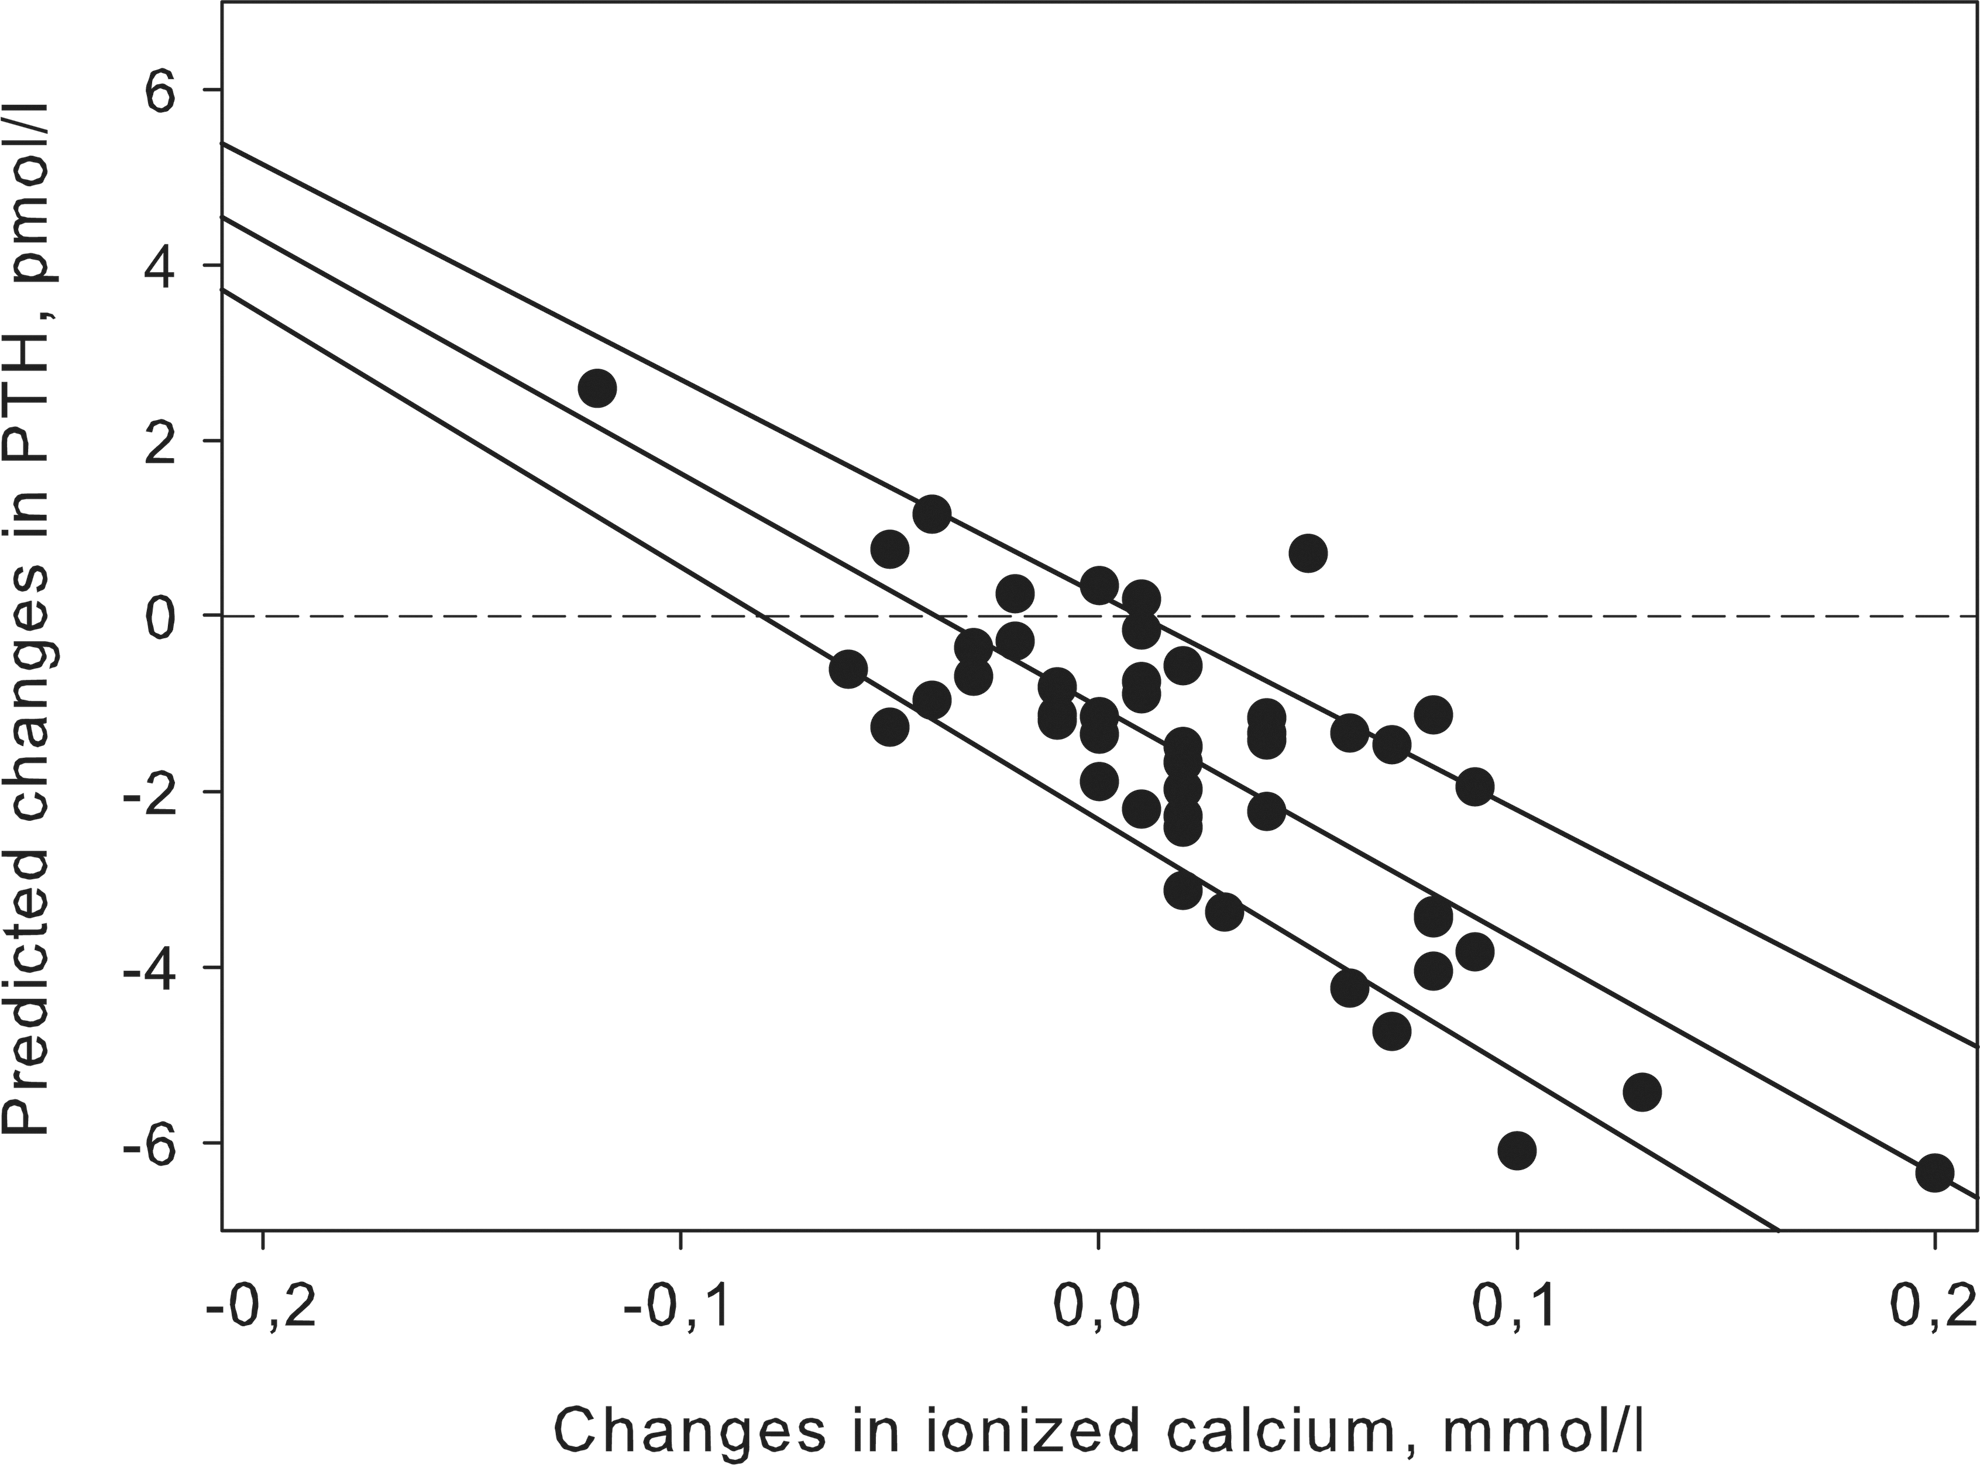
The changes in PTH during the study were dependent on changes in ionized calcium in group A. The figure shows the predicted values with 95% CI interval of PTH in a model adjusted for 25-hydroxyvitamin D and 1,25(OH)2D.
Discussion
The main objective of this substudy was to evaluate the impact of vitamin D substitution on bone markers and the relationship between bone markers and T lymphocytes. We induced increases of 25OHD in our treatment groups, whereas a season-dependent decrease was found in our placebo group. No increases in 1,25(OH)2D were demonstrated, which illustrates the tight regulation of this active metabolite of vitamin D. The observed changes in PTH correlated inversely with changes in ionized calcium, indicating that the negative feedback mechanism of calcium on the parathyroid gland was, as least partly, intact. As mentioned above, one earlier study on HIV-1-infected patients had demonstrated impaired function of the parathyroid gland when inducing hypocalcemia, but that study is not comparable to our study. We maintained normocalcemic or elevated levels of ionized calcium in our participants, which triggered a diminished PTH secretion in contrast to Jaeger et al., who induced a hypocalcemic state and furthermore included severely immunocompromised participants. 3
We observed biochemical indications of bone formation more frequently in the group receiving calcitriol and cholecalciferol compared to our placebo group, but it should be noted that this is merely an assumption since we did not perform dual-energy X-ray absorptiometry (DEXA). Moreover, this study was not powered to detect changes in DEXA that would have been diminutive due the short duration of the study. Calcitriol has been shown to decrease the risk of fracture in postmenopausal women 15,16 and one analogue is available in Japan for the treatment of osteoporosis. 17 HIV-1-infected patients with osteoporosis can normally be treated with oral bisphosphonates, 18,19 but if any contraindications to bisphosphonates are present calcitriol could be considered. 20 It is also worth mentioning that all our participants received supplementation with calcium and the total intake of calcium was probably larger than the present recommendations. 21
There is substantial evidence supporting a disturbed bone metabolism in HIV-1-infected patients. A histomorphological study of bone biopsies from 22 HIV-1-infected patients naive to HAART revealed decreased bone formation compared to 17 healthy controls. 22 Several studies have evaluated bone mineral density (BMD) and in one study with 142 HIV-1-infected compared to 15 controls, lower BMD was found but calcium levels were similar. 23 This was also the case for another small study that compared BMD and bone markers in 143 HIV-1-infected patients with 35 controls. 24 Low BMD increases the risk of fracture and a relative fracture risk of 1.6 (p<0.0001) was demonstrated in a population-based study with 8,525 HIV-1-infected patients and 2,208,792 controls. 1
The observations of reduced BMD in HIV patients have been attributed to the accumulation of HIV-independent risk factors for osteoporosis among HIV patients, e.g., smoking, 25 opiate abuse, 26 hypogonadism, 27 or reduced body mass index. 28 High prevalences of hypovitaminosis D compared to controls have also been reported, 4,29 together with reduced calcium levels. 30 Nevertheless, most attention has been given to HAART as a protagonist of bone loss and osteoporosis. While the mechanisms by which HAART influences bone metabolism remain unclear, reduced BMD was frequent among patients receiving HAART in earlier studies. A meta-analysis including seven studies yielded an odds ratio of 2.4 (95% CI 1.2–4.8) for having osteoporosis in patients receiving HAART compared to HAART-naive patients, 7 and continuous exposure to HAART seems to exacerbate the decline in BMD compared to intermittent exposure. 8
All the participants in our study received HAART and we found nearly significantly higher levels of CTx in 39 patients receiving NNRTIs compared to the rest of the cohort. That finding, however, does not support any deleterious effect of NNRTIs on bone metabolism since the participants in our study received highly heterogenic HAART regimes. In addition, the means of CTx were within the normal range among patients receiving NNRTIs and other types of HAART.
We also speculated whether the levels of T lymphocytes were associated with bone formation. We found weak inverse correlations between baseline levels of naive CD4+, naive CD8+, and PTH. Moreover, we could demonstrate that decreases in PTH and increases in 1,25(OH)2D promote an increase of Tregs. 14 In spite of these associations, we did not establish any relationship between bone markers and any of the T lymphocyte fractions studied. The interactions between PTH and T lymphocytes have been studied mostly in patients with kidney diseases and various associations have been reported including an increased CD4/CD8 ratio among patient with high PTH, 31 a decreased CD4/CD8 ratio, 32 and an in vitro stimulatory effect of PTH on T lymphocytes. 33 It remains to be elucidated whether the interaction between PTH and T lymphocytes has any clinical relevance in HIV-1-infected patients.
This study indicates that supplementation with calcitriol and cholecalciferol to HIV-1-infected patients results in changes in P1NP and CTx, indicating that bone formation takes place. In our study, this was accompanied by a decrease in PTH. We suggest that calcitriol should be considered in HIV-1-infected patients who are not candidates for bisphosphonates.
Footnotes
Acknowledgments
We thank Pharma-Vinci for sponsoring Unikalk Basic and Unikalk Forte and Roche for sponsoring Rocaltrol. We are greatly thankful to Annette Rank for performing the flow cytometry and the medical doctors at the Department of Infectious Diseases for recruiting patients.
Author Disclosure Statement
No competing financial interests exist.