
Abstract
Viremic slow progressors (VSP) are a rare subset of HIV-infected persons who exhibit slow immunologic progression despite high viremia. The mechanisms associated with this slow progression remain to be defined. Clinical characteristics of VSP are similar to those of natural hosts for simian immunodeficiency virus (SIV), such as sooty mangabeys (SM) and African green monkeys (AGM), who maintain near-normal CD4 counts despite high-level viremia but maintain low immune activation. Immune activation is a powerful predictor of disease progression, and we hypothesized that low immune activation might also explain the VSP phenotype. Using multiparameter flow cytometry, we assessed levels of T cell activation and regulatory T cells (Treg) in blood and rectal mucosa of VSP, typical progressors, virologic controllers, and seronegative controls. We also assessed Treg function and CD4 T cell proliferative capacity in VSP. Contrary to expectations, we found that VSP subjects have high levels of T cell activation in the gastrointestinal mucosa. The ratio of Treg to CD3+ T cells in the mucosa of VSP was relatively low, potentially contributing to increased immune activation. Nonetheless, CD4+CD25– T cells isolated from these individuals displayed a comparatively weak proliferative response to anti-CD3 stimulation. These data reveal that the VSP phenotype is associated with elevated markers of mucosal immune activation and low numbers of mucosal Treg, suggesting that factors other than immune activation account for this phenotype.
A
The clinical characteristics of VSP are similar to those of natural hosts for simian immunodeficiency virus (SIV), sooty mangabeys (SM), and African green monkeys (AGM). 6 Chronically infected SM and AGM maintain near-normal CD4 counts despite high-level viremia, but also maintain low peripheral immune activation. 7 Immune activation is a powerful predictor of disease progression, 8 –11 and multiple groups have suggested low levels of immune activation may similarly explain the VSP phenotype. 4,5
HIV and SIV are known to target the gastrointestinal mucosa, an area rich in CD4+CCR5+ T-lymphocytes. 12 –15 A damaged mucosal barrier during acute pathogenic infection may contribute to chronic immune activation fueled by microbial translocation. 16 SM and AGM experience increased immune activation and mucosal CD4 T cell depletion during acute infection 17 ; however, rapid induction of immunosuppressive responses prevents the generalized T cell activation characteristic of progressive infection. 18,19 Such attenuated activation may be mediated, in part, by regulatory T cells (Treg). 20 –22 Our group and others have found a significantly higher frequency of Treg and greater T cell activation in the gut of noncontrollers compared to controllers or seronegatives, 6,23,24 suggesting Treg from HIV progressors are responsive to, yet unable to limit, immune activation.
To determine whether VSP recapitulate the SM/AGM profile, we compared T cell activation in blood and rectal mucosa of VSP to typical progressors, controllers, and seronegatives. We also examined Treg frequency, number, and function and CD4+ non-Treg proliferative capacity. Surprisingly, our results indicated that VSP are characterized by increased mucosal T cell activation, low Treg numbers, and decreased CD4+ T cell proliferation ex vivo. Thus, in contrast to SM and AGM, protection in VSP appears to be mediated by a mechanism that is not reliant upon maintenance of low T cell activation.
We defined VSP as individuals with VL >10,000 copies RNA/ml, infected >7 years, with CD4+ T cell counts maintained above 500 cells/μl. These individuals were compared to progressors (VL >10,000, CD4 decline below 500 cells/μl) and controllers (VL <1,000, infected >5 years). A previous study from our group reported on mucosal Treg and immune activation in HIV controllers and progressor subjects, who were also used as comparison groups for this study 25 ; however, data and analysis of VSP subjects were not presented in the earlier report. Subjects were recruited at the UC Davis Medical Center, Sacramento, CA or San Francisco General Hospital, UC San Francisco (UCSF). Informed consent was obtained under protocols approved by the UCSF Committee on Human Subjects Research and the UC Davis Institutional Review Board.
Peripheral blood mononuclear cells (PBMCs) were isolated from whole blood using Ficoll-Hypaque (GE Healthcare, UK). Rectal biopsies were obtained by flexible sigmoidoscopy 26 and mucosal leukocytes isolated using collagenase and mechanical disruption. 25 PBMCs and rectal cells were stained with anti-CD3 (clone UCHT1; BD Pharmingen), anti-CD4 (SFCI12T4D11, Beckman Coulter, Brea, CA, or L200, BD Pharmingen), anti-CD8 (SK1 or 3B5, Invitrogen), anti-CD25 (M-A251, BD Pharmingen), anti-CD127 (hIL-7R-M21, BD Pharmingen), anti-CD38 (HIT2, BD Pharmingen), anti-programmed-death-receptor 1 (PD-1) (eBioJ105, eBioscience), and Live/Dead Fixable Aqua dead cell stain (Invitrogen, Carlsbad, CA), followed by intracellular staining with anti-FOXP3 (PCH101, eBioscience) using the FOXP3 Staining Buffer Set (eBioscience, San Diego, CA). After acquisition on an LSRII flow cytometer (BD Pharmingen), data were analyzed using FlowJo software (Tree-Star Inc., Ashland, OR).
Treg suppression assays were performed using bead-isolated CD4+CD25– non-Treg and CD4+CD25+ Treg as described previously. 25 Briefly, CFSE-stained non-Treg and irradiated, autologous PBMCs were left unstimulated or stimulated with plate-bound anti-CD3 and cultured alone or in the presence of increasing numbers of Treg for 4 days. Cultures were stained with anti-CD3, anti-CD4, anti-CD8, anti-CD25, and anti-FOXP3 and analyzed by flow cytometry. GraphPad Prism (GraphPad Software, La Jolla, CA) was used to graph and analyze data. Intergroup comparisons were analyzed using a two-tailed Mann–Whitney test. The Wilcoxon matched pairs test was used for intragroup comparisons between blood and rectal samples. p values ≤0.05 were considered significant.
We studied six VSP, eight progressors, 11 controllers, and 12 uninfected controls. The median CD4 counts were 645, 418, 728, and 793 cells/μl for VSP, progressors, controllers, and controls, respectively. The median viral loads were 28,647, 24,650, and 50 copies/ml plasma; the median numbers of years infected were 17, 12, and 19 for these same groups, respectively (Fig. 1). Three consecutive time points where the CD4 count was <500 cells/μl indicated disease progression with the exception of two progressors who had only two CD4 counts available for analysis (all of which were <400 cells/μl). Clinical data for controllers and seronegatives have been reported elsewhere. 25 All patient groups were assayed during the same time frame to eliminate potential bias due to reagent or protocol variability.
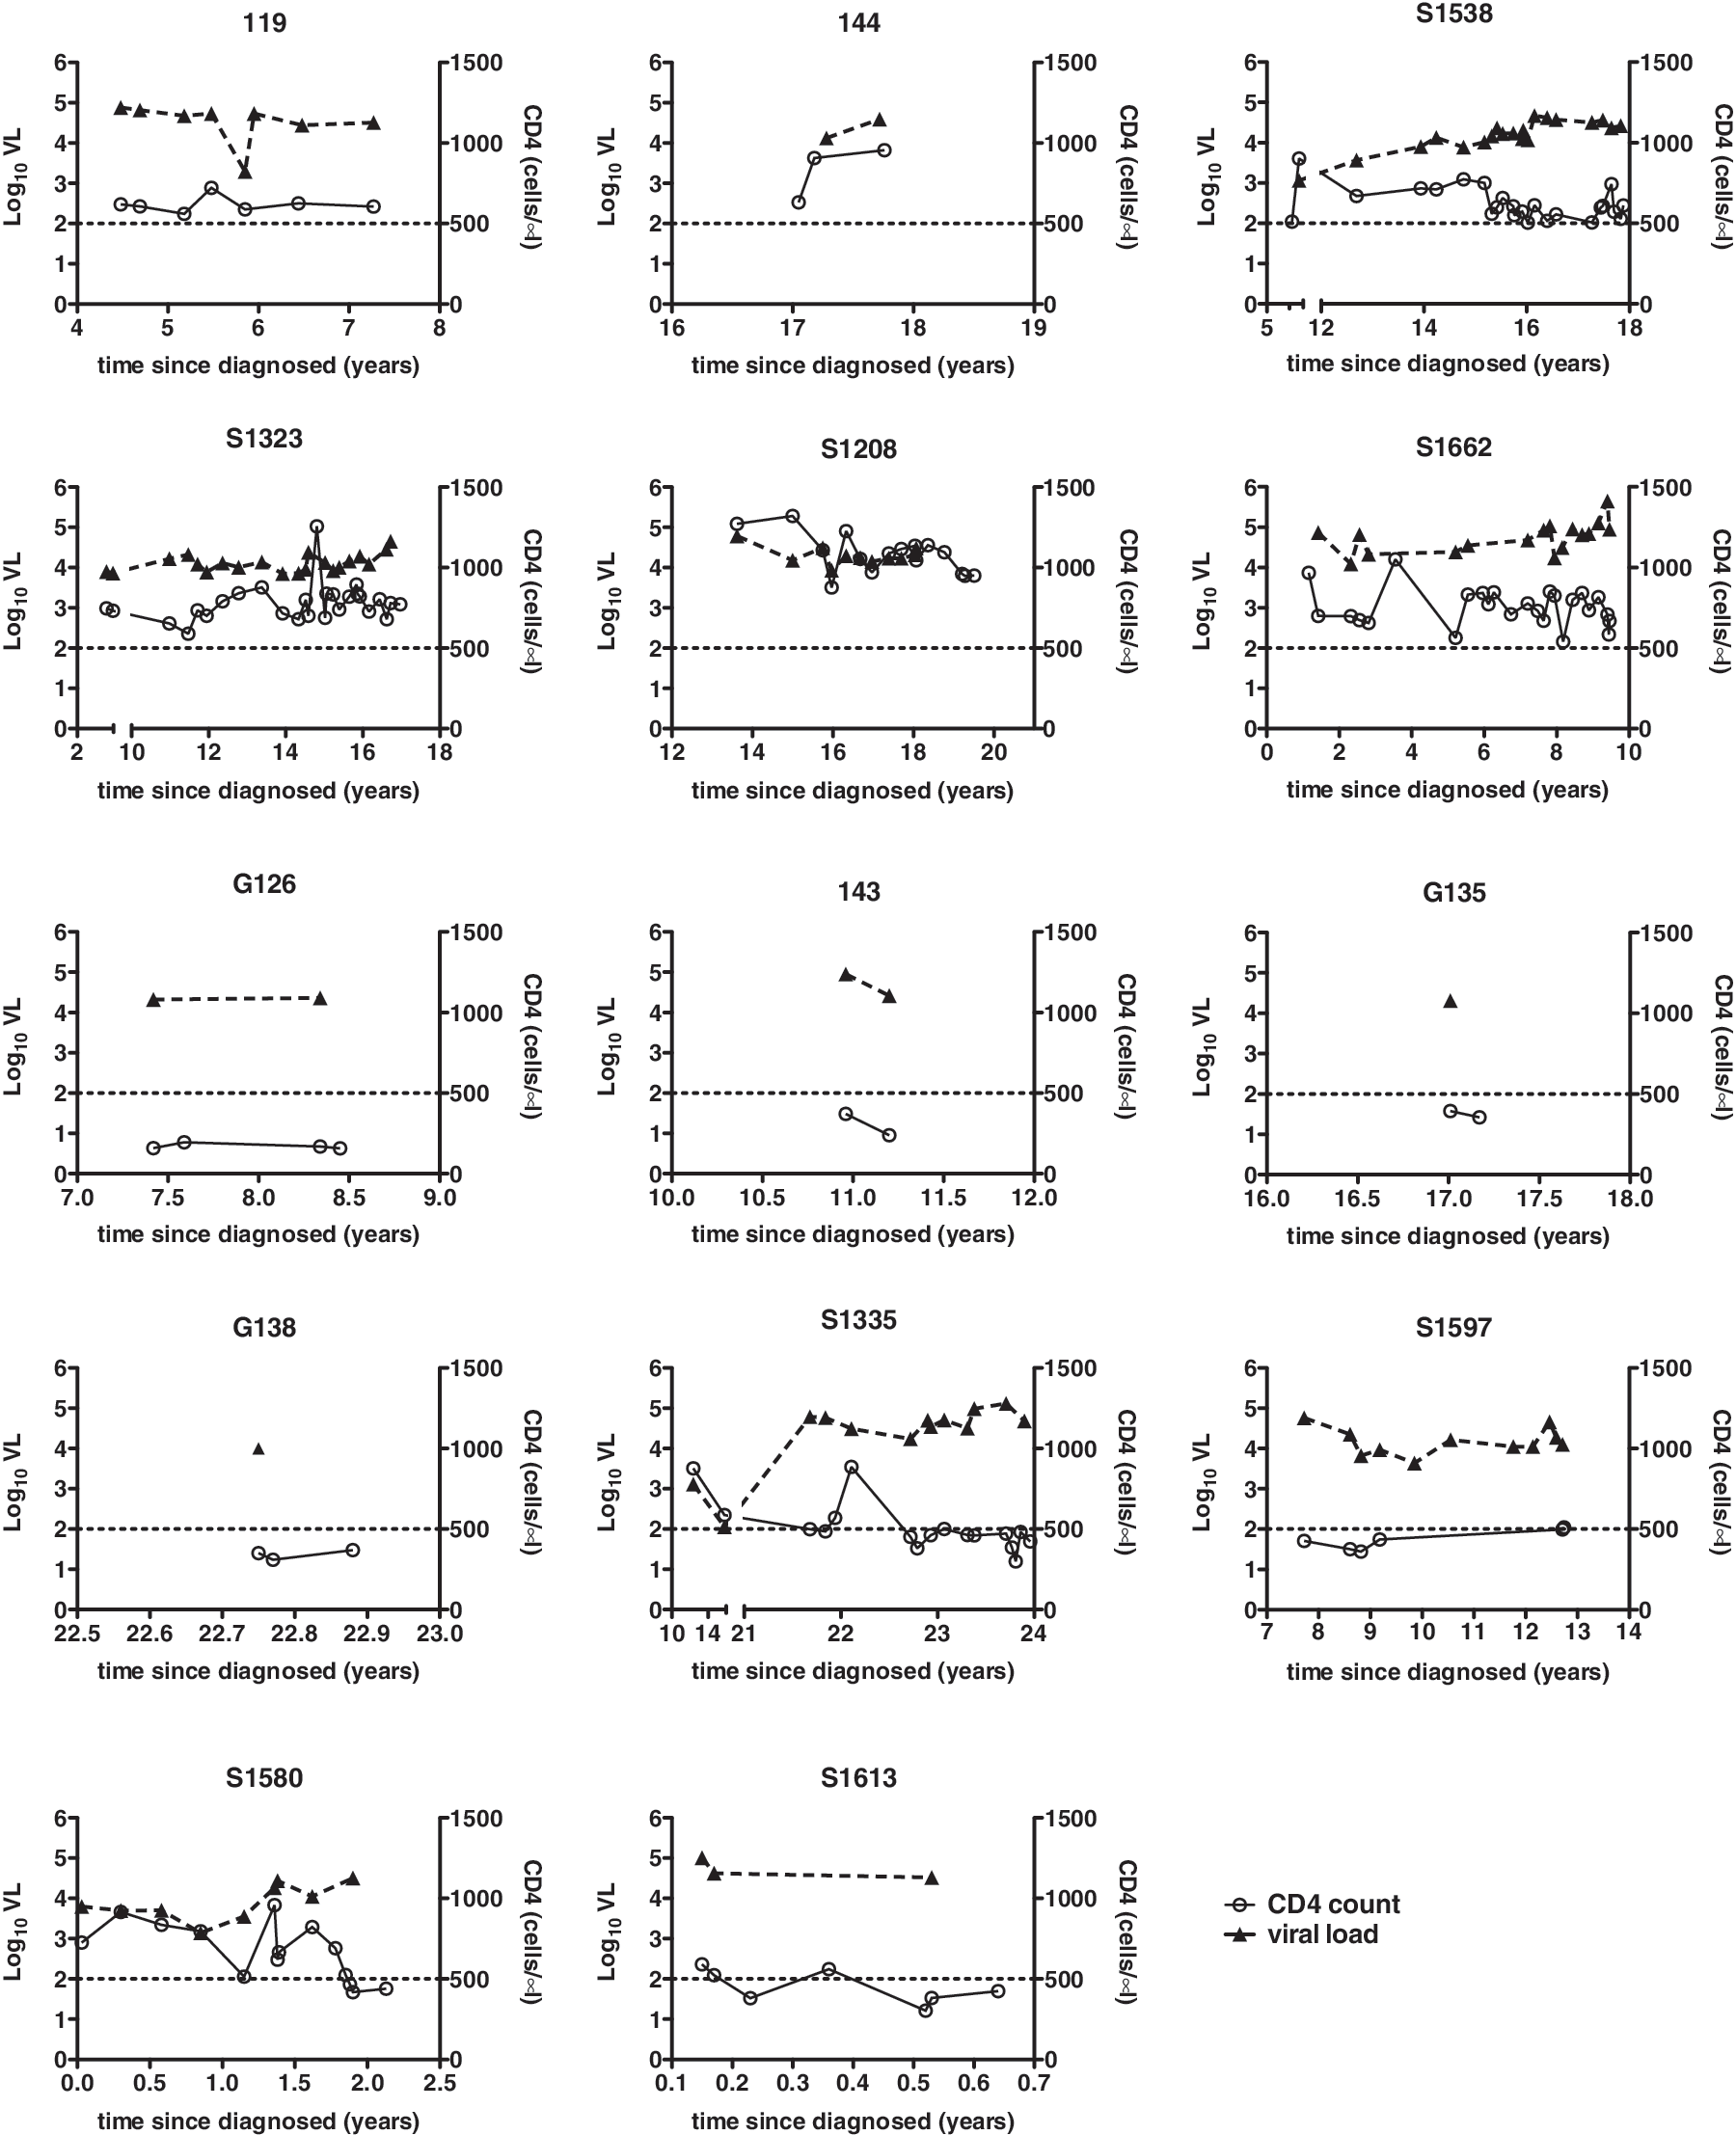
Longitudinal viral load (VL) and CD4+ T cell counts for viremic slow progressors (VSP) and progressors. Viral load (left y-axes, filled triangles, dashed lines) and CD4+ T cell counts (right y-axes, open circles, solid lines) are plotted against time since HIV+ diagnosis (x-axis) in years for VSP (upper six graphs) and progressors (lower eight graphs). The horizontal dashed line at 500 CD4 cells/μl serves as a reference point. Numbers above each graph indicate patient code numbers.
Two approaches were used to assess T cell activation: augmented CD38/PD-1 coexpression and decreased expression of CD127. 25, 27 –29 Although the combination of HLA-DR and CD38 is most commonly used to assess T cell activation in HIV disease, 10 both increased CD38/PD-1 coexpression and reduced CD127 expression have been linked to disease progression. 25,27 –29 CD4+ Treg are typically CD127–, therefore only non-Treg, defined as FOXP3–CD127– cells, were considered when analyzing the CD4+ subset for CD127 expression. In blood, progressors displayed significantly higher percentages of CD38+PD-1+ CD4+ and CD8+ T cells compared to controllers or seronegatives and a strong trend toward increased activation compared to VSP (Fig. 2A). Although VSP had lower frequencies of peripheral CD38+/PD-1+ T cells than progressors, their T cell activation was significantly elevated compared to controllers (CD8+ cells only) or seronegatives (CD4+ and CD8+ cells) (Fig. 2A). Interestingly, while no significant differences in peripheral CD4+CD127– percentages were observed, all HIV+ subjects displayed significant expansion of CD8+CD127– T cells (Fig. 2B).
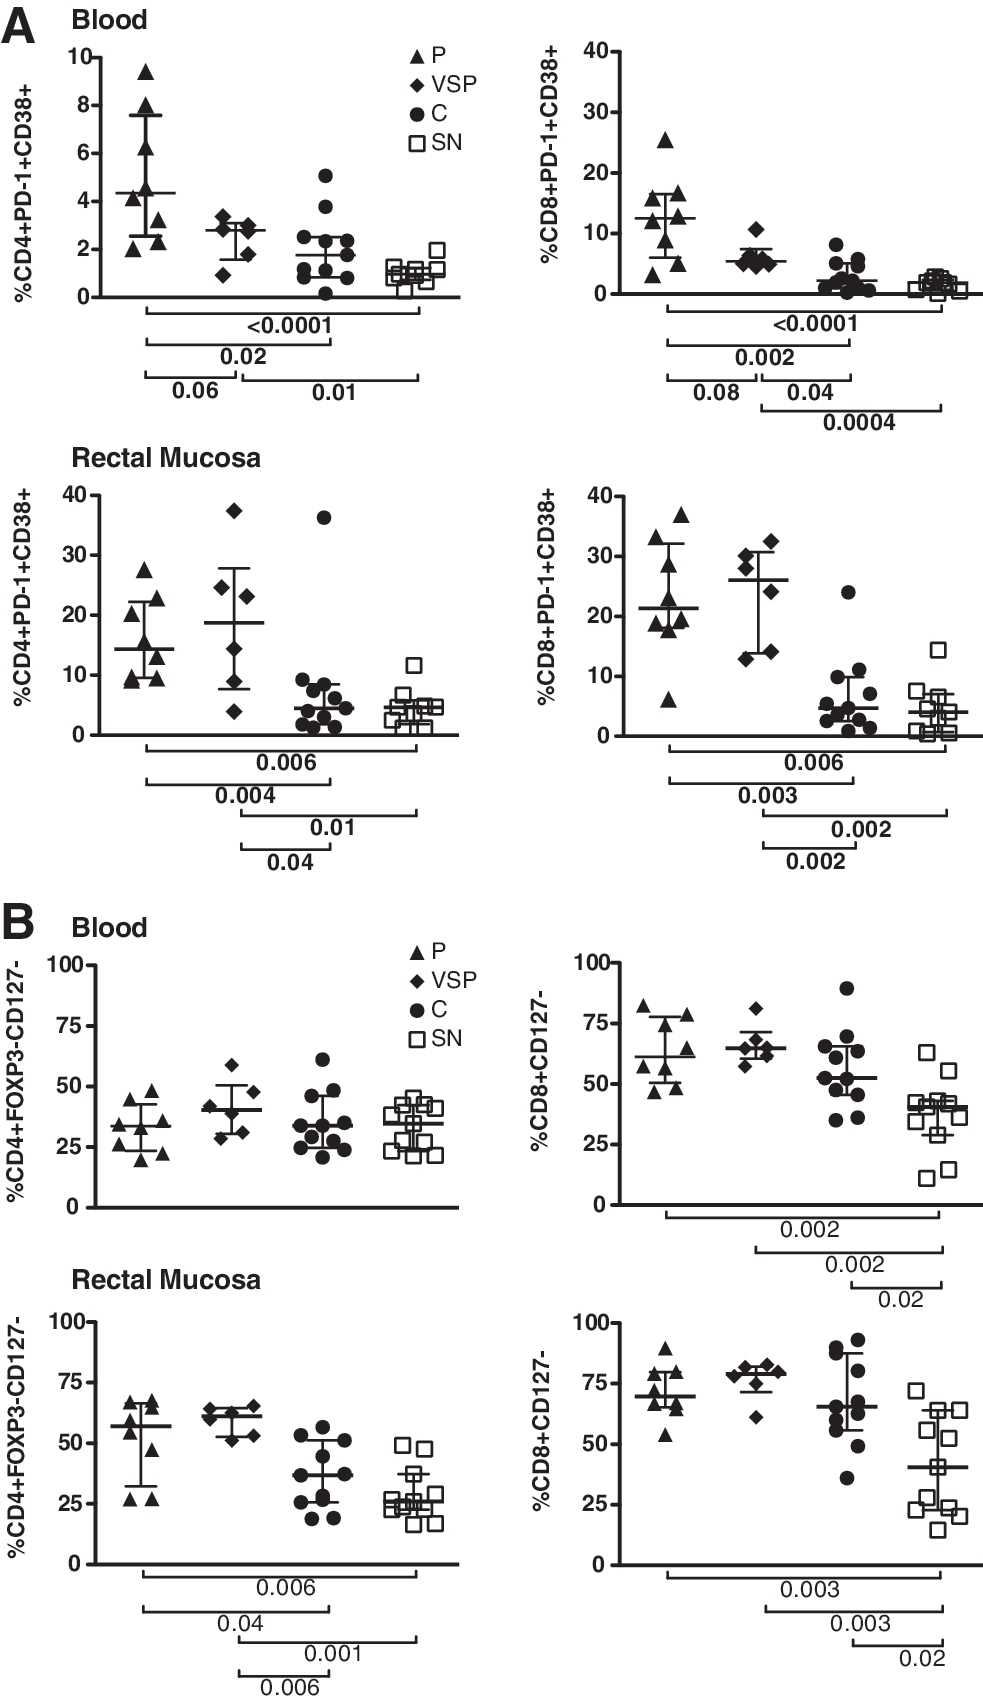

Strikingly, in rectal mucosa, CD38/PD-1 coexpression was high in progressors and VSP, with both groups demonstrating increased CD4+ and CD8+ T cell activation compared to controllers or seronegatives (Fig. 2A). Loss of CD127 expression by CD4+ T cells mirrored what was observed for CD38/PD-1 coexpression, with progressors and VSP displaying decreased CD127 compared to controllers or seronegatives. However, as in blood, the CD8+ subset again exhibited an expansion of CD127– cells within all HIV-infected groups compared to seronegatives (Fig. 2B).
In chronically infected SM, CD4+ T cell preservation closely correlates with a low frequency of circulating CD127– effector T cells and high frequency of Treg. 30 Because Treg can suppress immune activation, we hypothesized that high Treg levels might compensate for augmented T cell activation in VSP. As previously reported, 25 the frequency of Treg as a percentage of CD4+ T cells was significantly higher in mucosa of progressors compared to controllers or seronegatives; surprisingly, however, VSP did not exhibit increased mucosal Treg frequencies relative to seronegatives or HIV controllers (Fig. 2C). Indeed, VSP had the lowest mucosal ratio of Treg to CD3+ T cells of any subject group (number of CD4+FOXP3+CD25+ cells/10,000 CD3+ cells) (Fig. 2C).
To examine Treg functionality, suppression assays were performed using cells isolated from four progressors, seven controllers, four seronegatives, and four VSP; data on the first three groups were reported previously. 25 Peripheral and rectal Treg displayed similar suppressive capacity in all groups, indicating that although few in number, Treg of VSP are functionally suppressive (data not shown). Interestingly, in control cultures containing peripheral blood non-Treg alone, both VSP and controllers demonstrated reduced T cell proliferation, measured by CFSE dilution, compared to progressors or seronegatives (Fig. 2D). In rectal cell cultures, only VSP T cells were distinguished by weak proliferative responses; this effect was statistically significant compared to seronegatives (Fig. 2D).
Multiple studies have suggested that low immune activation contributes to slow HIV progression; however, our results indicate that although VSP have low levels of activated T cells in blood as compared to typical progressors, this unusual group of patients also has high levels of mucosal T cell activation. This “disconnect” between blood and mucosa in VSP was unexpected. Additionally, we observed low Treg numbers in the rectal mucosa of VSP, which may contribute to immune activation, but may also support stronger anti-HIV immune responses 31 and a preserved Treg:Th17 cell ratio. 32,33 Alternatively, it is possible that a blunted mucosal Treg response allows immune activation to persist without inhibiting normal T cell homeostasis, allowing the ongoing proliferation of CD4+ T cells despite high-level viremia.
Despite increased frequencies of CD38+PD-1+ and CD127– T cells, VSP CD4s displayed reduced CD4+ T cell proliferation when stimulated ex vivo. In agreement with this finding, decreased Ki67 expression has been described in T cells of viremic patients with long-term asymptomatic infection. 4 Additionally, low percentages of CD4+Ki67+ cells have been linked to CD4 preservation in SM. 34 While activated and effector memory cells support high levels of virus replication, limited proliferation and CCR5 expression in central memory CD4+ T cells (TCM) of SIV-infected SM may protect these cells from depletion. 7 Additional studies will be required to determine whether VSP TCM have a similar selective advantage.
The clinical significance of our findings will need to be explored in longitudinal studies. Notably, after this study was completed VSP patient S1538 began showing signs of progression, declining from 611 to 390 CD4+ cells/μl in 4 months with a concomitant increase in viral load from 26,323 to 67,431 copies/ml. This observation indicates susceptibility of some VSP to eventual disease progression.
These data present a complex picture of VSPs' ability to resist CD4+ T cell depletion despite high-level viremia. The apparent dichotomy between activation and CD4 proliferation in VSP highlights the need to better define how immune activation influences HIV progression. Further studies of VSP are warranted to elucidate how Treg, immune activation, and adaptive immune responses are related to CD4+ T cell preservation in the context of high plasma viremia. The analysis of virus isolated from VSP subjects was beyond the scope of the present study; however, it will also be critical to determine whether virologic features contribute to the VSP phenotype.
Footnotes
Acknowledgments
This research was supported by NIH/NIAID R01-AI057020 to B.L.S.; the SCOPE cohort was supported in part by NIH/NIAID (R01-AI087145, K24-AI069994), the UCSF CFAR (P01-AI027763), the UCSF CTSI (UL1-RR024131), the Cleveland Immunopathogenesis Consortium (R01-AI076174), and CFAR Network of Integrated Systems (R24-AI067039). This investigation was conducted in a facility constructed with support from the Research Facilities Improvement Program (Grant C06-RR012088) to UC Davis from NIH/NCRR. The LSR-II violet laser was upgraded with funding from the James B. Pendleton Charitable Trust.
The authors thank the study volunteers for their willingness to participate in this research. We also thank Becky Hoh, Lee Gilman, the clinical staff at San Francisco General Hospital, and the SCOPE study for their assistance with patient recruitment and clinical procedures.
S.G.D., P.W.H., J.M.S., and B.L.S. conceived the study. J.M.S. performed experiments and analyzed data. J.W.C. assisted with assay development. S.G.D., D.H.M., J.C.G., P.W.H., R.B.P., and M.S. provided patient samples. J.M.S. and B.L.S. wrote the manuscript. All authors reviewed and edited the manuscript.
Author Disclosure Statement
No competing financial interests exist.