
Abstract
In early infection HIV-1 generally uses the CCR5 coreceptor. During disease progression the coreceptor use switches to include CXCR4 in approximately 70% of infected individuals. The primary determinant for coreceptor use is located in the V3 loop of the viral envelope. Here, ultradeep pyrosequencing (UDPS) of the V3 loop was used to investigate if CXCR4-using (X4) virus may be present as a minority population during primary HIV infection (PHI). Three patients with HIV populations that switched coreceptor use, as determined by the MT-2 cell culture assay, were investigated. Longitudinally collected plasma samples (four to nine samples per patient) obtained from PHI until after coreceptor switch were analyzed by UDPS of the V3 loop. From each sample between 279 and 32,094 reads were generated based on template molecule availability. UDPS analysis showed that the X4 virus that emerged after switch was not present during PHI or prior to overt phenotypic switch. In addition, the phylogenetic analyses indicated that the X4 populations originated from R5 variants that had evolved after the previous R5-only sample was obtained. Finally, one to three major variants were found during PHI, supporting the idea that infection is established with one or just a few viral particles.
Introduction
T
Materials and Methods
Samples
Three patients with HIV populations that switched coreceptor use to include CXCR4 during infection were retrospectively selected and four to nine samples from each patient were investigated. For patients 1 and 2 the first sample was obtained during early PHI when HIV-1 antibody tests were negative and HIV-1 RNA tests were positive, which is consistent with classification into Fiebig stage II. 16 Patient 3 was classified into Fiebig stage IV–V based on a positive ELISA antibody test and an incomplete Western blot profile that lacked a p31 band.
Ultradeep pyrosequencing (UDPS)
UDPS was performed essentially as previously described.
15,17
Briefly, RNA was extracted from 1 ml plasma using the RNeasy Lipid Tissue Mini Kit (Qiagen, Hilden, Germany) and the QIAvac 24 vacuum minifold protocol (Qiagen, Hilden, Germany). To maximize the sequence depth, care was taken to ensure that all available RNA template molecules were carried through until UDPS. The total volume of extracted viral RNA (40 μl) was divided into five aliquots and reverse transcribed using the gene-specific primer JA170 and Thermoscript (Invitrogen, Carlsbad, CA) according to the manufacturer's instructions. The cDNA was pooled and divided into 18 aliquots and amplified by a nested polymerase chain reaction (PCR) using outer primers JA170 and JA167 and the Fast Start High Fidelity System (Roche, Penzberg, Germany). The amplicons from the outer PCRs were pooled and then amplified with inner primers MM_V3_fw and MM_V3_rev (for details on primers see Supplementary Table S1; Supplementary Data are available online at
Data cleaning and determination of UDPS error frequency
Previously developed software was used for data cleaning 15,17 (Brodin et al., unpublished observations). Reads from each individual sample were first identified using the sample-specific sequence tags in the primers (see Supplementary Table S1). Next, the data were cleaned by scripts that removed reads containing ambiguous bases (Ns) and reads with less than 70% similarity to the corresponding Sanger sequence. The remaining reads were imported into the GS amplicon software (Roche, Penzberg, Germany) and aligned. The alignment was extracted and the amount of data was compressed by scripts that identified unique sequence variants. The tally for each variant was retained with the sequence name for further analyses. The sequences were cut to the region of interest (V3 region, position 7137–7242 in HxB2, GenBank accession number K03455) and gaps were removed. Since UDPS errors are known to be concentrated to homopolymeric regions, reads with out-of-frame insertions or deletions were removed. Finally, the alignments were manually inspected and any remaining variants with frameshifts or stop codons were removed. Finally, we removed sequence variants that were represented by single reads, i.e., not reproduced, because such reads are less likely to be authentic than more abundant reads. 17
The UDPS error rate was determined by sequencing of the same genetic region of the BaL plasmid clone (GenBank no. AY713409), which was diluted to one copy and then PCR amplified and UDPS sequenced as described above. The average error rate per nucleotide in the cleaned UDPS data from both the FLX and the GS junior platforms was found to be approximately 0.05%.
Phenotypic coreceptor tropism testing and genotypic coreceptor prediction
For a majority of samples the coreceptor phenotype of the virus had been determined by the MT-2 cell culture assays 5 on virus that had been isolated from peripheral blood mononuclear cells at the time of collection of the blood samples. 6,19 The sensitivity for the detection of minor CXCR4-using variants by the MT-2 assay has been shown to be comparable to the enhanced Trofile assay, i.e., approximately 0.3%. 11,20 The coreceptor use of each individual V3 sequence was predicted using the bioinformatic algorithms Geno2Pheno[coreceptor] 21 and PSSMx4/r5. 22 Variants were considered to have an X4 genotype if Geno2Pheno predicted an X4 phenotype using a false positive rate (FPR) of 2.0% and a PSSM score greater than −2.88. Other cutoffs for Geno2Pheno were also evaluated and the 2.0% cutoff was chosen because it gave the highest agreement with PSSM predictions on our data.
Phylogenetic analysis
To analyze the evolutionary relationship of the sequence variants, maximum likelihood trees were constructed using PhyML 3.0 23 and the best-fit model of nucleotide substitution as identified by jModelTest. 24 Branch support was evaluated using the approximate log likelihood ratio test (aLRT), 25 which is implemented in PhyML. A branch was considered significantly supported if aLRT ≥0.95, which means that the likelihood for the existence of the branch is 0.95. Pairwise distances were computed in MEGA 4 26 using the Tamura-Nei model with gamma distributed rates across sites (gamma parameter 0.5). The average genetic distance per sample was calculated using an in-house script that weighted sequence variants according to their abundance and genetic distances.
Ethical statement
The study was approved by Regional Ethical Review board in Stockholm, Sweden (Dnr 52/2008-77). Patients participating in this study gave written informed consent.
Results
Sequence analysis and phylogenies
Nineteen samples from three individuals whose virus switched coreceptor use during the course of the disease were investigated (Table 1). The study was retrospective and the samples were collected between 1988 and 1996, which means that almost all samples were collected before the advent of modern combination antiretroviral therapy and the introduction of plasma HIV-1 RNA quantification. In fact, most samples were collected prior to any antiretroviral therapy.
Coreceptor use as tested by the MT-2 assay.
Numbers are sequence reads that remained after data cleaning.
AZT treatment was started on this day, but was stopped already after 5 months.
Viral load measurements were done on stored samples that were diluted.
Viral load measurements were done at the time of sampling.
AZT, zidovudine; ddI, didanosine; 3TC, lamivudine; IDV, indinavir; nd, not detected; na, not available.
Following data cleaning, which removed on average 15.4% of the raw sequence reads per sample, a total of 218,993 reads remained for analysis (range 279–32,094 per sample) (Table 1). None of the three patients had detectable levels of X4 variants during PHI according to the genotypic predictions of coreceptor use. In fact, no X4 variants were detected before the coreceptor switch had been documented by the MT-2 assay in any of the patients. The last R5-only samples were obtained 27, 20, and 17 months before the switch in patients 1, 2, and 3, respectively. Thus, our data indicate that the X4 variants evolved sometime after these time points.
In all three patients the phylogenetic trees showed that one to several statistically supported X4 clusters were present at the time of coreceptor switch (Figs. 1 –3). These X4 variants displayed 6–11 amino acid substitutions compared to the R5 variant(s) found at PHI. The trees also indicated that the X4 populations originated from R5 variants that had evolved after the previous R5-only sample was obtained. In patients 1 and 2 the R5 variants that were phylogenetically most closely related the X4 variants appeared to be transition stages on the path toward X4 use, because these R5 variants had some, but not all, of the amino acid substitutions that characterized the X4 variants. However, no clear common pattern in the transition from R5 to X4 use could be discerned. Thus, each patient displayed individual mutational pathways. The Geno2Pheno and PSSM algorithms gave concordant coreceptor predictions for almost all reads (218,889 of 218,993 reads; 99.95 %). Discordant predictions were observed for 13 variants (involving 77 of 92,475 reads) from patient 2 and 13 variants (involving 27 of 38,535 reads) from patient 3 (Figs. 2 and 3).

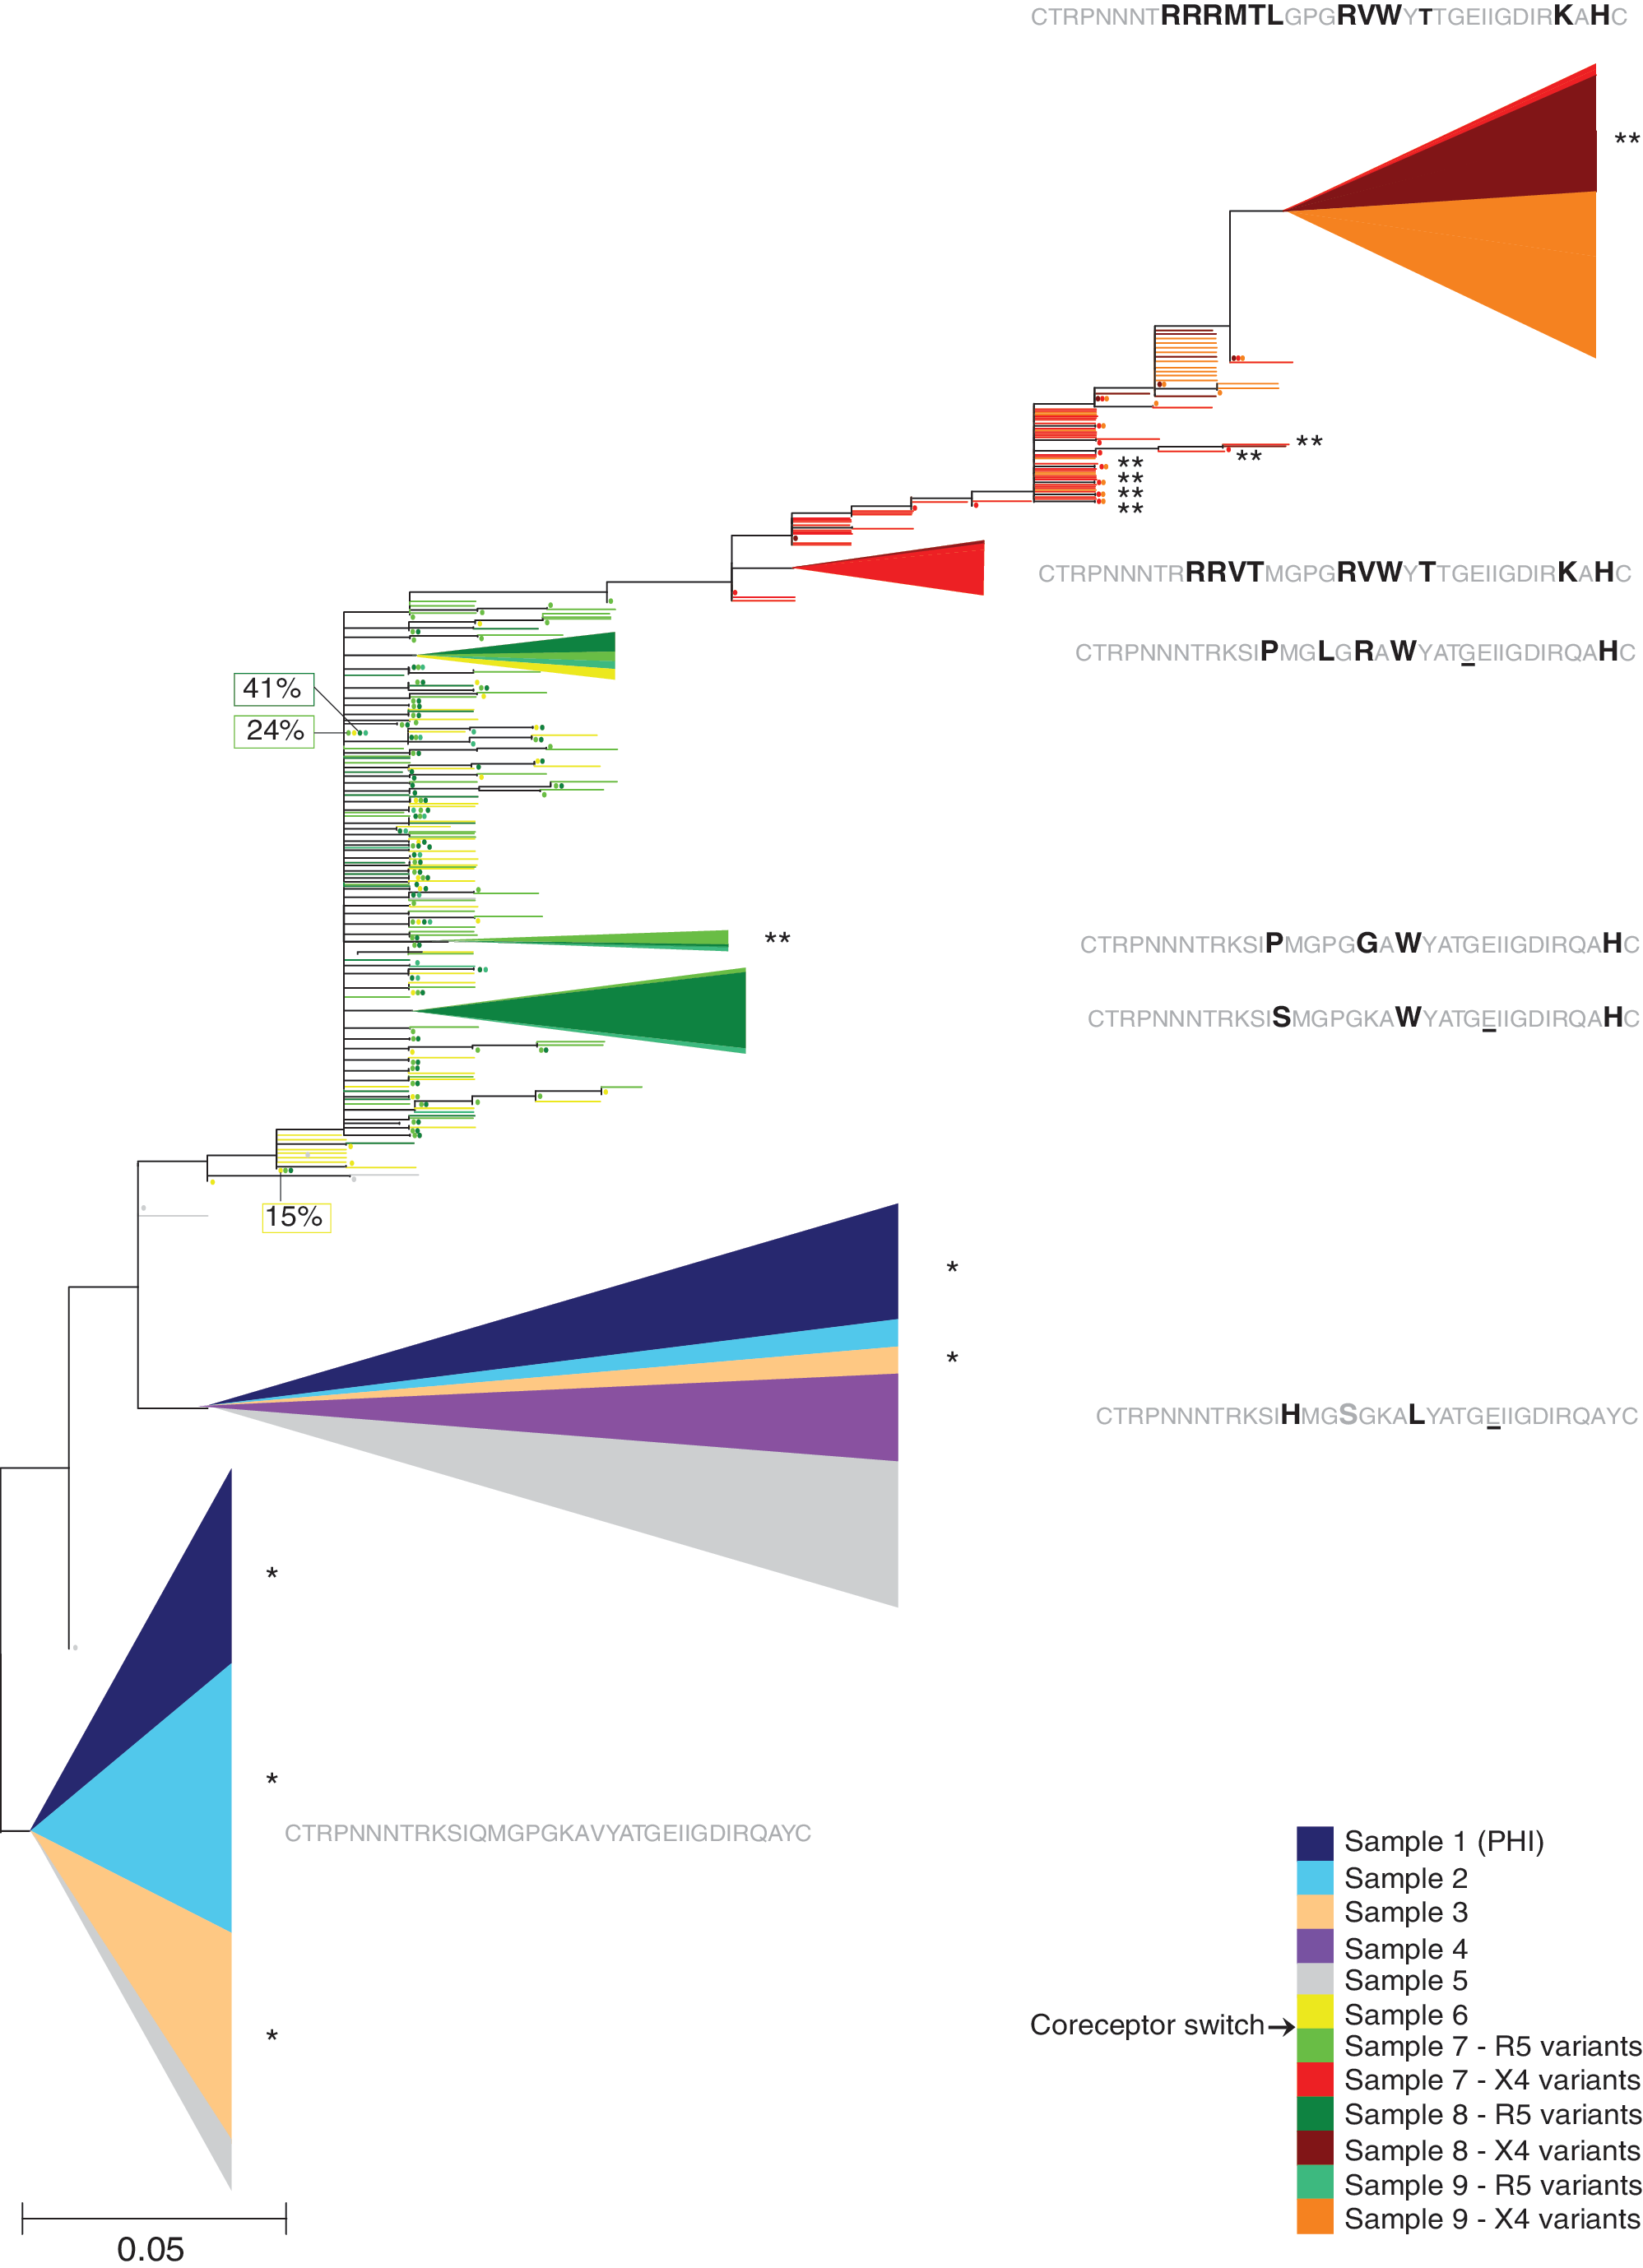
Maximum likelihood phylogenetic tree of V3 nucleotide sequences from patient 1. Clusters contained at least 10 variants and were statistically supported [approximate log likelihood ratio test (aLRT) value >0.95]. The vertical size of the clusters is proportional to the number of reads in the cluster, the colored sectors are proportional to the weighted number of reads from different time points in the cluster, and the horizontal size of the clusters shows their maximum genetic depth. The abundance (in %) of the most abundant variant in each sample, if not a part of a cluster, is also indicated. The amino acid sequence of the most common variant in each cluster is shown. Differences from the most common variant in the first sample, which was obtained during primary HIV infection (PHI), are shown in bold, similarities are shown in gray, and positions containing synonymous mutations are underlined.
Maximum likelihood phylogenetic tree of V3 nucleotide sequences from patient 2. Clusters contained at least 10 variants and were statistically supported (aLRT value >0.95). The vertical size of the clusters is proportional to the number of reads in the cluster, the colored sectors are proportional to the weighted number of reads from different time points in the cluster, and the horizontal size of the clusters shows their maximum genetic depth. The abundance (in %) of the most abundant variant in each sample, if not a part of a cluster, is also indicated. The amino acid sequence of the most common variant in each cluster is shown. Differences from the most common variant in the first sample, which was obtained during PHI, are shown in bold, similarities are shown in gray, and positions containing synonymous mutations are underlined. *Denotes that one variant was predicted as R5 by Geno2Pheno and X4 by PSSM. **Denotes that one variant was predicted as X4 by Geno2Pheno and R5 by PSSM.

Maximum likelihood phylogenetic tree of V3 nucleotide sequences from patient 3. Clusters contained at least five variants and were statistically supported (aLRT value >0.95). The vertical size of the clusters is proportional to the number of reads in the cluster, the colored sectors are proportional to the weighted number of reads from different time points in the cluster, and the horizontal size of the clusters shows their maximum genetic depth. The abundance (in %) of the most abundant variant in each sample, if not a part of a cluster, is also indicated. The amino acid sequence of the most common variant in each cluster is shown. Differences from the most common variant in the first sample, which was obtained during PHI, are shown in bold, similarities are shown in gray, and positions containing synonymous mutations are underlined. *Denotes that one variant was predicted as R5 by Geno2Pheno and X4 by PSSM.
In two of the patients (patient 1 and patient 2), the proportion of X4 variants increased after the switch (Table 1). In patient 1, the proportion of X4 variants increased from 25% at the first detection of coreceptor switch to 83% 10 months after switch and in patient 2 the proportion increased from 16% to 40% over a period of 1.5 years. In contrast, in patient 3, the X4 population decreased from 26% to 3% over a period of 3 months. Furthermore, one to several novel and statistically supported R5 clusters were found in the samples analyzed after coreceptor switch, indicating that X4 and R5 variants coexisted and coevolved after the switch (Figs. 1 –3). In patient 3, some of the R5 variants found after the switch intermingled with R5 variants found before the switch (Fig. 3).
Virus populations during primary HIV infection
In all three patients the virus population during PHI was dominated by one or a few viral variants. In patient 1, who was sampled in Fiebig stage II, we observed one major variant that represented 96% of the viral population. The remaining 4% of the virus population consisted of 118 minor sequence variants with one or two randomly distributed nucleotide differences compared to the dominating variant. The most abundant of these minority variants constituted 0.17% of the virus population. As discussed further below, these findings suggest that the infection was established by one founder virus. Patient 3, who was sampled in Fiebig stage IV–V, also appeared to have been infected by a single virus variant. One major virus variant constituting 95% of the virus population was found during PHI. The remaining minor variants (n=116) had one or at most two randomly distributed nucleotide differences compared to the dominating variant. The most abundant of these minority variants constituted 0.19% of the virus population. In contrast, the infection in patient 2 appeared to have been established by two, or possibly three, virus variants. In this patient, who was sampled in Fiebig stage II, we found three major variants, representing 47%, 37%, and 10% of the virus population. The second most abundant variant (37%) differed by four nucleotides (two transitions and two transversions) from the most abundant variant, suggesting that both variants were part of the inoculum. The third variant (10%) differed by only one transition from the second variant, which makes it difficult to judge whether it was part of the inoculum or evolved soon after infection. The major variant(s) found during PHI in the three patients continued to constitute a majority of the virus population during the first part of infection (16 months, 6 months, and 9 months for patient 1, 2, and 3, respectively), but their abundance changed gradually over time.
Genetic diversity
The genetic diversity was relatively low during PHI in all three patients. For patients 1 and 3 the average genetic distances were 1.1% whereas for patient 2 the virus population had an average genetic distance of 3.2% (Table 1). In patient 1, a significant increase of viral diversity was seen over time (Pearson's r=0.98, p-value=0.015), which is in line with other studies. 27 However, in patient 2, a significant decline in viral diversity was observed in the four samples taken up to 6 months after the first sample (Pearson's r=–0.99, p-value=0.0097). The decline in diversity was due to a change in the proportions between the three major variants found during PHI, where the variant with four nucleotide differences relative to the major variant declined in frequency over time. In patient 3, the average genetic distance was low in both samples taken before the switch. After the switch, the average genetic distance was high in all patients, ranging from 6.4% to 9.2% (Table 1), which is consistent with the finding that genetically distinct X4 and R5 variants coexisted. In subsequent samples taken after the switch, a decrease in the average genetic diversity was seen in all patients.
Discussion
Despite intense research the origin and emergence of X4 viruses remain poorly understood. In this study we investigated if X4 viruses were already present as minority variants during PHI in patients with HIV populations that later switched coreceptor use. We found no evidence for such an early presence of X4 viruses. Thus, the X4 variants that emerged during switch were not present during PHI. In fact, in no case were X4 variants detected before coreceptor switch, which was documented by the MT-2 assay. The preceding (R5-only) samples were obtained 17–27 months prior to the switch, which indicates that the coreceptor switch occurred within this time frame. This agrees with recent findings by Bunnik et al. 11 who studied eight patients and reported that X4 variants usually evolved gradually during a 12-month period prior to overt coreceptor switch. Poon et al. 28 recently performed extended bioinformatic analyses on these data and predicted that the X4 variants appeared a mean of 10.1 (range 4.6–24.7) months before such variants were detected by the MT-2 assay.
Several recent studies have indicated that most HIV-1 infections are established by one or a small number of infectious viral particles. 2,13,14 Our data support these findings since the virus populations during PHI were dominated by 1, 1 and 2, or 3 viral variants, respectively. In addition, minority variants, which constituted at most 0.19 % of the virus populations, differed by only one or two nucleotides from the dominating founder variant(s). These mutations were stochastically distributed, which indicates that they represent early evolution during the first weeks of infection and/or errors induced during cDNA synthesis, PCR amplification, and sequencing.
Phylogenetic analyses showed that distinct R5 and X4 clusters were present after the switch in all patients. In two of the patients X4 variants appeared to have emerged from recently evolved R5 populations generating two or more statistically supported X4 clusters, which also supports the notion that the R5 to X4 switch usually takes place during a time period of 1–2 years as indicated by Bunnik et al. and Poon et al. 11,28 The X4 variants displayed several amino acid substitutions compared to the founder variants observed during PHI. Like Bunnik et al. and Poon et al., 11,28 we also observed R5 variants that appeared to be transition stages toward X4 use. In patients no. 1 and no. 2 the proportion of X4 variants gradually increased following the coreceptor switch, which also is in line with findings of Bunnik et al. 11 In contrast, the proportion of X4 variants decreased in patient no. 3. This was the only one of our patients who was receiving antiretroviral therapy (monotherapy with azidothymidine) at the time of the coreceptor switch. It is possible that the decrease in proportion of X4 variants was due to positive selection of an R5 variant that had acquired azidothymidine resistance, but we have no linked resistance data to support or refute this hypothesis.
The genetic diversity has been shown to be low during PHI, but gradually increasing during the asymptomatic course of infection. 27,29 –31 The viral diversity during PHI in our study was 1.1–3.2%, which is within the upper range of what has been reported before where the median viral diversity was 0.39% (range 0.04–3.23%). 29 At the switch, the average genetic distance was high in all patients and subsequently decreased in samples taken later after the switch, which has also been reported before. 27 However, it is difficult to make exact comparisons between genetic diversities between our study and earlier studies since different sequence methodologies have been used and different regions of the HIV-1 genome were investigated.
One limitation of this study is that the results may not be generalizable because we studied only three patients who had all rapidly progressing immunodeficiency. The fact that the patients had symptomatic PHI makes them “atypical” because such patients are known to have more rapid disease progression than patient who seroconvert without symptoms. 32
To conclude, our UDPS analysis showed that X4 variants that emerged after coreceptor switch were not present during PHI and that the X4 populations most probably evolved from the R5 populations during the course of infection rather than having been transmitted as minority populations.
Footnotes
Acknowledgments
We thank Emilie Hultin, Sara Arroyo Mühr, and Carina Eklund for exceptional guidance and support during the 454 junior titanium experiments. We thank Eva C. Ericsson and Kajsa Aperia for excellent technical assistance.
Author Disclosure Statement
No competing financial interests exist.
References
Supplementary Material
Please find the following supplemental material available below.
For Open Access articles published under a Creative Commons License, all supplemental material carries the same license as the article it is associated with.
For non-Open Access articles published, all supplemental material carries a non-exclusive license, and permission requests for re-use of supplemental material or any part of supplemental material shall be sent directly to the copyright owner as specified in the copyright notice associated with the article.