
Abstract
Laboratory cross-sectional assays are useful for the estimation of HIV incidence, but are known to misclassify individuals with long-standing infection as recently infected. The false recent rate (FRR) varies widely across geographic areas; therefore, accurate estimates of HIV incidence require a locally defined FRR. We determined FRR for Botswana, where HIV-1 subtype C infection is predominant, using the BED capture enzyme immunoassay (BED), a Bio-Rad Avidity Index (BAI) assay (a modification of the Bio-Rad HIV1/2+O EIA), and two multiassay algorithms (MAA) that included clinical data. To estimate FRR, stored blood samples from 512 antiretroviral (ARV)-naive HIV-1 subtype C-infected individuals from a prospective cohort in Botswana were tested at 18–24 months postenrollment. The following FRR mean (95% CI) values were obtained: BED 6.05% (4.15–8.48), BAI 5.57% (3.70–8.0), BED-BAI 2.25% (1.13–4.0), and a combination of BED-BAI with CD4 (>200) and viral load (>400) threshold 1.43% (0.58–2.93). The interassay agreement between BED and BAI was 92.8% (95% CI, 90.1–94.5) for recent/long-term classification. Misclassification was associated with viral suppression for BED [adjusted OR (aOR) 10.31; p=0.008], BAI [aOR 9.72; p=0.019], and MAA1 [aOR 16.6; p=0.006]. Employing MAA can reduce FRR to <2%. A local FRR can improve cross-sectional HIV incidence estimates.
Introduction
Estimation of HIV incidence is important for monitoring the dynamics of the HIV/AIDS epidemic and for the evaluation of public health intervention measures. 1,2 HIV incidence can be estimated with longitudinal cohorts, laboratory assays on cross-sectional specimens, and mathematical modeling. Prospective longitudinal cohorts traditionally represent a “gold standard” for incidence measurements. However, this approach is time consuming, cost intensive, may not represent larger populations, and may be susceptible to selection and observational biases. 3 –5 Biomarkers associated with recent HIV infection 6 –9 can be used for cost-effective and rapid cross-sectional estimation of HIV incidence. 3,10 In addition, mathematical modeling is evolving as a promising tool for the estimation of HIV incidence, although models depend on a number of assumptions, require accurate data on changes in HIV prevalence over time, and are difficult to validate. 11,12
The pitfalls of using laboratory assays on cross-sectional specimens to estimate HIV incidence are well documented. 9 The most commonly used laboratory methods for the estimation of HIV incidence are the BED capture enzyme immunoassay (BED-CEIA, abbreviated as BED in this article) and the immunoassay-based assessment of anti-HIV antibody avidity. These approaches usually overestimate HIV incidence within a population, as compared to the HIV incidence measured in the longitudinal cohorts in the same population, 3,13 –20 usually due to misclassification of long-term infected individuals as recently infected. In the estimation of HIV incidence the proportion of misclassified individuals is usually called ɛ (epsilon), or the false recent rate (FRR). 21,22 FRR may vary depending on HIV-1 subtype and local host genetic factors, and the range of FRRs had been reported from 0.0169 in rural South Africa, to 0.052 in Zimbabwe, and to 0.149 in Uganda. 13,15,18,22,23 It is likely that FRR also depends on the phase of the HIV/AIDS epidemic, degree of immunosuppression, treatment with antiretrovirals (ARV), and other unidentified factors. 19,24,25
Several strategies have been developed to reduce, or adjust for, assay misclassification. These include assessment of CD4+ T cell counts and viral load, testing history, antiretroviral therapy (ART) status, and use of testing algorithms that utilize multiple assays. 10,13,20,21,26 While these approaches have improved the assays' performance, using nonlocal estimates of FRR in some populations has been shown to be inappropriate, 23 necessitating the development of country-specific FRR estimates for a more reliable estimation of HIV incidence. Recent studies have shown that a combination of assays, such as BED and avidity index-based assays, along with available clinical information, increases the accuracy of HIV incidence estimates. 27,28 The use of serological tests, accompanied by relevant epidemiological and clinical information, is known as the HIV Recent Infection Testing Algorithm, or HIV RITA. 20
Studies are ongoing to further refine RITAs and to achieve a more accurate estimate of HIV incidence, especially in resource-limited settings. 8,20,29 The aim of this study was to estimate FRR in Botswana, which is critical for the reliable estimation and monitoring of HIV incidence. In this study, FRRs were determined for the BED assay and a Bio-Rad Avidity Index Assay (using Bio-Rad HIV ½+O EIA, referred to as BAI in this article), and several multiassay algorithms (MAA), combined with relevant clinical data.
Materials and Methods
Deidentified residual samples from 512 treatment-naive subjects who participated in 3–5 year observational HIV-1 subtype C disease progression studies in Botswana were used in estimating FRR. A total of 395 stored samples were from subjects enrolled in an observational HIV-1 subtype C disease progression study (Botosogo study), 30 and 117 subjects from the placebo arm of a randomized, multifactorial, double-blind placebo-controlled clinical trial (Dikotlana) 31,32 were included in this analysis. All individuals were HIV positive and ARV naive with a recent CD4+ cell count ≥350/mm3 with no AIDS-defining illness at the time of study enrollment. Approval for use of deidentified samples was obtained from the Health Research and Development Unit (HRDC) of the Ministry of Health Botswana and the Harvard School of Public Health Office of Human Research Administration (OHRA). Only samples from patients who consented to have their samples used for further research were included. HIV status was determined in the parent studies using a parallel enzyme-linked immunoassay (EIA) as per the Botswana national HIV testing algorithm. Data on viral load, CD4+ T cell count, and the presence of opportunistic infections at any time point or other illnesses were collected in the parent studies.
At enrollment, subjects were HIV positive and ARV treatment naive, had a CD4+ T cell count ≥350/mm3, and had no AIDS-defining illness. The subjects were followed up quarterly for up to 60 months, depending on time of patient enrollment, with an extra visit 1 month after enrollment. All subjects were Botswana nationals. The mean age of the study participants was 34.8 years old, ranging from 20 to 64 years old. Approximately 8.6% of participants were virologically suppressed at 18–24 months postenrollment (Table 1). There were 10 pregnancies (1.95% of patients) in the first 24 months of patient follow-up.
Characteristics of Study Subjects at 18–24 Months Postenrollment
CI, confidence interval; IQR, interquartile range; VL, viral load.
HIV incidence immunoassays were used to determine the recency status of blood specimens collected at either the 18-month or 24-month postenrollment, depending on sample availability. Two HIV incidence immunoassays, the Calypte Aware BED HIV-1 Incidence Test (Calypte Biomedical Corporation, Portland, OR) and the Bio-Rad Avidity Index (BAI) assay based on the BioRad HIV1/2+O ELISA (Bio-Rad Laboratories, Redmond, WA), were used. The BED assay was performed according to the manufacturer's recommendations using a standard cut-off of 0.8 normalized optical density (ODn) for the classification of recent and long-term infections. 33
The BAI assay was performed, with modifications as previously described, 34 by comparing the optical density of each sample with the optical density obtained when the well was treated with diethylamine (DEA) to induce antibody disassociation using a cut-off of 40% avidity index. 35 In brief, in the BAI assay, samples were diluted 1:10 in duplicate and were incubated at 4°C for 60 min. Following the 60-min incubation plates were washed using the standard kit wash reagents. Samples were then incubated for 30 min at 37°C with or without the chaotropic agent, diethylamine (DEA). Following the DEA/wash buffer incubation, plates were washed a total of six times; 400 μl of wash buffer was used per well with a 40-s soak between washes. The rest of the assay was conducted as per Bio-Rad HIV-1/HIV-2 plus O manufacturer's instructions. The plates were read using a 450-nm filter with 630 nm as reference. For each sample, the avidity index was calculated as (optical density of the DEA-treated well)/(optical density of the nontreated well)×100. A total of 512 samples were available for the BED assay, while only a subset of 488 samples with remaining adequate volume was tested with the BAI assay.
Initial screening with the BED assay was performed on specimens collected at 18–24 months postenrollment. To explore the kinetics of BED ODn, specimens with ODn values <1.2 were selected for further analysis. To evaluate the kinetics of anti-HIV-1 IgG antibodies, all available specimens collected in the parent studies from subjects with ODn <1.2 at 18–24 months were tested with BED. A higher cut-off was selected in order to study the kinetics for patients who may have crossed the traditional cut-off at some time point close to the 18–24 month sampling time point. Baseline samples from patients with ODn <1.2 at 18–24 months were analyzed with the GS HIV-1 Western Blot (Bio–Rad Laboratories, Redmond, WA) to determine profiles of anti-HIV antibodies. The Western Blot results were used for Fiebig staging. 36
Statistical analysis
The FRR for the RITA used was estimated using the formula ɛ=R/P, where P is the total number of cases of long-standing infection in the survey used for estimation of the FRR, and R is the number of these specimens classified as recent by the RITA. The coefficient of variation (CoV) for the estimate of the FRR was calculated. 20 FRRs were estimated for BED and BAI alone, a combination of BED and BAI (MAA1), as an MAA using CD4 count (>200) and viral load (>400 copies/ml) filtering, with a cut-off for BED-BAI of ≤0.8% and <40%, respectively (MAA2). Logistic regression was used to identify factors associated with FRR. All statistical analyses were performed using STATA v11 (StataCorp, College Station, TX).
Results
To understand the long-term specificity of the BED, BAI, and MAA, samples were tested after at least 18–24 months of study enrollment. The interassay agreement between BED and BAI was 92.8% (95% CI 90.1–94.5) for recent/long-term classification (Table 2). Table 3 shows the summary of calculated estimates of FRR by BED and BAI assays. FRR was higher in either assay alone than when assays were used in combination. FRR for BED was 6.1% (95% CI 4.2–8.5), BAI 5.6% (95% CI 3.7–8.0), and BED-BAI 2.3% (95% CI 1.1–4.0) (Table 3). A combination of the BED and BAI assays with CD4 >200 and viral load >400 filtering resulted in the lowest FRR of 1.43% (0.58–2.93) (Table 3). While some long-term infections were misclassified on both BED and BAI assays, there was also a subset of patients who were misclassified by either the BED or BAI assay, but not both assays. We examined the effect of age, gender, opportunistic infections after enrollment, and viral load on FRR when using BED, BAI, and MAA (see Table 4). Individuals with viral suppression below 400 copies/ml over three consecutive visits were associated with misclassification on BED (Fishers exact, p=0.003). Viral loads of less than 400 were associated with misclassification after adjusting for CD4 cell counts [BED (adjusted OR (aOR) 10.3; p=0.008); BAI (aOR 9.72; p=0.019); MAA1 (aOR 16.6; p=0.006)].
Comparison of Classification on BED-Capture Enzyme Immunoassay and Avidity Index Assays
ODn, normalized optical density.
Performance of BED, Bio-Rad Avidity Index Assay, and Two Multiassay Algorithms, False Recent Rates and 95% Confidence Interval
BAI, Bio-Rad avidity index; MAA, multiassay algorithm; CI, confidence interval; AI, avidity index.
Factors Associated with False Recent Misclassification on BED, Bio-Rad Avidity Index, and Multiassay Algorithms
ODn, normalized optical density; BAI, Bio-Rad avidity index; MAA, multiassay algorithm; CEIA, capture enzyme immunoassay; OR, odds ratio; CI, confidence interval.
Kinetics of the BED ODn values were analyzed in the 45 patients with BED ODn <1.2 at 18–24 months postenrollment. Patients were grouped into three groups based upon the trends in their ODn curves (Fig. 1). In Group 1 (19 subjects), BED ODn values were consistently ≤0.8 during the first 20–36 months postenrollment. In Group 2 (15 subjects), BED ODn values were both ≤0.8 and >0.8 during the first 20–36 months postenrollment. In Group 3 (11 subjects), BED ODn values were consistently >0.8 during the first 20–36 months postenrollment but <1.2 at 18–24 months.
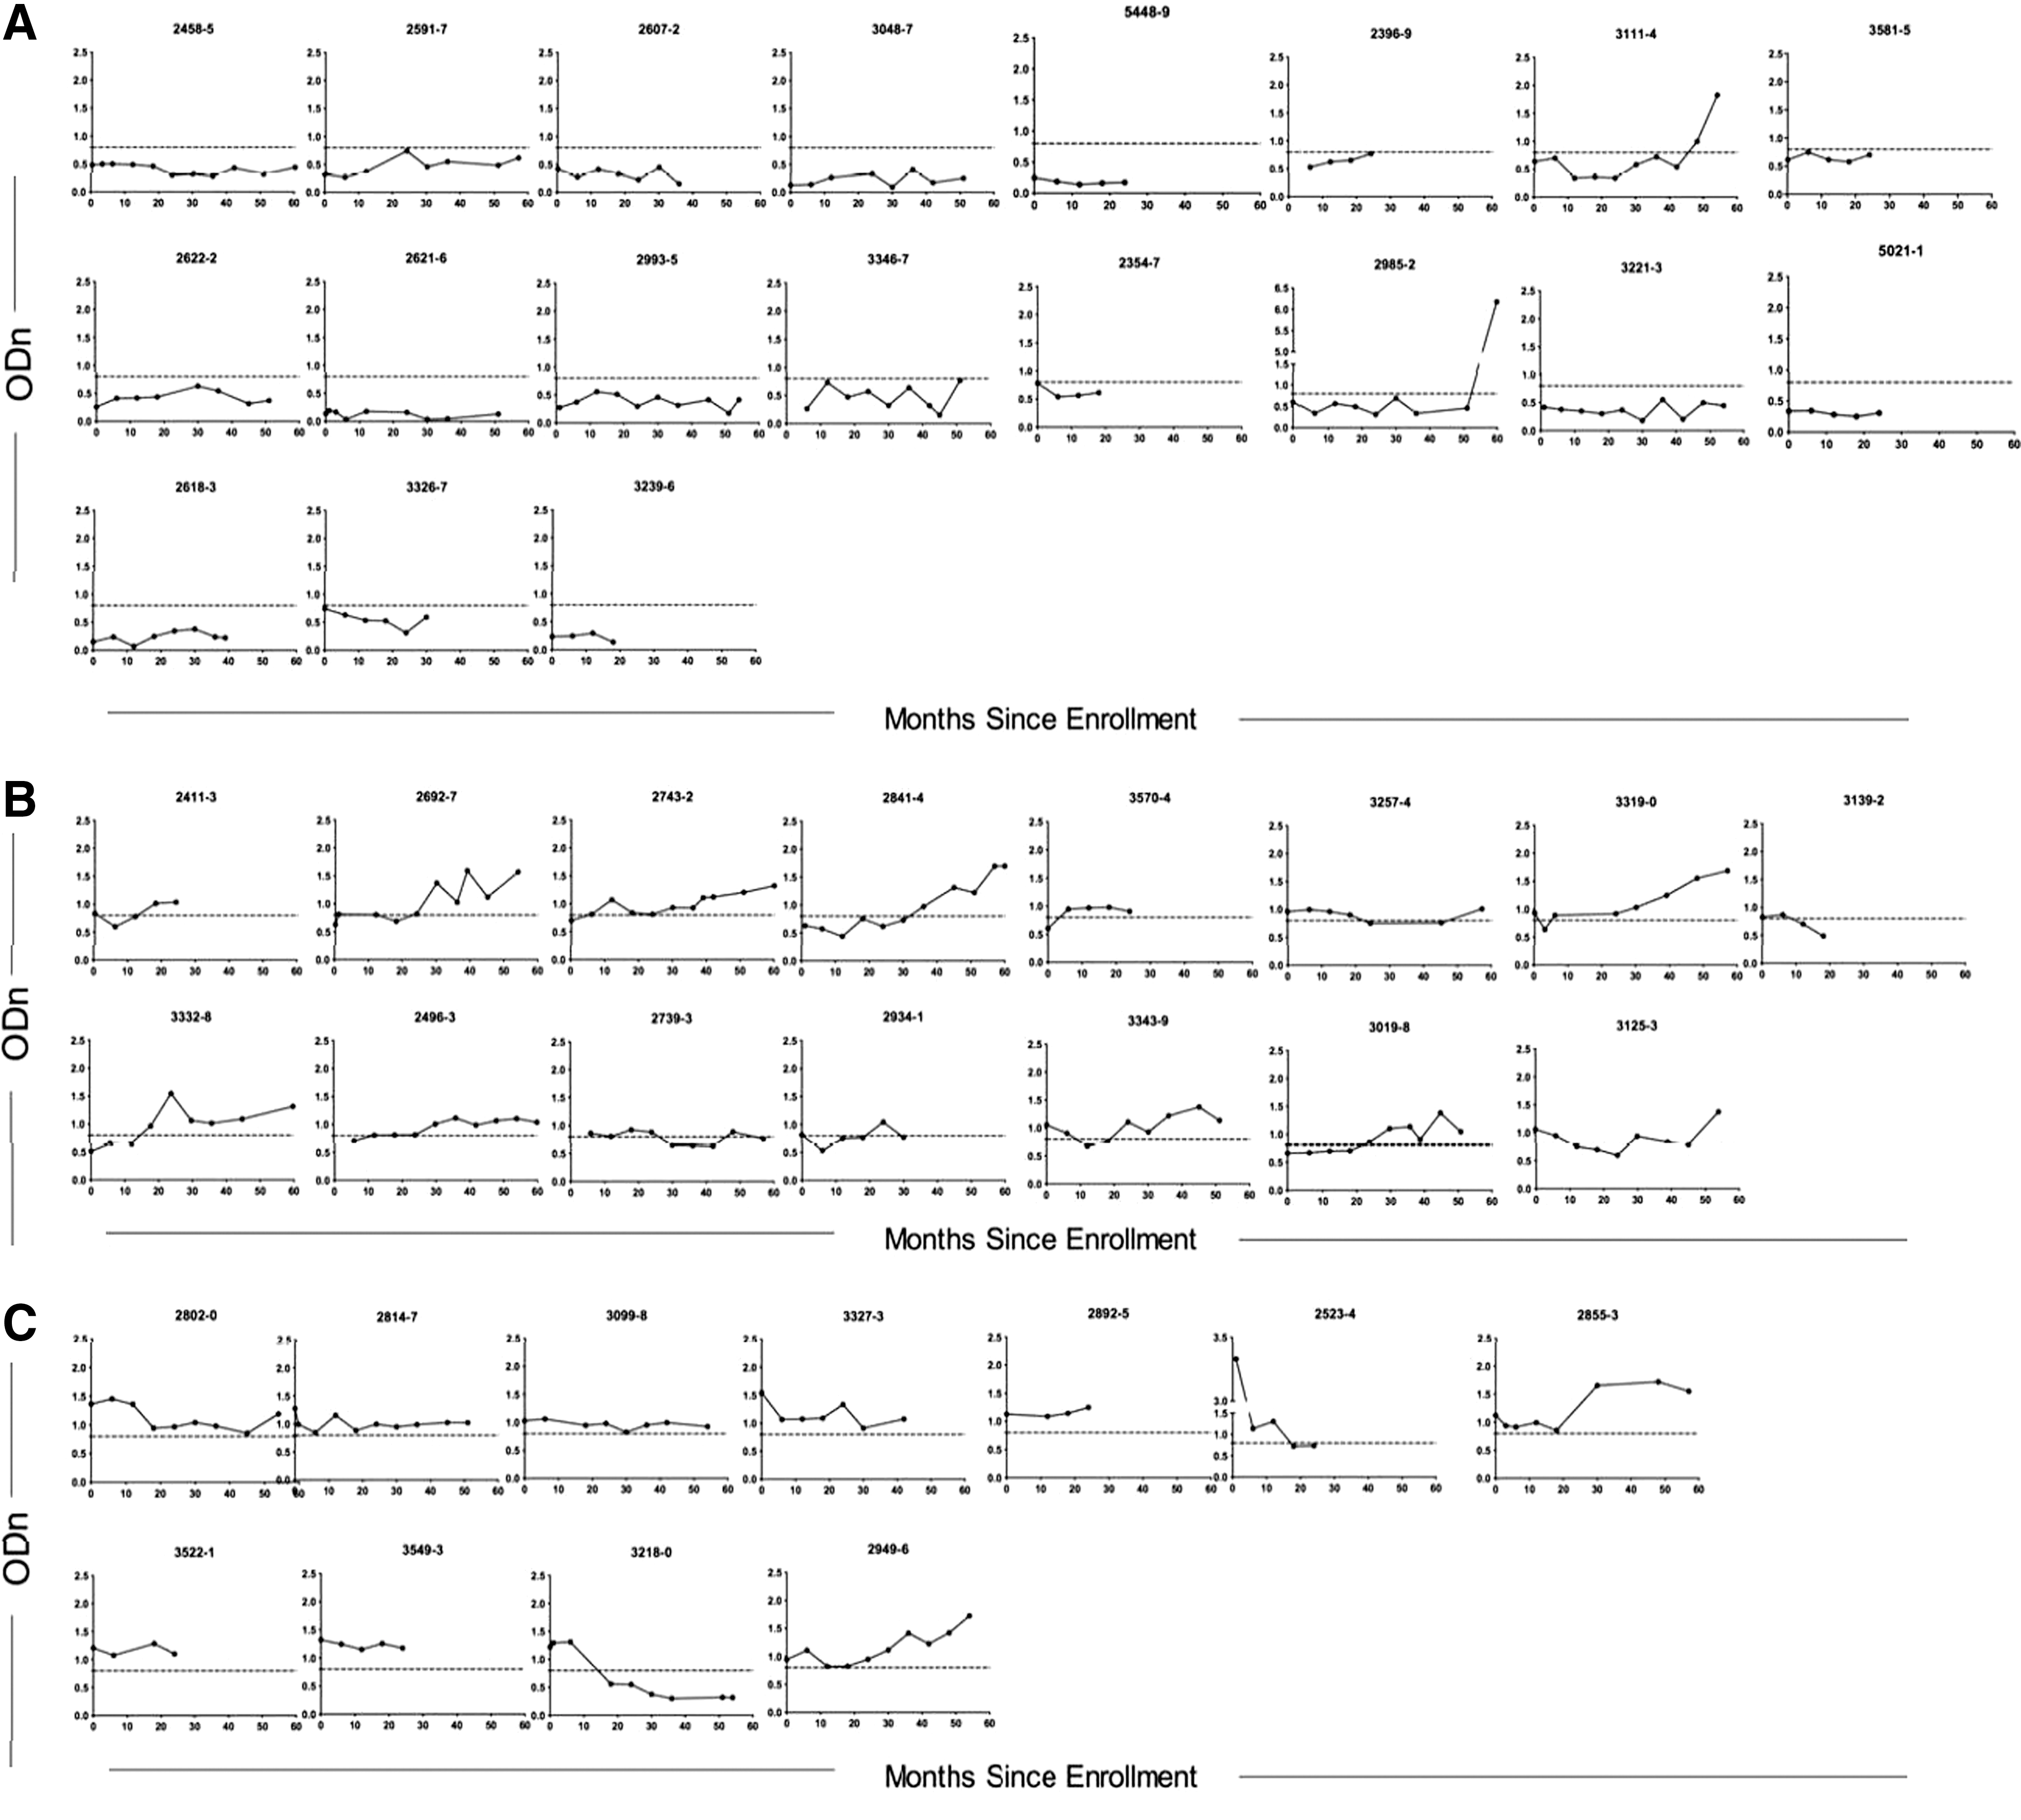
BED optical density (ODn) evolution in all subjects with a BED ODn <1.2 18/24 months poststudy enrollment. Time 0 corresponds to study enrollment. Patients are divided into three groups depending on the kinetics of their BED responses.
The same 45 patients were also analyzed by Western Blot at the earliest available time point to assess the stage of each patient's HIV infection. Forty-three patients were in Fiebig stage VI and 2 patients were in Fiebig stage V. The two patients in Fiebig stage V had different BED and BAI profiles at 18–24 months: BED recent/BAI long-term and BED long-term/BAI long-term. The first subject had BED ODn values ≤0.8 throughout the study. The second subject had BED ODn values ≤0.8 and >0.8, but never exceeding 1.0 during the follow-up period.
Discussion
In this study, we evaluated the FRR of BED, Bio-Rad Avidity Index Assay, and multiassay algorithms for subtype C in Botswana. The inclusion of different combinations of assays and clinical parameters in the multiassay algorithms has reduced the incidence assay FRR. We found that the most restrictive cut-offs for BED and BAI in combination with clinical parameters yielded the lowest FRR, while still presumably maintaining adequate sensitivity. Our multiassay algorithm with the lowest FRR (1.43) was MAA2, which utilized the published BED cut-off at ≤0.8, 10,37 40% as the avidity index cut-off 35 for the Bio-Rad HIV1/2+O EIA, and CD4 and viral load criteria. The combination of BED and BAI had lower FRR than either alone, even without the use of any additional criteria such as CD4 and viral load. The other MAAs used clinical parameters with higher BED and BAI cut-off values, which allows comparison with previously reported FRRs in Botswana and in other areas with a predominantly HIV-1 subtype C epidemic.
As we compare FRRs reported in different publications, 19,23,38,39 it is not only important to note the differences in cut-off values used among groups, 20 but also that assays based upon modifications of existing commercial HIV antibody assays are subject to differences among users. We used the modification as described by Masciotra et al. 34 following the procedures as described in the Bio-Rad HIV 1/2+O package insert except for using a chaotropic agent in parallels wells, but other laboratories may use slightly different modifications of the same BioRad HIV1/2+O EIA, 40 especially incubation times. The only previously reported FRR for BAI for Botswana was reported by Laeyendecker et al., 38 based on a slightly different protocol for the BAI assay based on the modification of the Bio-Rad assay, including a shorter incubation period of diluted patient plasma. Although our estimate was slightly higher, it was not significantly different from that reported by Laeyendecker et al. 38 While differences in BAI protocols make direct comparison of FRR between groups more difficult, the FRR used should be derived from the same method used when applying the assays 28,40 in cross-sectional surveys.
When assessing factors that contributed to the likelihood of an individual being in the false recent population, longitudinal data were more informative than parameters obtained from a single time point. We found that using CD4 and viral load data reduces FRR. Low viral load was associated with false recency on the BED assay, BAI, and MAA1.
It has previously been suggested that if adequate window periods are ascertained for a population, then adjustments for false recent rates will be unnecessary, especially as the BED window period tends not to exceed 3 years. 41 However, the detailed kinetics of BED ODn values seen in this study population indicates that there may be individuals who never cross the threshold for long-term infection on the BED assay. Although many of these patients do show viral suppression, some patients with persistent false recency on the BED assay did not control HIV replication and/or did not maintain high CD4 cell counts. This highlights the importance of obtaining accurate false recent rates for HIV incidence assays in order to correct for the misclassification of long-term infections.
It would be desirable to have a local Botswana-specific window period for the BED and BAI assays to complement the FRR data found in this article, but assembling a longitudinal seroconversion panel of adequate sample size can be challenging. An augmented cross-sectional approach, 42 where subjects who test recent on the BED at the cross-sectional survey are followed forward and tested periodically with BED for a sufficient period of time (say 1 year) or until they test long-term, allows estimation of local false recency rate as well as mean window period and provides an attractive alternative. The augmented cross-sectional approach is a new approach proposed in Wang et al. 42 The joint estimation of false recent rate and mean window period can be achieved through statistical modeling using likelihood theory based on distributional assumptions. Although this approach certainly has limitations of its own, we consider this an attractive alternative to the standard approach because it does not require identification of an adequate number of seroconverters, which usually involves following a substantially larger number of HIV-negative individuals.
One approach to handle the false recency issue is to ascertain the mean window period, taking into account that some subjects may take longer than expected, based upon the BED product information, to be classified as long-term on the assay. 43 This approach can eliminate the need for adjustments for false recent rate. However, the detailed kinetics of BED ODn values seen in this study population indicates that there may be individuals who never cross the threshold for long-term infection on the BED assay. Although many of these patients do show viral suppression, some patients with persistent false recency on the BED assay did not control HIV replication (13/19, 68%) and/or did not maintain high CD4 cell counts (10/19, 53%). This highlights the importance of obtaining accurate false recent rates for HIV incidence assays in order to correct for the misclassification of long-term infections.
It is important to acknowledge that some individuals drop their BED ODn values without progressing to AIDS and without ARV usage. In Zimbabwe, 27% of the patients who contributed to the false recent population had BED values >0.8 from 1 year earlier, 44 and in this study we found that 19.4% of the false recent population previously had a BED ODn >0.8. The subset of individuals with a decline in BED ODn poses a challenge in estimating HIV incidence.
It would be desirable to have a local Botswana-specific window period for the BED and BAI assays to complement the FRR data found in this article, but finding appropriate local specific seroconversion panels is challenging. An augmented cross-sectional approach, 42 in which subjects who test recent on the BED at the cross-sectional survey are followed forward for at least 1 year or until they test long-term, allows the estimation of the local false-positive rate as well as the mean window period and provides an attractive alternative.
A limitation of this study is the relatively modest sample size. The sample size in this study leads to a coefficient of variation of 17.8%, which is within acceptable limits (<25–30%). 20 While the FRRs reported here provide an excellent starting point for the assessment of cross-sectional estimates of HIV incidence in Botswana, local FRRs must continue to be monitored over time, as they are likely to change and vary by region as a function of host genetic factors. The BAI assay is based on the Bio-Rad enzyme immunoassay originally designed for subtype B, but it has been used in other subtypes. 28 It remains unclear what impact this will have, especially on the mean duration of recent infection (MDRI), across other subtypes. It will be important to apply the FRR after an MDRI has been calculated for the MAA to ultimately validate the values obtained.
Footnotes
Acknowledgments
We would like to acknowledge the participants and investigators for the Dikotlana and Botsogo studies in Botswana for the availability of deidentified residual samples. We would also like to acknowledge the Botswana-Harvard HIV Reference Laboratory, especially the research laboratory team, for their input and discussions of this work, and the Michelle Owen group of the Centers for Disease Control for their continued work on the Bio-Rad-Avidity Index Assay. Tessa LeCuyer's work was funded by a Fulbright-Fogarty Public Health Fellowship. Rui Wang's work was supported by grant R01 AI24643 from the National Institute of Allergy and Infectious Diseases. The funders had no role in study design, data collection, analysis, interpretation, writing, or submission of this manuscript for publication. We would like to thank Lendsey Melton for editorial assistance.
Author Disclosure Statement
No competing financial interests exist.