




Abstract
The CD4+/CD8+ T cell ratio is altered when HIV-1 infects the human immune system. However, the exact mechanisms of how CD4+ and CD8+ T cells participate in HIV infection are still unknown. This study used bioinformatics methods to compare the transcriptional profiles between CD4+ and CD8+ T cells in HIV-1-infected patients in order to explore the potential molecular mechanisms of CD4+ and CD8+ T cells in HIV-1 infection. We found that expression patterns of differentially expressed genes (DEG) in CD4+ T cells were dramatically different from those in CD8+ T cells. We also constructed protein–protein interaction (PPI) networks to extract functional modules at each stage, and found that some of the important genes such as BRCA1 were central hubs of the modules. Finally, we applied functional annotation to the modules and found that CD4+/CD8+ T cells played critical roles in regulating the cell cycle and other cellular pathways. Thus, this study would greatly further our understanding of the roles of T cells in HIV infection, and provide potential clues for developing AIDS vaccines in the future.
Introduction
H
HIV infection can be divided into three stages: nonprogressive, chronic, and acute infection. It was found that long-term nonprogressive patients carried undetectable viral loads, had normal CD4+ T cell levels, but had virus-specific cellular responses in peripheral blood and mucosal compartments. 7,8 This is in contrast to the chronically HIV-1-infected patients who had high viral loads and CD4+ T cell depletion. 8 As more extensive studies were focused on the chronic infections, a new model explaining CD4+ T cell depletion during chronic HIV-1 infection suggested that activated CD4+ T cells from untreated HIV-positive individuals were in a hyperproliferative state modulated by type I interferons that were clearly different from those of HIV-negative individuals. 9
CD4+ T cells mainly act as a T cell type to facilitate other T cells in resisting virus infection, while CD8 is widely spread on the surface of suppressor T lymphocytes and cytotoxic T lymphocytes, with different dynamics during HIV-1 infection than CD4. 10 It was then concluded that HIV-1 infection resulted in profound disorders in the immune system with a loss of CD4+ T cells and a reduction of the CD4+/CD8+ T cell ratio. 11 However, the pathogenic mechanism responsible for these consequences remains elusive.
Therefore, it is important to investigate the difference in gene expression between CD4+ and CD8+ T cells at different stages during HIV-1 infection and to explore the potential molecular mechanism. In the present study, we obtained the transcriptional profiles of CD4+ and CD8+ T cells from HIV-1-infected patients and compared them to normal controls through bioinformatics methods. Our purpose is to better understand the characteristic differences in hierarchical clustering and functions between CD4+ and CD8+ T cells. Our results may help to better classify the mechanisms in the cell immune system in response to HIV infection.
Materials and Methods
Affymetrix microarray data
The gene expression profiles were characterized from the Gene Expression Omnibus (GEO) database (ID: GSE6740), which were deposited by Hyrcza and colleagues. 12 A total of 40 genechips were available, including genechips from uninfected samples, nonprogressive HIV infection samples, chronic infection HIV samples, and acute HIV infection samples (five genechips from CD4+ cells and five genechips from CD8+ cells, respectively). The annotations of chips were downloaded from the GPL96 platform (Affymetrix Human Genome U133A Array).
Data preprocessing
The downloaded original data were converted into expression measures and missing data were imputed. 13 Then robust multiarray average (RMA) was used to normalize the data. 14
Differentially expressed genes (DEGs) analysis
The samples in GSE6740 were divided into three groups to perform pairwise comparisons: uninfected vs. acute HIV infection, uninfected vs. chronic HIV infection, and uninfected vs. nonprogressive HIV infection. For each group, the Linear Models for Microarray Data (LIMMA) package in R language was used to identify DEGs. 15 The values of p and | log (FC) | were obtained directly during the analysis and only those genes with a p-value<0.05 and | log (FC) |>1 were selected as the DEGs.
Functional classification
The database of Clusters of Orthologous Groups of proteins (COGs) (
Hierarchical clustering
Hierarchical clustering was performed to compare the gene expression profiles between CD4+ T cells and CD8+ T cells. 18 First, all genes were classified by hierarchical clustering to observe the overall expression patterns. Second, the overlapping DEGs of CD4+ and CD8+ T cells among all three HIV-infected stages were extracted. Then the expression pattern of those DEGs was characterized through hierarchical clustering analysis.
Construction of the protein–protein interaction (PPI) network
The Search Tool for the Retrieval of Interacting Genes (STRING) database provides both experimental and predicted interaction information. 19 The overlapping DEGs of CD4+ and CD8+ T cells among all three HIV-infected stages were mapped to the STRING database to analyze the interactions between two DEGs according to their confidence score. Then, the PPI networks were constructed using Cytoscape. 20
Functional modules in the PPI network
Molecular Complex Detection (MCODE) can effectively detect densely connected regions in a molecular interaction network, many of which correspond to known molecular complexes based solely on connectivity data. 21 MCODE detects protein complexes that are of the highest quality in terms of the function and localization similarity of proteins within predicted complexes. The functional modules from above PPI networks were identified by the method of MCODE with the threshold of degree ≥2 (degree of each node in one module must be no less than 2) and K-core ≥2 (number of neighbors of each node in one module must be no less than 2). The degree and K-core of each node could be calculated and obtained directly in MCODE.
To analyze the biological function of the modules, the Biological Networks Gene Ontology Tool (Bingo) was used to annotate the module based on Gene Ontology (GO). 22 A false discovery rate (FDR) <0.01, which denotes the significant level of corresponding node enrichment, was selected as the cut-off criterion. The value of FDR could be derived directly in Bingo analysis.
Results
Differentially expressed genes analysis
The original data downloaded from the GEO database were normalized by the RMA method (Fig. 1). By the criterion of p-value<0.05 and |log (FC)|>1, 398 (acute HIV infection samples vs. uninfected samples), 280 (chronic HIV infection samples vs. uninfected samples), and 208 (nonprogressor samples vs. uninfected samples) DEGs were identified in CD4+ T cells, respectively. Similarly, 507, 314, and 270 DEGs were identified in CD8+ T cells, respectively. The numbers of DEGs detected in CD8+ T cells were larger than those in CD4+ T cells in all three HIV-infected stages.
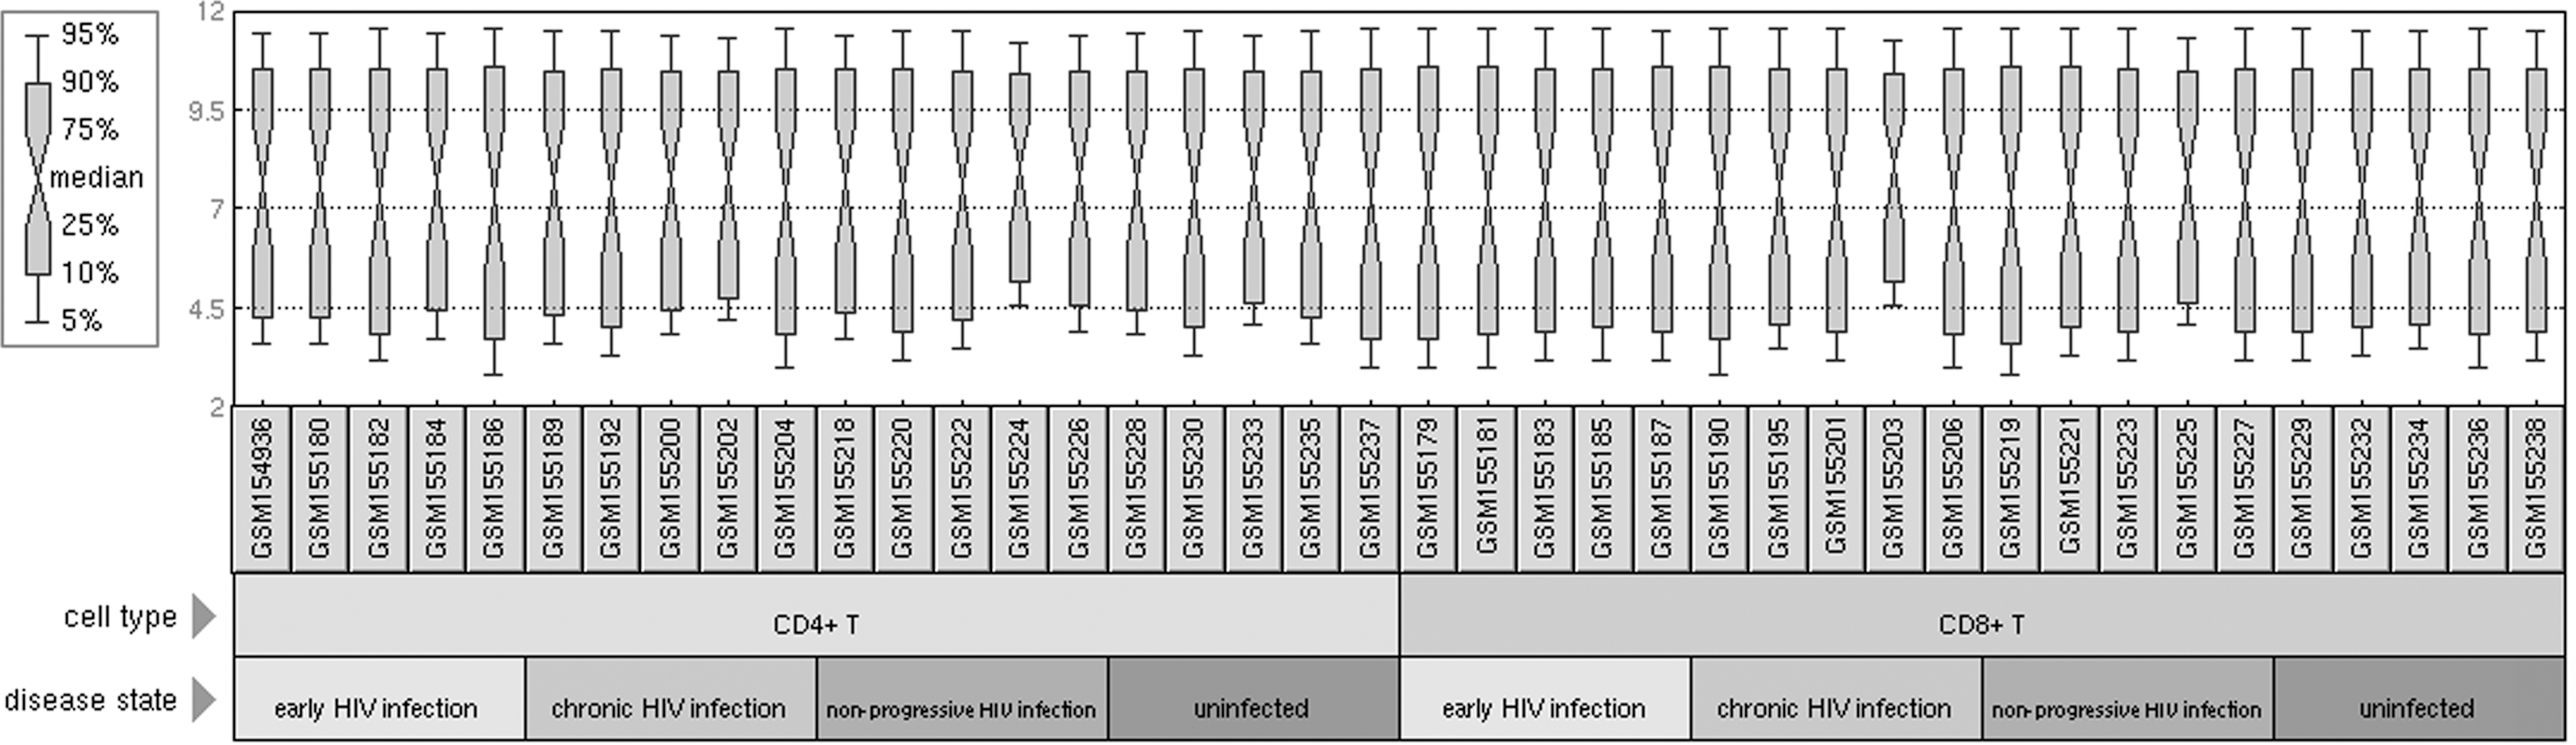
Expression box plot after data normalization.
Functional classification of DEGs
The biological function of DEGs in CD4+ and CD8+ T cells were analyzed by COG with a threshold of E-value<1e-05. According to the similarity of the gene sequence between DEGs and the gene sequence of each node recorded in GO, the DEGs in different stages were classified into different clusters (Fig. 2). The details of every cluster can be seen in Table 1. It was clear that the significant GO categories in CD4+ T cells from nonprogressive HIV infection samples were associated with a homeostatic process and cell signaling, whereas those in CD8+ T cells were associated with an immune response and regulation of cell proliferation. Interestingly, the significant GO categories in CD4+ T cells and CD8+ T cells from chronic HIV infection samples were similar in that both were related to an immune response and locomotor behavior. Also, the DEGs in CD4+ T cells and CD8+ T cells from acute HIV infection samples were classified into the same functional group, which was the function of cell proliferation regulation.
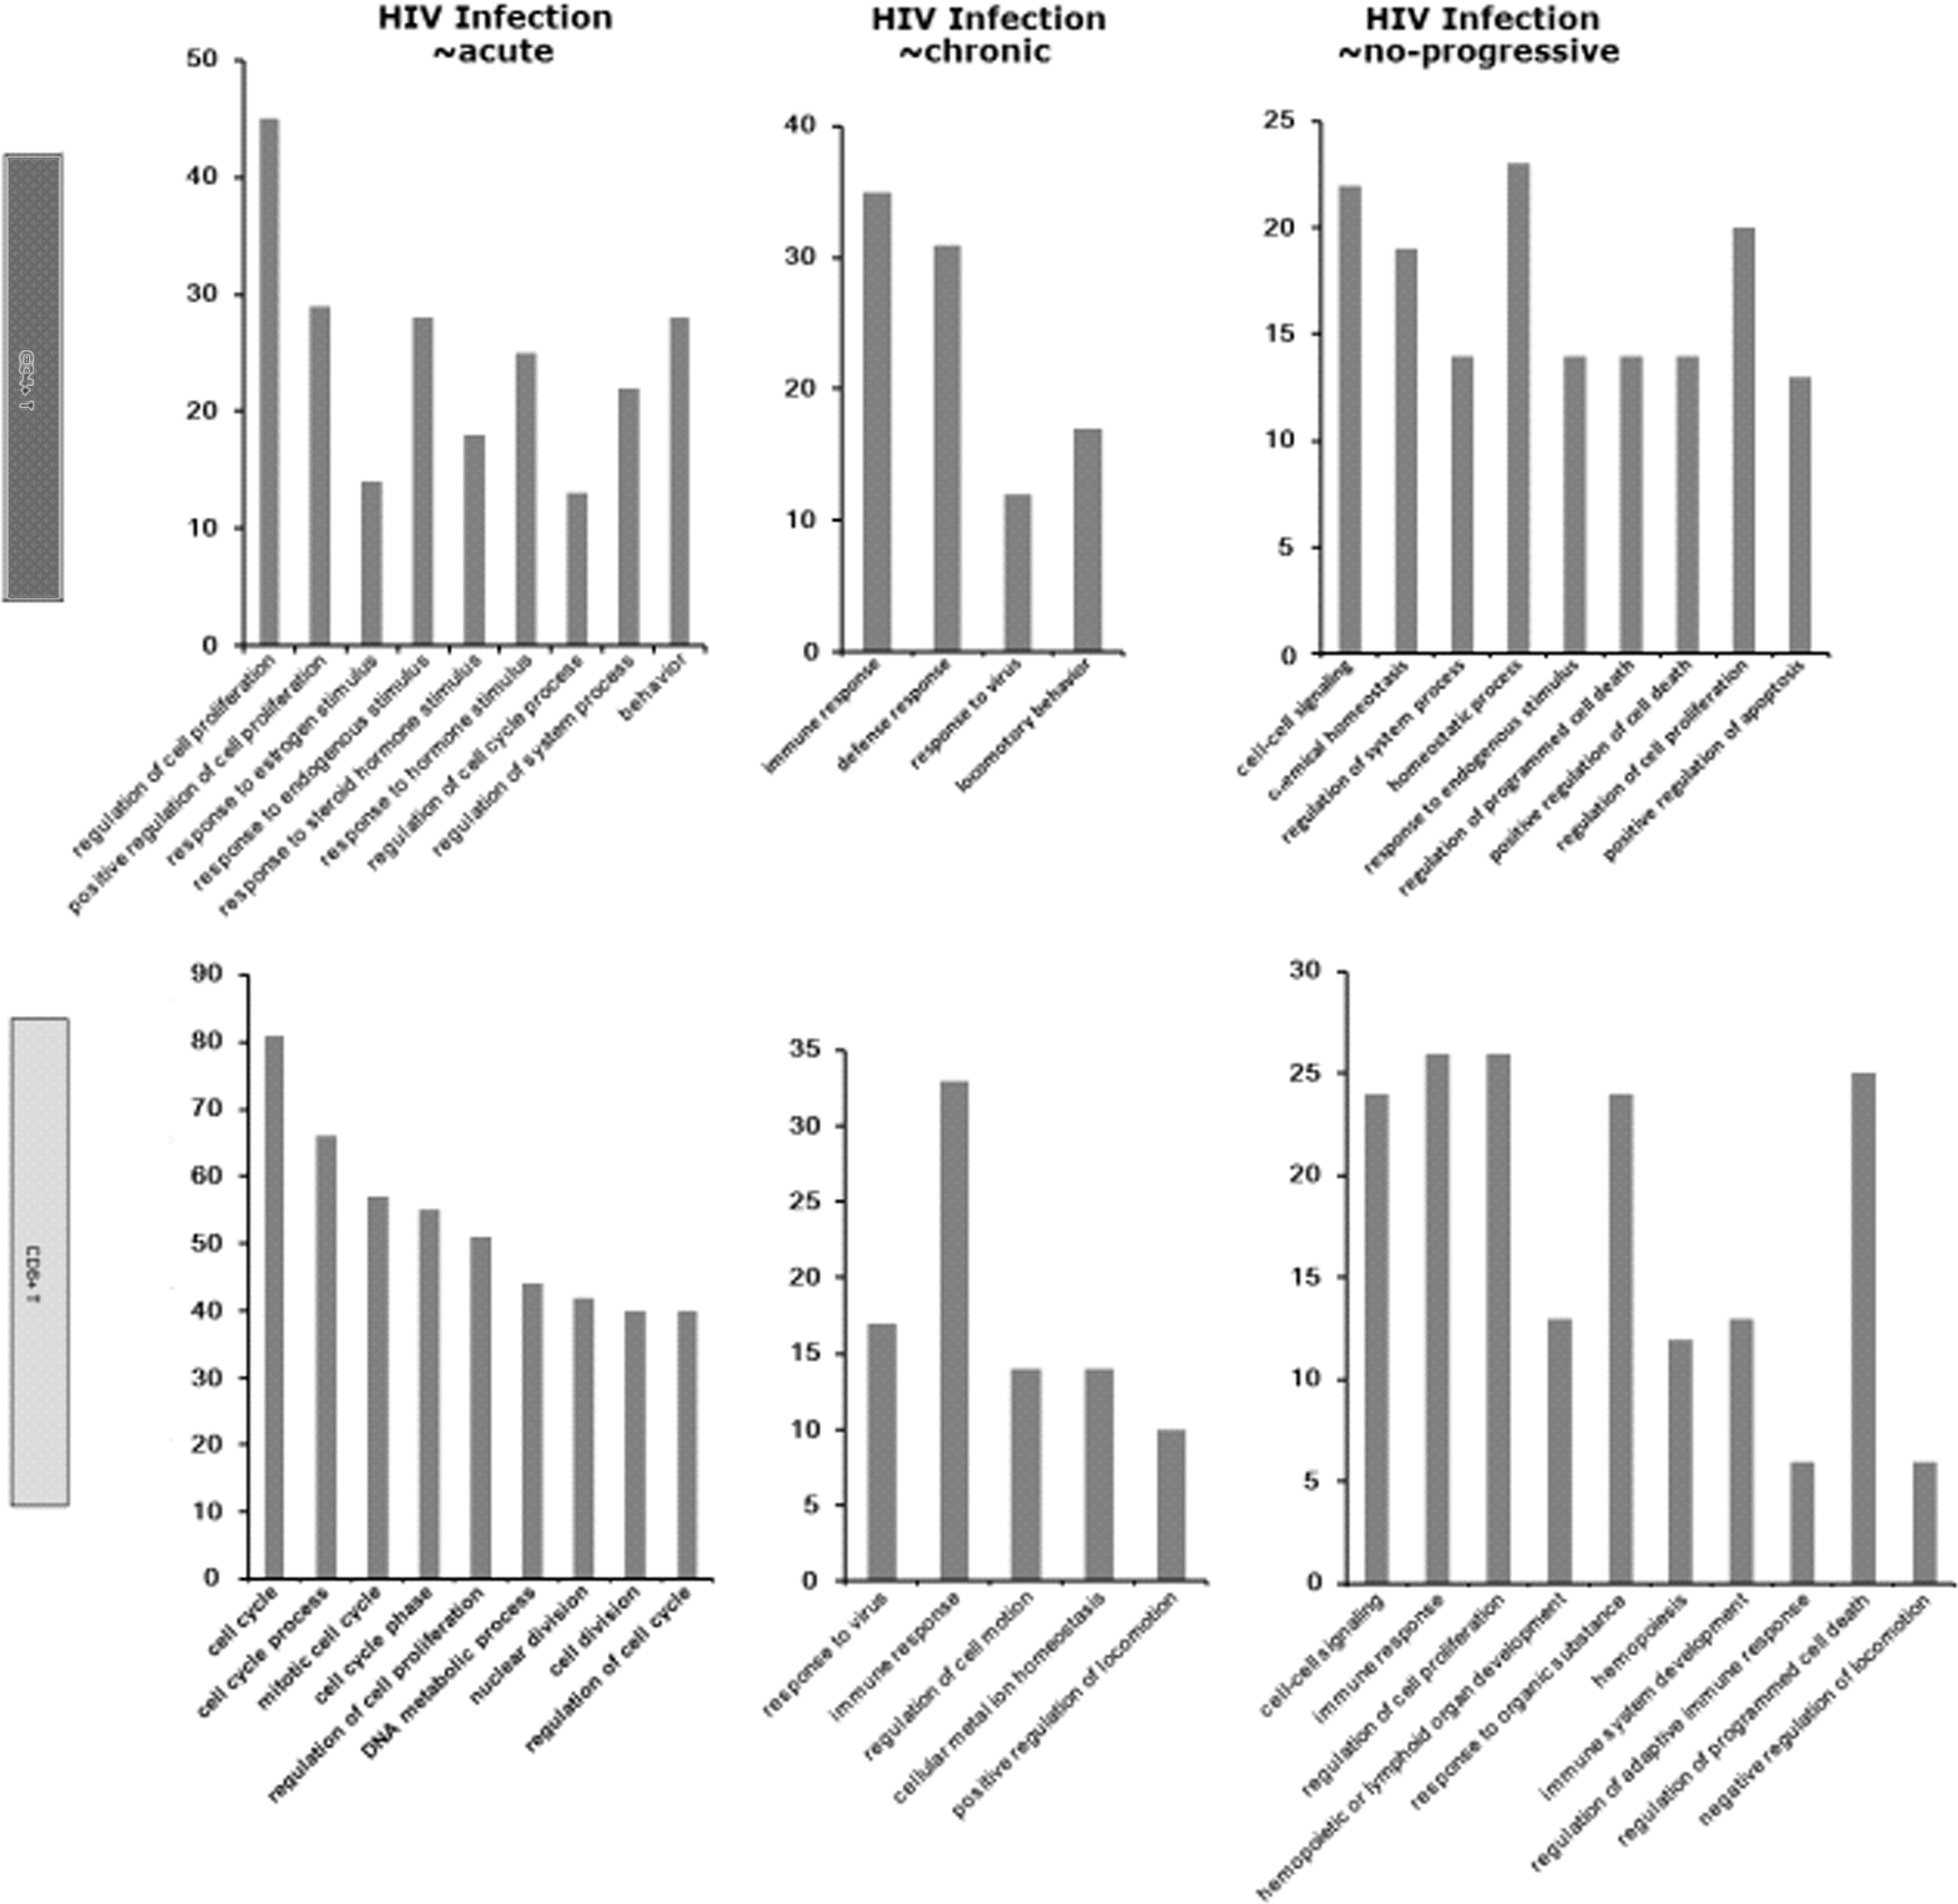
Function classification diagrams of differentially expressed genes (DEGs) in two T cell types at three different HIV infection stages. The names of the functional categories in each plot are displayed on the horizontal axis and the numbers of genes on the vertical axis. Upper panel: CD4+ T cells (black); lower panel: CD8+ T cells (gray).
Hierarchical clustering
At first, we performed hierarchical clustering for all genes (Fig. 3, left panel). The result did not show any obvious difference in gene expression patterns between CD4+ T cells and CD8+ T cells. Then, we adjusted the hierarchical clustering based on the overlapping DEGs in CD4+ and CD8+ T cells at all three stages (Fig. 3, right panel). We then observed that the gene expression patterns in CD4+ T cells were dramatically different from those in CD8+ T cells. Among them, CPA1 (carboxypeptidase A1) and BRCA1 (breast cancer-associated protein-1) were both significantly up-regulated in CD4+ T cells but down-regulated in CD8+ T cells.
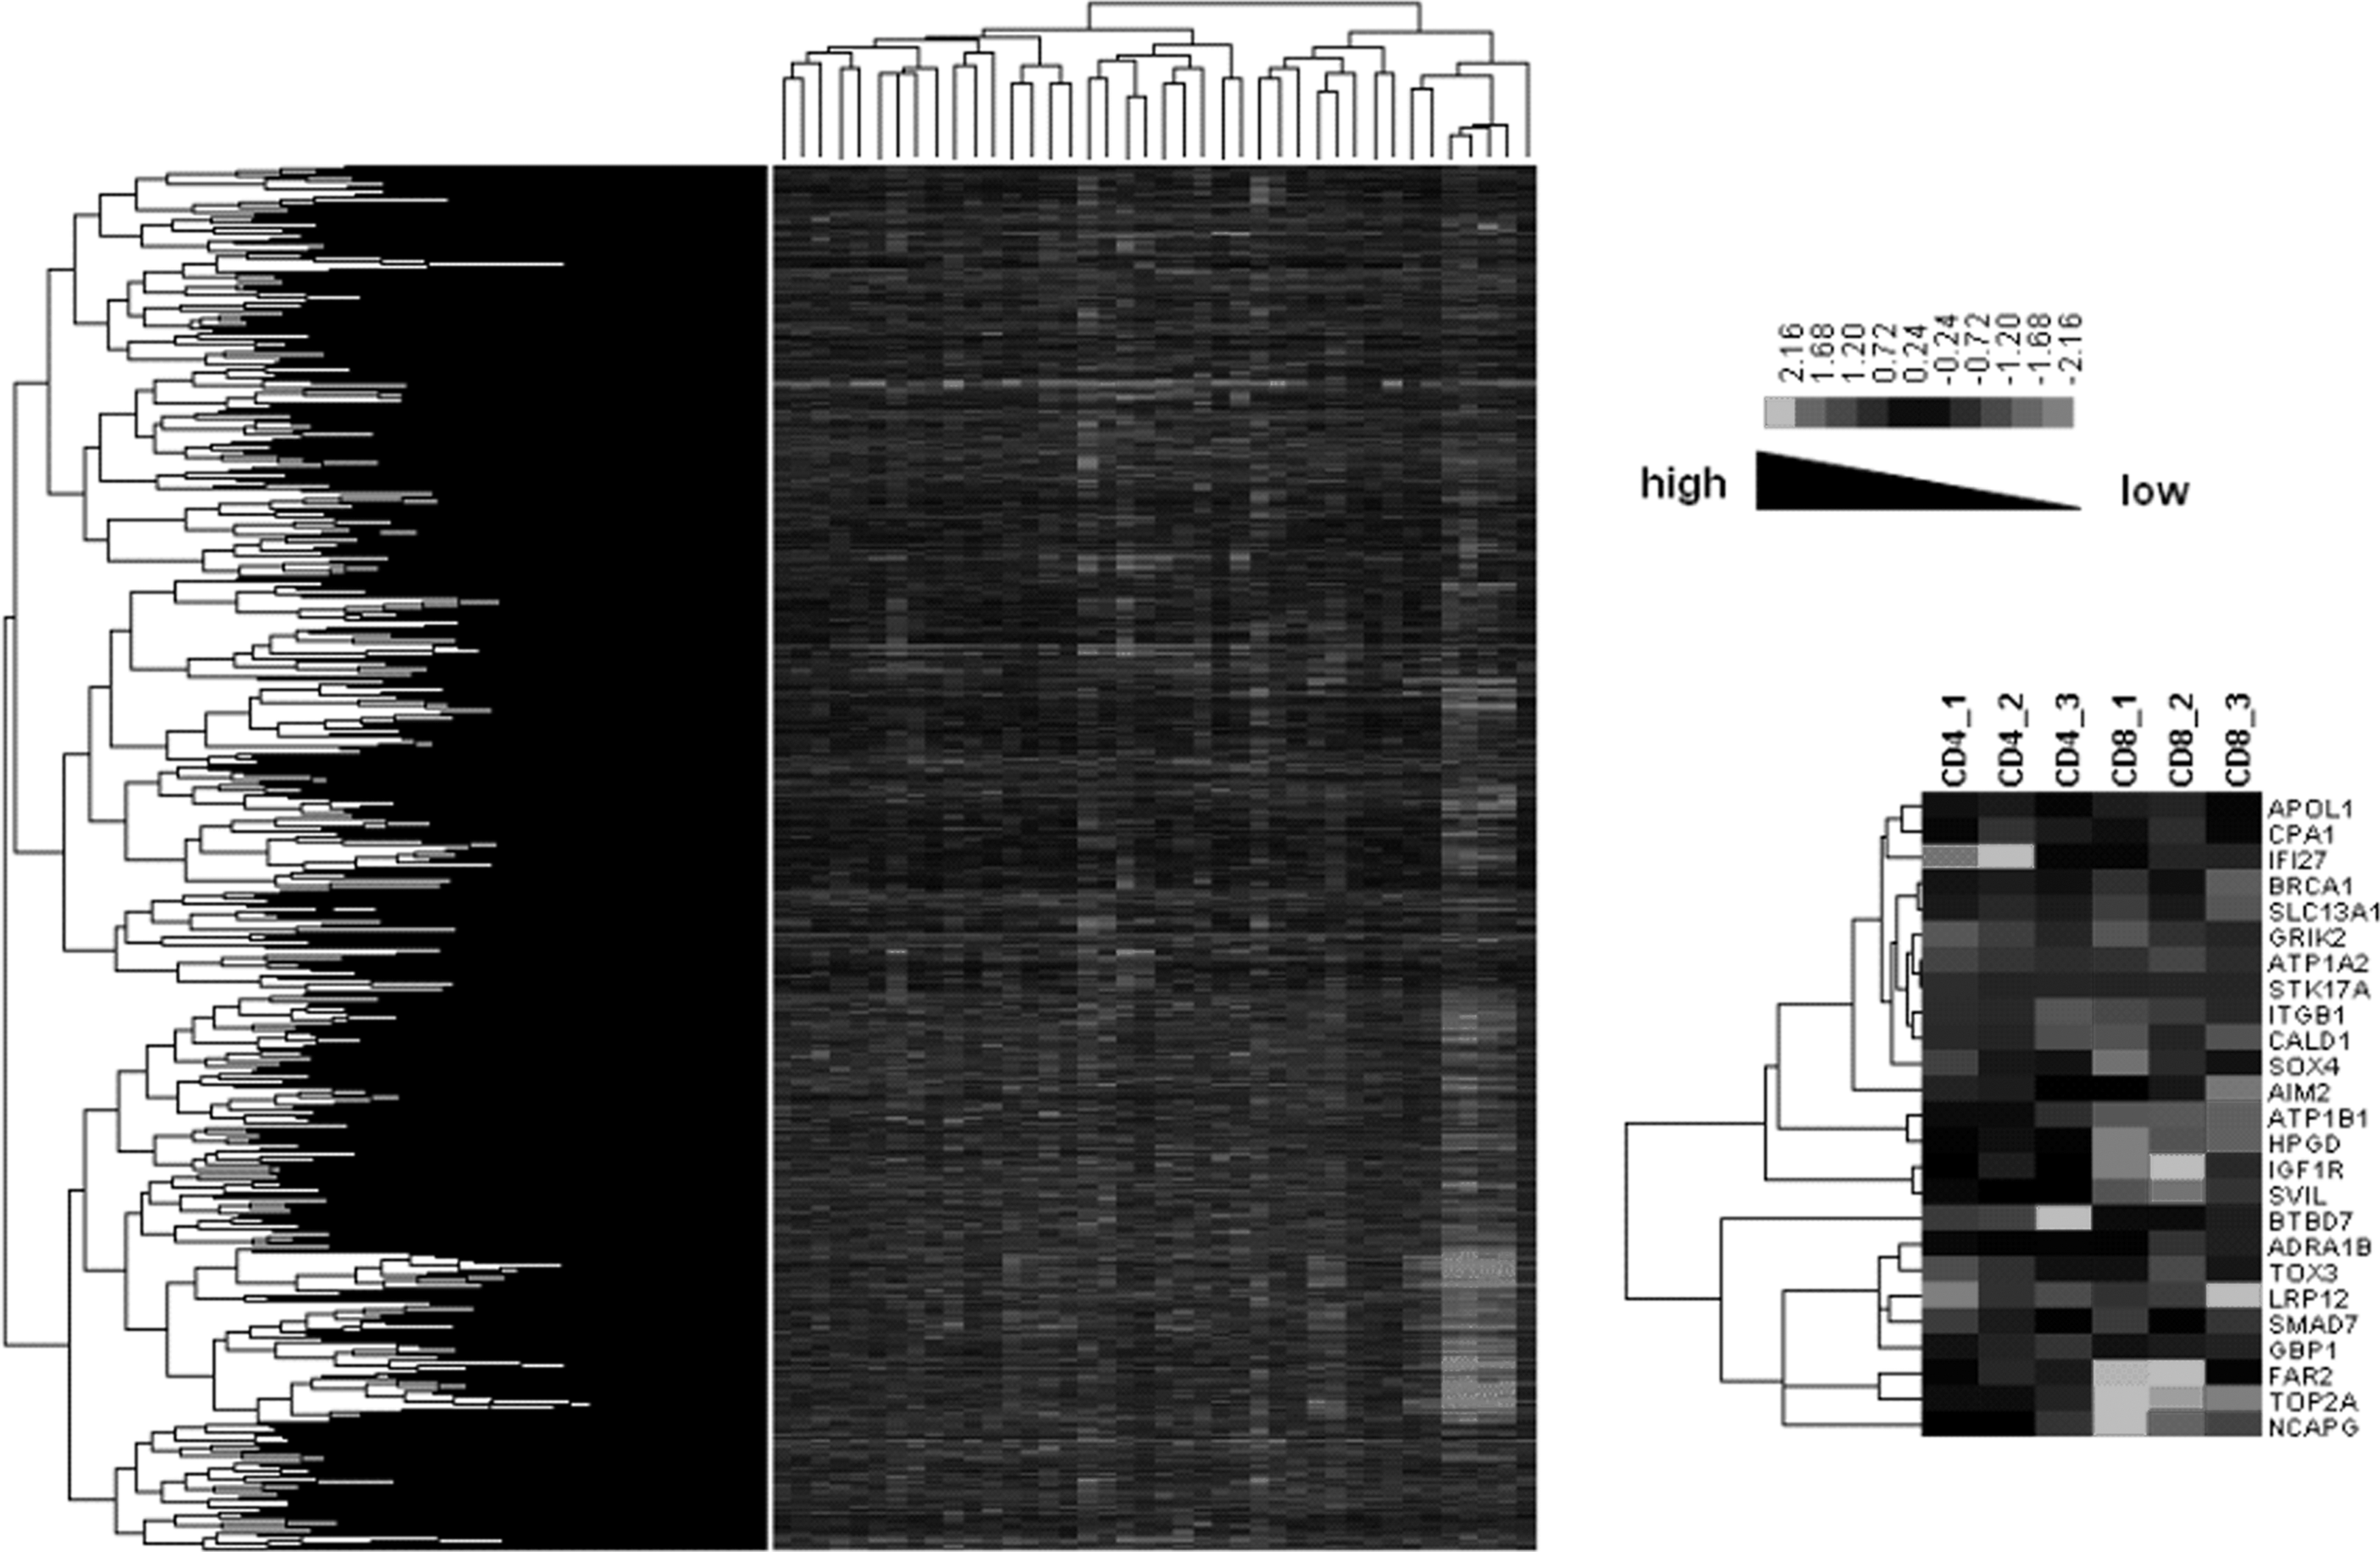
Hierarchical clustering diagrams. Left panel represents the whole function classification diagram of genes across all the samples. The hierarchical clustering result of overlapping DEGs in CD4+ and CD8+ T cells is shown in the right panel. The relative levels of gene expression are depicted with a color scale where gray represents a low expression level and white represents a high expression level.
PPI network construction and modules identification
To understand the DEGs from a systemic perspective, we mapped the overlapping DEGs in CD4+ T cells and those in CD8+ T cells at all stages into STRING, and constructed two PPI networks, respectively (Fig. 4). Since the overlapping DEGs in each cell type were highly abundant, the two PPI networks were too complicated to yield any useful information. Therefore, we used MCODE to identify the functional modules in these two networks. With a threshold of degree ≥2 and k-score ≥2, three functional modules were extracted from each network (Figs. 5 and 6). In the modules derived from the PPI network of CD4+ T cells, BRCA1, IFI27 (interferon α-inducible protein 27), ITGB1 (integrin beta 1), and SMAD7 (SMAD family member 7) appeared to be hub nodes. In contrast, NCAPG (non-SMC condensin I complex subunit G), OP2 (osteogenic protein 2), GEP55, IGF1R (insulin-like growth factor 1 receptor), and CALD1 (caldesmon 1) appeared to be hub nodes in modules derived from the PPI network of CD8+ T cells.
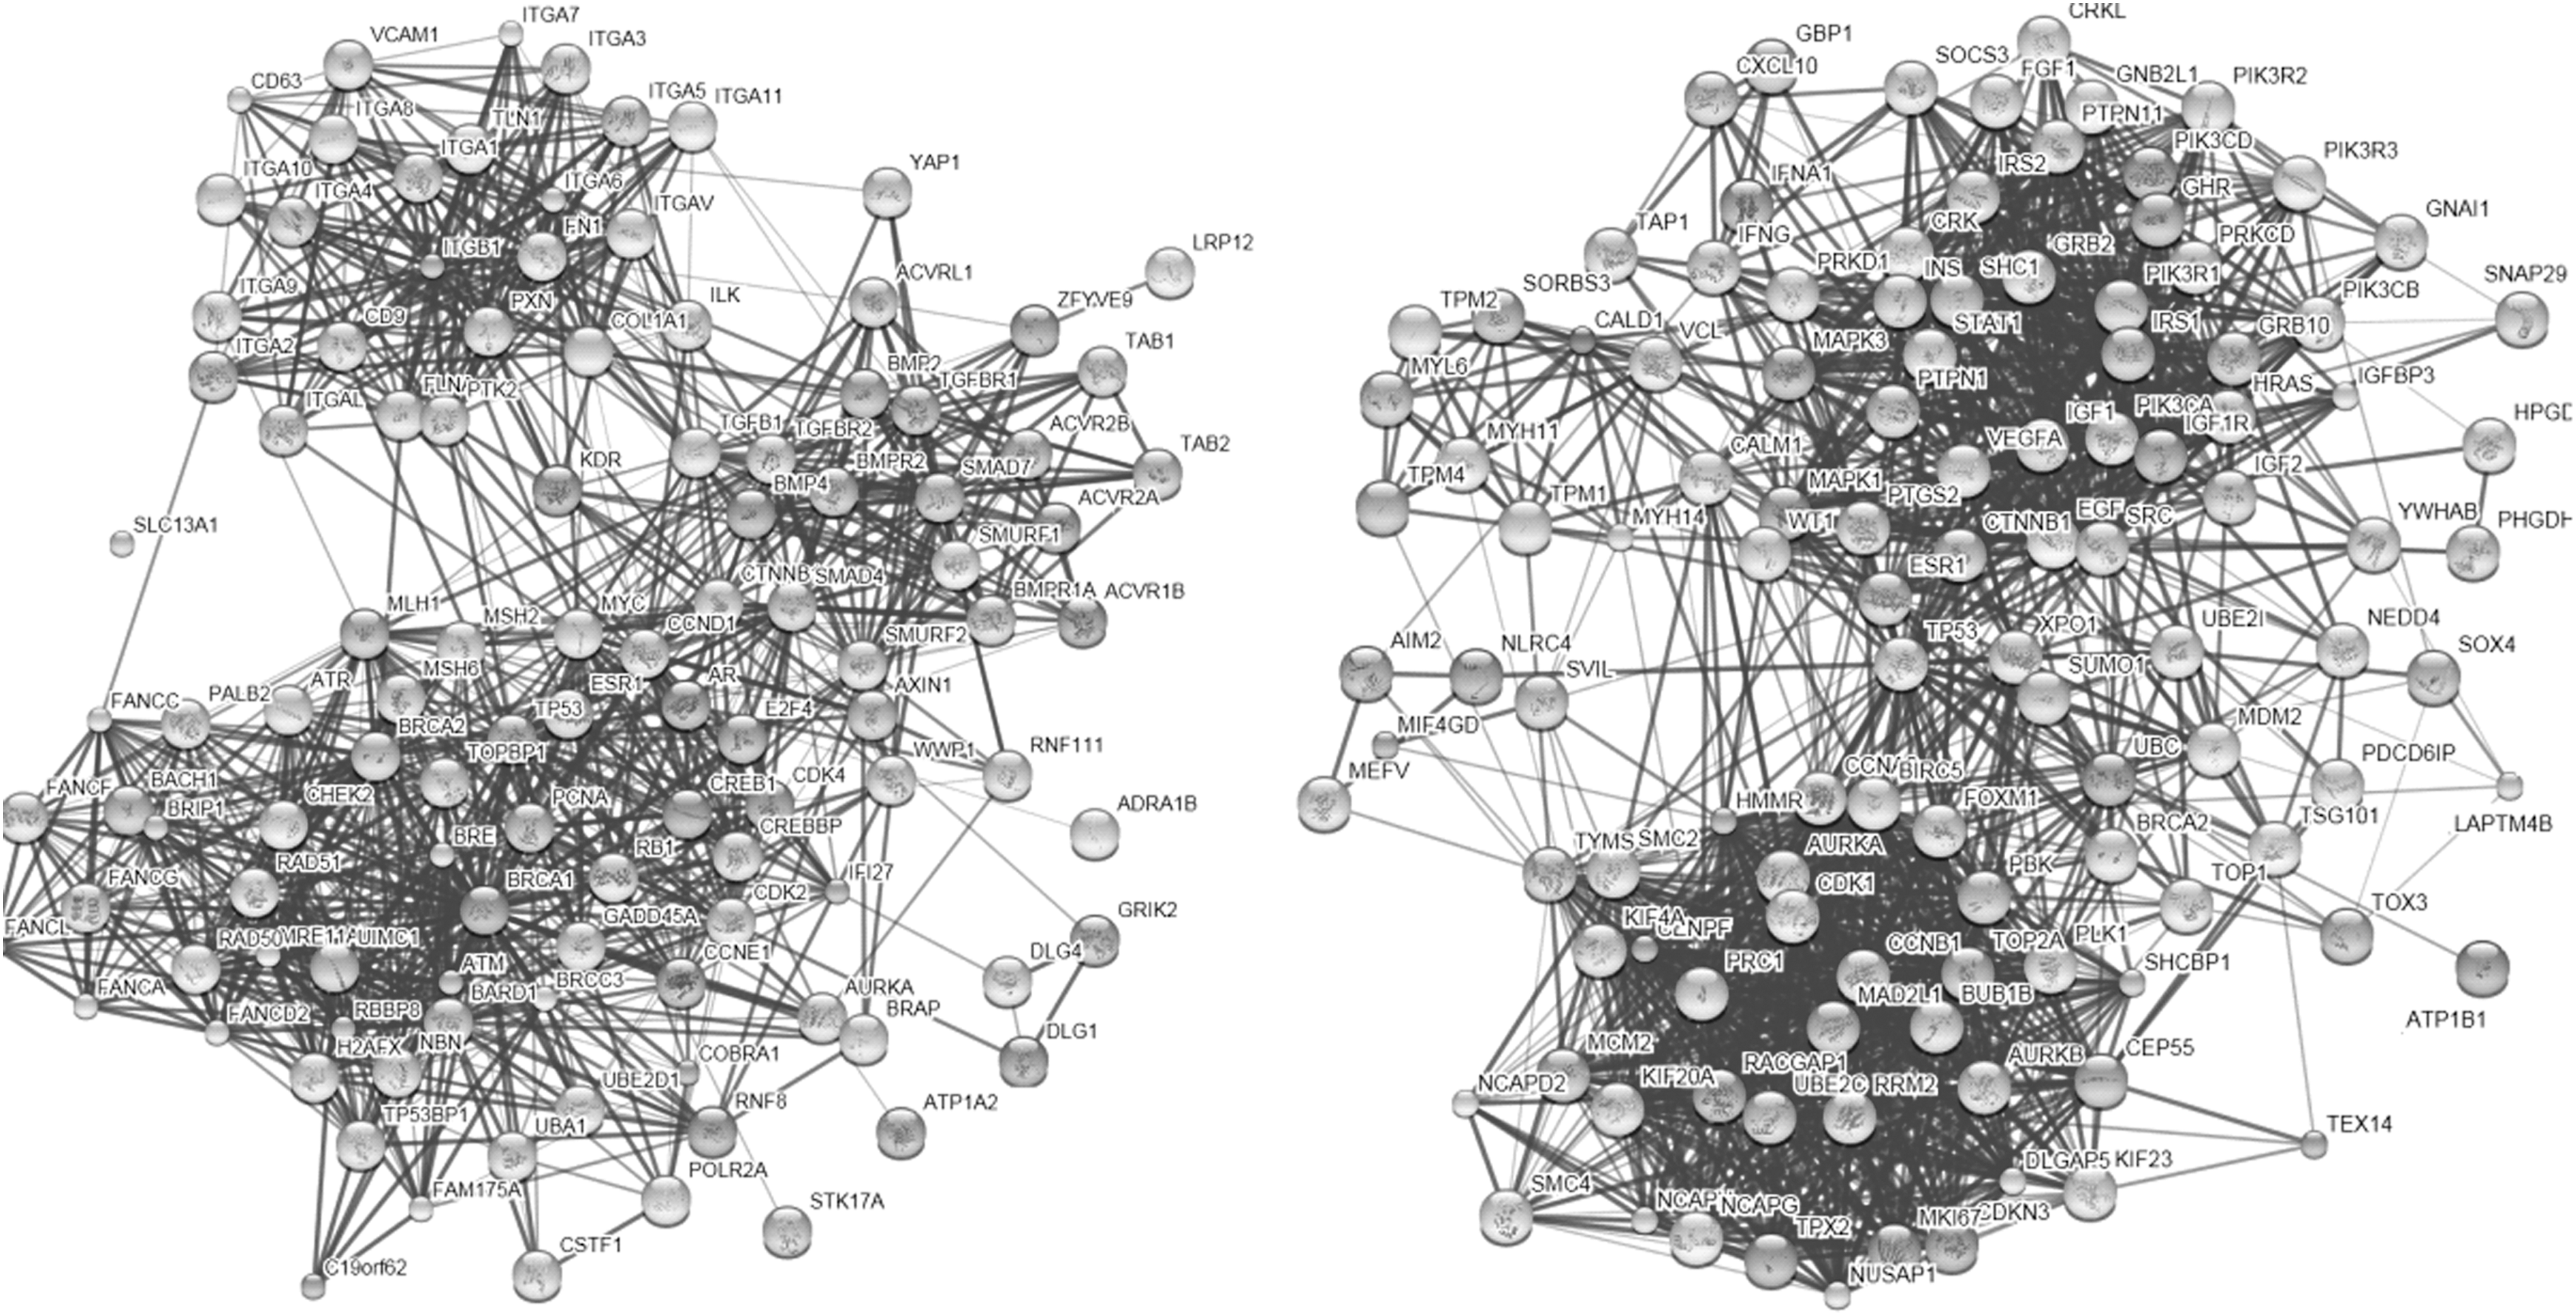
Protein–protein interaction (PPI) network constructed in CD4+ T cells (left) and CD8+ T cells (right).

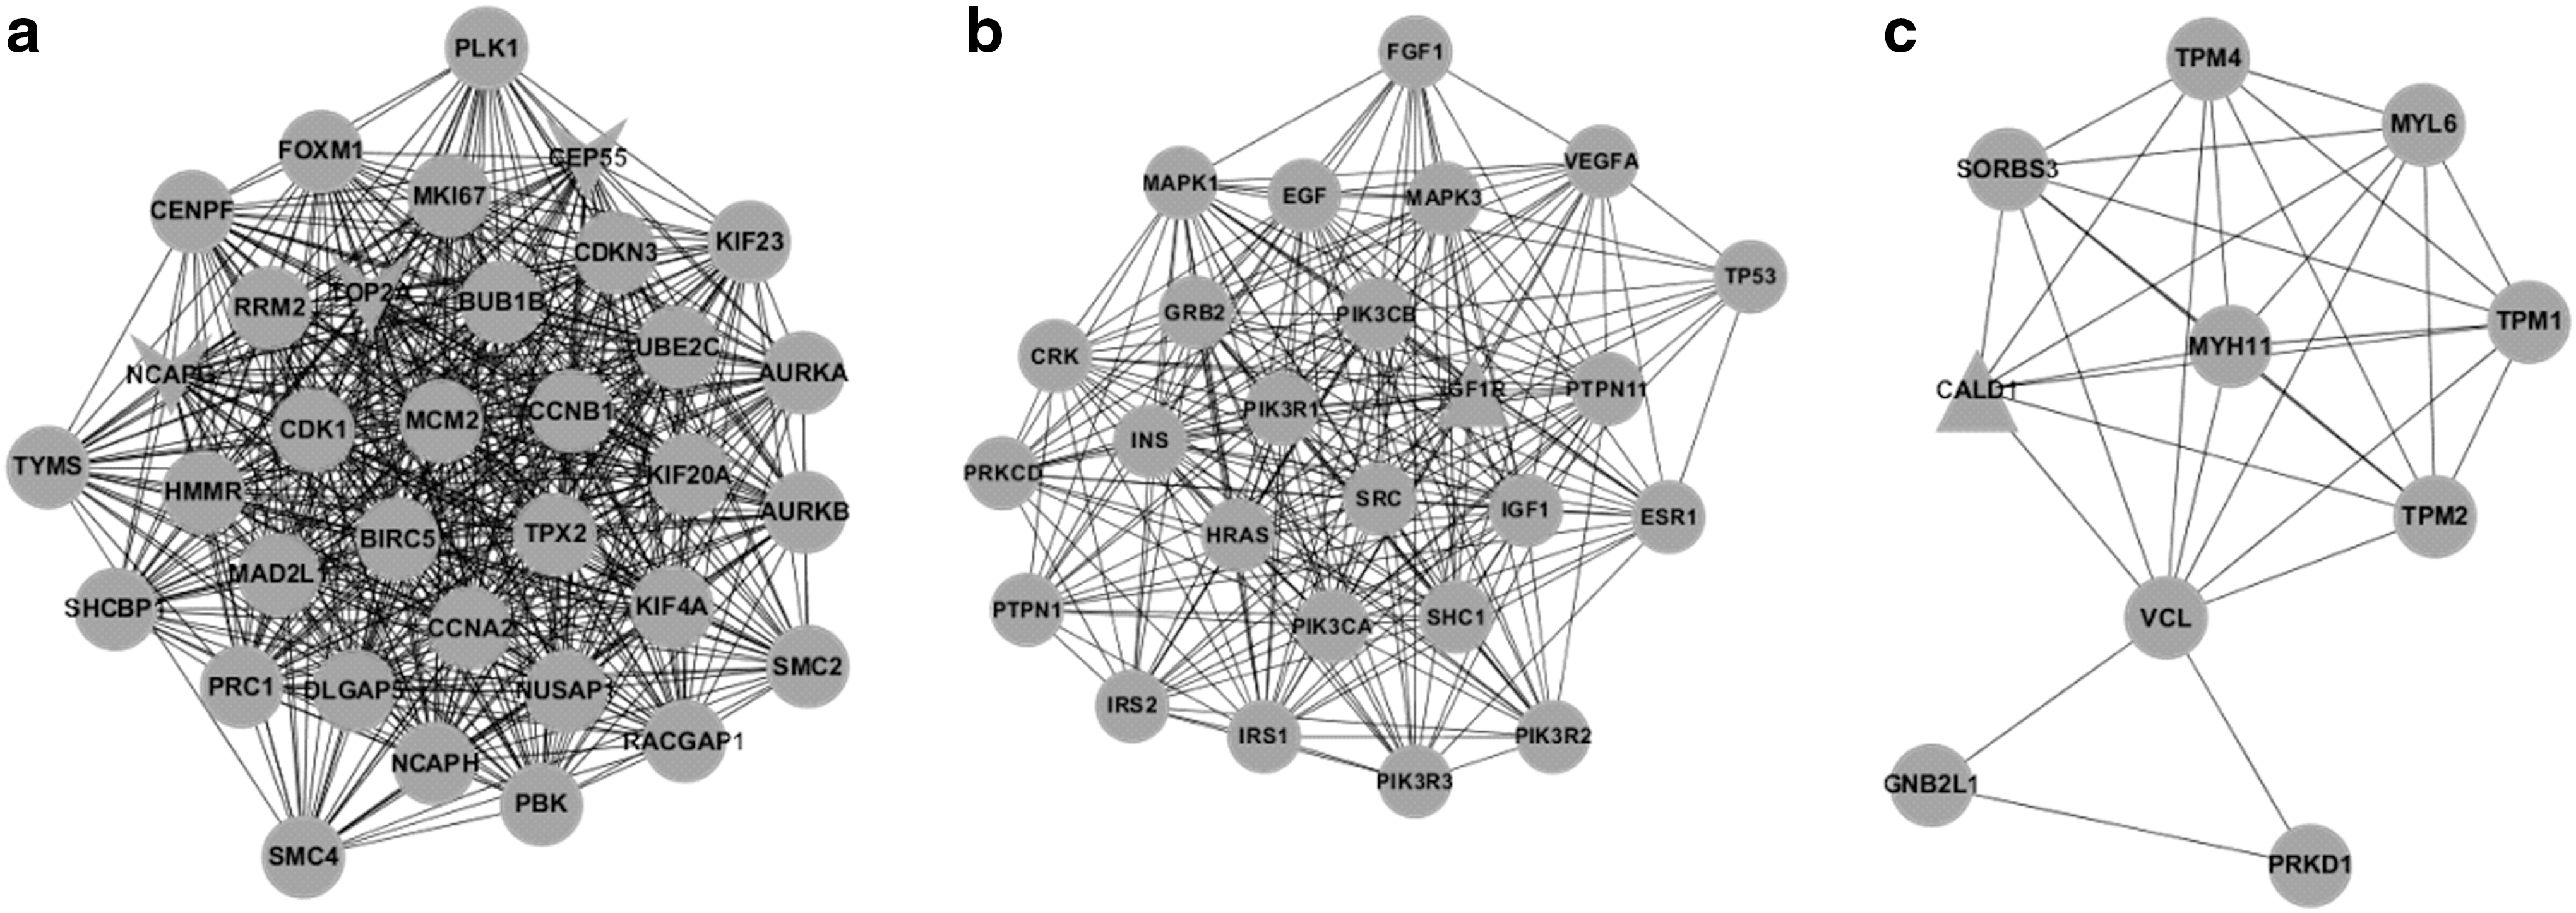
BINGO was used to annotate the modules and as a consequence, the enriched function within each module was obtained (Tables 2 and 3). For modules of CD4+ T cells, the functions were enriched in DNA repair, response to DNA damage stimulus (top two categories of module a), cell surface receptor-linked signaling pathway, system development (top two categories of module b), positive regulation of cellular process, and signaling pathway (top two categories of module c). Correspondingly, the GO categories of nuclear division, mitosis (top two categories of module a), signal transduction and transmission (top two categories of module b), and muscle contraction and system process (top two categories of module c) were significantly enriched in modules of CD8+ T cells.
FDR, false discovery rate.
Discussion
It is well known that HIV-1 is the pathogen that can cause AIDS. 23 We hypothesized that finding the difference in mutual DEGs between CD4+ and CD8+ T cells at different stages of infection would provide further insight into the mechanisms and explain why CD4+ but not CD8+ T cells undergo progressive depletion after HIV-1 infection.
There have been few studies focusing on analyzing the systemic characteristics of CD4+ T cells at different stages of HIV infection, or the difference between CD4+ and CD8+ T cells at the same stage. In this study, transcriptional profiles of CD4+ and CD8+ T cells from HIV-1-infected patients were compared with uninfected patients by DNA microarrays, in an attempt to determine the functional relationship between CD4+ and CD8+ T cells in HIV-1-infected patients.
BRCA1 was significantly enriched in several GO categories, such as cell proliferation and the cell cycle, in CD4+ and CD8+ T cells from acute HIV infection samples (Table 1) as well as the hub node of the PPI network. These results suggested that BRCA1 may play an important role in the progression of HIV-1 infection. Indeed, a previous study concerning the role of BRCA1 in HIV infection demonstrated that HIV-1 viral protein R (Vpr)-induced apoptosis was mediated via ART (Rad3-related protein) phosphorylation of BRCA1 and consequent up-regulation of GADD45α (growth arrest and DNA damage-45 protein α). 24 In a recent study, Buckley et al. proposed that BRCA1 can regulate interferon-gamma (IFN-γ) signaling through a mechanism involving the type I IFNs. 24 Meanwhile, evidence showed that type I IFNs were produced in response to microbial infections as part of the innate immune response. 25 Thus we considered that the involvement of BRCA1 in HIV-1 infection may be partly by regulating the IFN-γ signaling pathway.
Previous studies had confirmed that virus reproduction (over 99%) occurred mainly in CD4+ T cells inside the peripheral blood and lymphoid tissue. 26 And infection with HIV-1 can inhibit CD4+ T cell proliferation. Our results were consistent with the fact that the functions of DEGs in CD4+ T cells from acute HIV infection were correlated with cell proliferation.
Note that there were more down-regulated genes in CD8+ T cells than in CD4+ T cells, such as NCAPG, CEP55, OP2, and GF1R. We proposed that there was an apparent difference in DEGs between CD4+ and CD8+ T cells at various stages after HIV infection.
The functional modules in CD4+ T cells and CD8+ T cells (Figs. 5 and 6) suggested that the gene regulation patterns between CD4+ and CD8+ T cells were evidently different. In addition, the functional difference between the modules in CD4+ and CD8+ T cells that we observed in the current study was consistent with the studies indicating that specific CD8+ T cells play a leading role in directly fighting HIV-1 infection while CD4+ T cells mainly function through supporting CD8+ T cells and B cells. 27
In conclusion, the immune responses of CD4+ and CD8+ T cells at different stages after HIV-1 infection were different. Even at the same stage, the DEGs of CD4+ T cells were significantly different from those of CD8+ T cells. The specific DEGs in CD4+ and CD8+ T cells would likely provide a good clue to further elucidate the functional roles of different T cells in HIV infection, and potentially lead to the development of a promising method for AIDS vaccine design.
Footnotes
Author Disclosure Statement
No competing financial interests exist.