
Abstract
Human T cell leukemia virus type 1 (HTLV-1) preferentially infects CD4+ T cells and these cells play a central role in HTLV-1 infection. In this study, we investigated the global gene expression profile of circulating CD4+ T cells from the distinct clinical status of HTLV-1-infected individuals in regard to TAX expression levels. CD4+ T cells were isolated from asymptomatic HTLV-1 carrier (HAC) and HTLV-1-associated myelopathy/tropical spastic paraparesis (HAM/TSP) patients in order to identify genes involved in HAM/TSP development using a microarray technique. Hierarchical clustering analysis showed that healthy control (CT) and HTLV-1-infected samples clustered separately. We also observed that the HAC and HAM/TSP groups clustered separately regardless of TAX expression. The gene expression profile of CD4+ T cells was compared among the CT, HAC, and HAM/TSP groups. The paxillin (Pxn), chemokine (C-X-C motif ) receptor 4 (Cxcr4), interleukin 27 (IL27), and granzyme A (Gzma) genes were differentially expressed between the HAC and HAM/TSP groups, regardless of TAX expression. The perforin 1 (Prf1) and forkhead box P3 (Foxp3) genes were increased in the HAM/TSP group and presented a positive correlation to the expression of TAX and the proviral load (PVL). The frequency of CD4+FOXP3+ regulatory T cells (Treg) was higher in HTLV-1-infected individuals. Foxp3 gene expression was positively correlated with cell lysis-related genes (Gzma, Gzmb, and Prf1). These findings suggest that CD4+ T cell activity is distinct between the HAC and HAM/TSP groups.
Introduction
H
The disease manifestations occur in 2–5% of infected individuals, and most individuals remain asymptomatic throughout life. 11,12 The mechanisms that lead to disease in infected patients are not fully understood and a number of factors such as genetic, demographic, environmental, and others have been suggested to contribute to disease development. 13 –15
HAM/TSP is a chronic progressive inflammatory disorder of the central nervous system (CNS) characterized by slow progressive spastic paraparesis, bladder disorder, weakness of the lower limbs, and less conspicuous sensory signs. 16 The clinical course of HAM/TSP varies among patients, but is more common in females. 17 –19 Among several HTLV-1 genes, a transcriptional activator Tax may play a major role in the development of HAM/TSP, regulating multiple cellular responses by protein–protein interactions with various host cell factors. Moreover, Tax has been shown to disrupt cell cycle and DNA repair checkpoint, inactivate several tumor suppressors, and stimulate cell growth, while protecting against apoptosis. 20,21
Although HTLV-1 is known to infect a wide range of human and nonhuman cells in vitro, HTLV-1 preferentially infects CD4 T cells, which become the main reservoir of HTLV-1. 22 It is also known that CD4 T cells predominate in the spinal cord mononuclear infiltrate of HAM/TSP patients. 23 In this way, in the early stages of the inflammatory process, cytokines such as interleukin (IL)-1α, tumor necrosis factor (TNF)-α, and interferon (IFN)-γ are spontaneously secreted by these cells. 24 Thus, the potential contribution of CD4 T cells to the pathogenesis of this inflammatory disease as well as their expansion in HAM/TSP is more efficient due to the chronic antigenic stimulation that occurs in these individuals. 25,26
The aim of this work was to identify genes differentially expressed among healthy control (CT), asymptomatic HTLV-1 carrier (HAC), and HAM/TSP patients in CD4+ T cells isolated from these individuals. We showed that the global gene expression profile of circulating CD4+ T cells from HTLV-1 individuals harboring distinct clinical status was altered regardless of TAX expression levels. Considering that most HTLV-1-infected individuals remain asymptomatic throughout life we explored genes that could be involved with HAM/TSP development.
Materials and Methods
HTLV-1-infected individuals and healthy controls
A total of 47 peripheral whole blood samples from HTLV-1-infected individuals were obtained and divided into two groups: the asymptomatic HAC group comprised of 26 individuals and the HAM/TSP group comprised of 21 symptomatic patients. Healthy controls (CT; n=28) had no previous or current infectious diseases caused by blood-borne pathogens. Samples of the CT individuals were recruited from the Regional Blood Center of Ribeirão Preto, São Paulo, Brazil, and HTLV-1-infected individuals were recruited from the Neurology Department of the Clinical Hospital of the Medical School of the University of São Paulo, Ribeirão Preto, São Paulo, Brazil.
The study was approved by the Institutional Ethics Committee (process number 3083/2007) and all individuals signed an informed consent before enrollment. All HTLV-1-infected individuals were evaluated for clinical status according to the criteria previously described for ATLL and HAM/TSP. 27 To be included in this study, the HTLV-1-infected individuals must have serological (rp21e-enhanced EIA; Cambridge Biotech) and molecular [conventional long-term repeat (LTR) and TAX polymerase chain reaction (PCR)] confirmation of the HTLV-1 infection.
All HTLV-1-infected and CT individuals included in this study presented negative serology for other relevant blood-borne pathogens including hepatitis B virus, hepatitis C virus, human immunodeficiency virus, Chagas disease, and syphilis. Hemogram and CD4 and CD8 T cell counts were performed for all individuals.
Molecular diagnosis and proviral load
Genomic DNA was extracted using the Super Quick Gene DNA isolation kit (Analytical Genetic Testing Center–AGTC, Denver, CO) following the manufacturer's instructions. The in house PCR (LTR and Tax regions) tests were as previously described. 28 The proviral load was quantified using TaqMan Universal PCR Master Mix (Applied Biosystems, Foster City, CA) and specific primers of the HTLV-1 Tax region. The reaction was composed of 500 ng of genomic DNA, 6.25 μl TaqMan Universal PCR Master Mix, 5 μM of the forward primer (5′-CCC ATC GAT GGA CGC GT-3′), 5 μM of the reverse primer (5′-CTC CTT CCC CAC CCA GAG AA-3′), and 5 μM of the specific probe (5′-FAM-CGG CTC AGC TCT ACA G-3′-MGB). Human β-actin (Actb) was used as the endogenous control (TaqMan Gene Expression Assays–Hs03023880_g1) (Applied Biosystems, Foster City, CA). Serially diluted (from 105 to 101 copies) DNA from HTLV-1-infected MT-2 cells was used for generating standard curves for the HTLV-1 Tax gene. Real-time PCR was performed in duplicate for all DNA standards and samples using the ABI Prism 7500 Sequence Detection System (Applied Biosystems, Foster City, CA) with the following conditions: 50°C for 2 min, 95°C for 10 min, followed by 40 cycles at 95°C for 15 s/60°C for 1 min. Proviral load was calculated using the following formula: (copy number of Tax)/(copy number of β-actin)×2×100,000.
CD4+ T cell isolation
Peripheral blood mononuclear cells (PBMCs) were isolated by Ficoll Hypaque PLUS (GE Healthcare Bio-Sciences AB, Uppsala, Sweden). CD4+ T cells were then isolated from PBMCs by positive selection using immunomagnetic beads (Miltenyi Biotec GmbH, Bergisch Gladbach, Germany) and the purity of the CD3+CD4+ T cells was confirmed by flow cytometry using the surface markers anti-CD4-FITC and anti-CD3-PE (FACSCalibur, Becton & Dickinson, San Jose, CA).
Microarray analysis
Twelve samples underwent microarray analysis, as follows: four CT, four HAC, and four HAM/TSP samples. The criterion used to select HTLV-1-infected individuals was TAX expression levels in PBMCs as assessed by flow cytometry. Two samples had high TAX expression and two samples had low TAX expression for both groups (Table 1). All samples had purity above 90%. We considered high TAX expression levels those with values higher than 1.39% (obtained by the median of all HTLV-1-infected individuals). In these samples, proviral load correlated with TAX expression (data not shown). Total RNA was isolated with TRIzol Reagent (Invitrogen, Carlsbad, CC) and purified with the RNeasy Mini Kit (Qiagen, Hilden, Germany).
Characteristics according to gender, age, TAX expression in CD4+ T cells, leukocyte global count, absolute count of CD4/CD8, and purity of CD4+ T cells.
HTLV-1, human T cell leukemia virus type 1; HAC, asymptomatic HTLV-1 carrier; HAM/TSP, HTLV-1-associated myelopathy/tropical spastic paraparesis; F, female; M, male.
One color microarray-based gene expression analysis (Quick Amp Labeling) (Agilent, Santa Clara, CA) was done according to the manufacturer's instructions. The microarray was scanned with an Axon GenePix 4000B Microarray Scanner (Molecular Devices, Sunnyvale, CA) and data were processed using Feature Extraction software version 9.5.1 (Agilent, Santa Clara, CA). Quality control and array normalization were done in R environment at (
Real-Time RT-PCR
Total RNA was reverse transcribed (RT) using the High Capacity cDNA Reverse Transcription Kit (Applied Biosystems, Foster City, CA) following the manufacturer's instructions. Differentially expressed genes were validated by a real-time PCR technique using TaqMan Gene Expression Assays (Applied Biosystems, Foster City, CA). The PCR amplification and fluorescence data collection were performed with ABI 7500 Sequence Detection (Applied Biosystems, Foster City, CA).
The following genes were validated: granzyme A (Gzma) (Hs00196206_m1), granzyme B (Gzmb) (Hs00188051_m1), perforin 1 (Prf1) (Hs00169473_m1), chemokine (C-X-C motif ) receptor 4 (Cxcr4) (Hs00237052_m1), paxillin (Pxn) (Hs01104424_m1), forkhead box P3 (Foxp3) (Hs01085834_m1), and interleukin 27 (IL27) (Hs00377366_m1).
The housekeeping genes β-actin (Actb) (4326315E), glyceraldehyde-3-phosphate dehydrogenase (Gapdh) (4310884-E), β2-microglobulin (B2m) (4333766-0710013), and ribosomal protein L13a (Rpl13a) (185720330-7) 29 were used to normalize sample loading (Applied Biosystems). The 2−ΔΔCt method was used to calculate the relative expression levels. 30 All the reactions were duplicated.
Flow cytometry analysis
TAX expression was detected in PBMCs. Cells were cultured in RPMI 1640 (Sigma-Aldrich, Saint Louis, MO) containing 10% fetal calf serum (HyClone, Logan, UT) and 20 nM concanamycin A (Sigma-Aldrich, St. Louis, MO) for 12 h under 5% CO2 at 37°C.
A total of 2.5×10⁵ cells were stained for surface markers anti-CD4-PE, anti-CD8-PerCP, and anti-CD3-APC (Becton & Dickinson, San Jose, CA). For intracellular analysis, cells were fixed with 4% paraformaldehyde in phosphate-buffered saline (PBS) for 20 min.
Fixed cells were washed with PBS containing 4% normal goat serum (NGS) (Sigma) and then washed with PBS containing 0.1% Triton X-100 (Sigma) for 10 min at room temperature. Permeabilized cells were washed and resuspended in PBS/4% NGS containing an anti-HTLV-I TAX monoclonal antibody (mAb) (Lt-4; IgG3), antihuman-PRF1-clone δG9, antihuman-GZMB-clone GB11 (Becton & Dickinson, San Jose, CA), or an isotype control mAb (Southern Biotechnology Associates, Birmingham, AL) for 30 min at room temperature. For intracellular TAX detection, cells were stained with Alexa Fluor 488-labeled goat antimouse IgG3 (Invitrogen, Carlsbad, CA) for 30 min at room temperature.
For CXCR4 detection, 150 μl of whole blood and 5 μl of antibodies anti-CD4-FITC, anti-CD3-PerCP, and anti-human-CXCR4-PE-clone 12G5 (Becton & Dickinson, San Jose, CA) were used. The reaction was incubated for 15 min and then 1 ml of FACS Lysing Solution (1×) (Becton & Dickinson, San Jose, CA) was added. All samples were analyzed on a FACSCalibur flow cytometer (Becton & Dickinson, San Jose, CA).
For FOXP3 expression, isolated PBMCs were immunostained with a saturating concentration of anti-CD25-FITC, anti-CD4-PerCP, and anti-CD3-APC for 15 min at room temperature. Then 1 ml of FACS Lysing Solution (1×) (Becton & Dickinson, San Jose, CA) was added. Cells were permeabilized using FACS Permeabilizing Solution 2 (Becton & Dickinson, San Jose, CA) and stained intracellularly for 10 min with antihuman-FOXP3-PE-clone 259/C7. Finally, the cells were washed with PBS and analyzed on a FACSCalibur flow cytometer (Becton & Dickinson, San Jose, CA).
Statistical analysis
Data were analyzed in GraphPad PRISM, version 5.01 (GraphPad software California) using nonparametric statistical tests. The results from quantitative PCR and flow cytometry were analyzed using a one-tailed Mann–Whitney U-test. The correlations among different parameters were assessed with Spearman's rank correlation. In all these cases, statistically significant differences were considered when p values were ≤0.05.
Results
Clinical and demographic data
The clinical and demographic data of patients are shown in Table 2. A total of 75 individuals were included in our study of which 51 were female (68%). The mean onset age in the HAM/TSP group was 54.9 years (ranging from 37 to 74 years), which was higher than the CT (mean 46.5 years) and HAC groups (mean onset age 42.9 years). Proviral load was increased (1.8×) in the HAM/TSP group (p=0.0024) when compared to the HAC group (data not shown). TAX expression positively correlated with proviral load (r=0.7433; p<0.0001) and the percentage of CD4+ T cells expressing TAX was higher in the HAM/TSP group (data not shown). No differences were observed in leukocyte global counts and CD4/CD8 ratio among groups.
Proviral load copy number/105 cells.
p≤0.01 (unpaired t test).
Table shows average values. CT, healthy controls; HAC, asymptomatic HTLV-1 carrier; HAM/TSP, HTLV-1-associated myelopathy/tropical spastic paraparesis; F:M, female/male ratio.
Global gene expression in CD4+ T cells
The microarray platform was tested with 12 individual samples divided according to patients' clinical status and TAX expression as follows: CT (n=4), HAC (n=4; composed of two samples with high TAX expression and two with low TAX expression), and HAM/TSP group (n=4; composed of two samples with high TAX expression and two with low TAX expression). We used a hierarchical clustering to group samples according to their gene expression levels. Dendrogram analysis showed that clustering of CD4+ T cells allowed a clear separation between CT and HTLV-1-infected individuals. We also observed that the HAC and HAM/TSP groups clustered apart (Fig. 1). However, HTLV-1 CD4+ T cell clustering did not correlate with TAX protein expression.
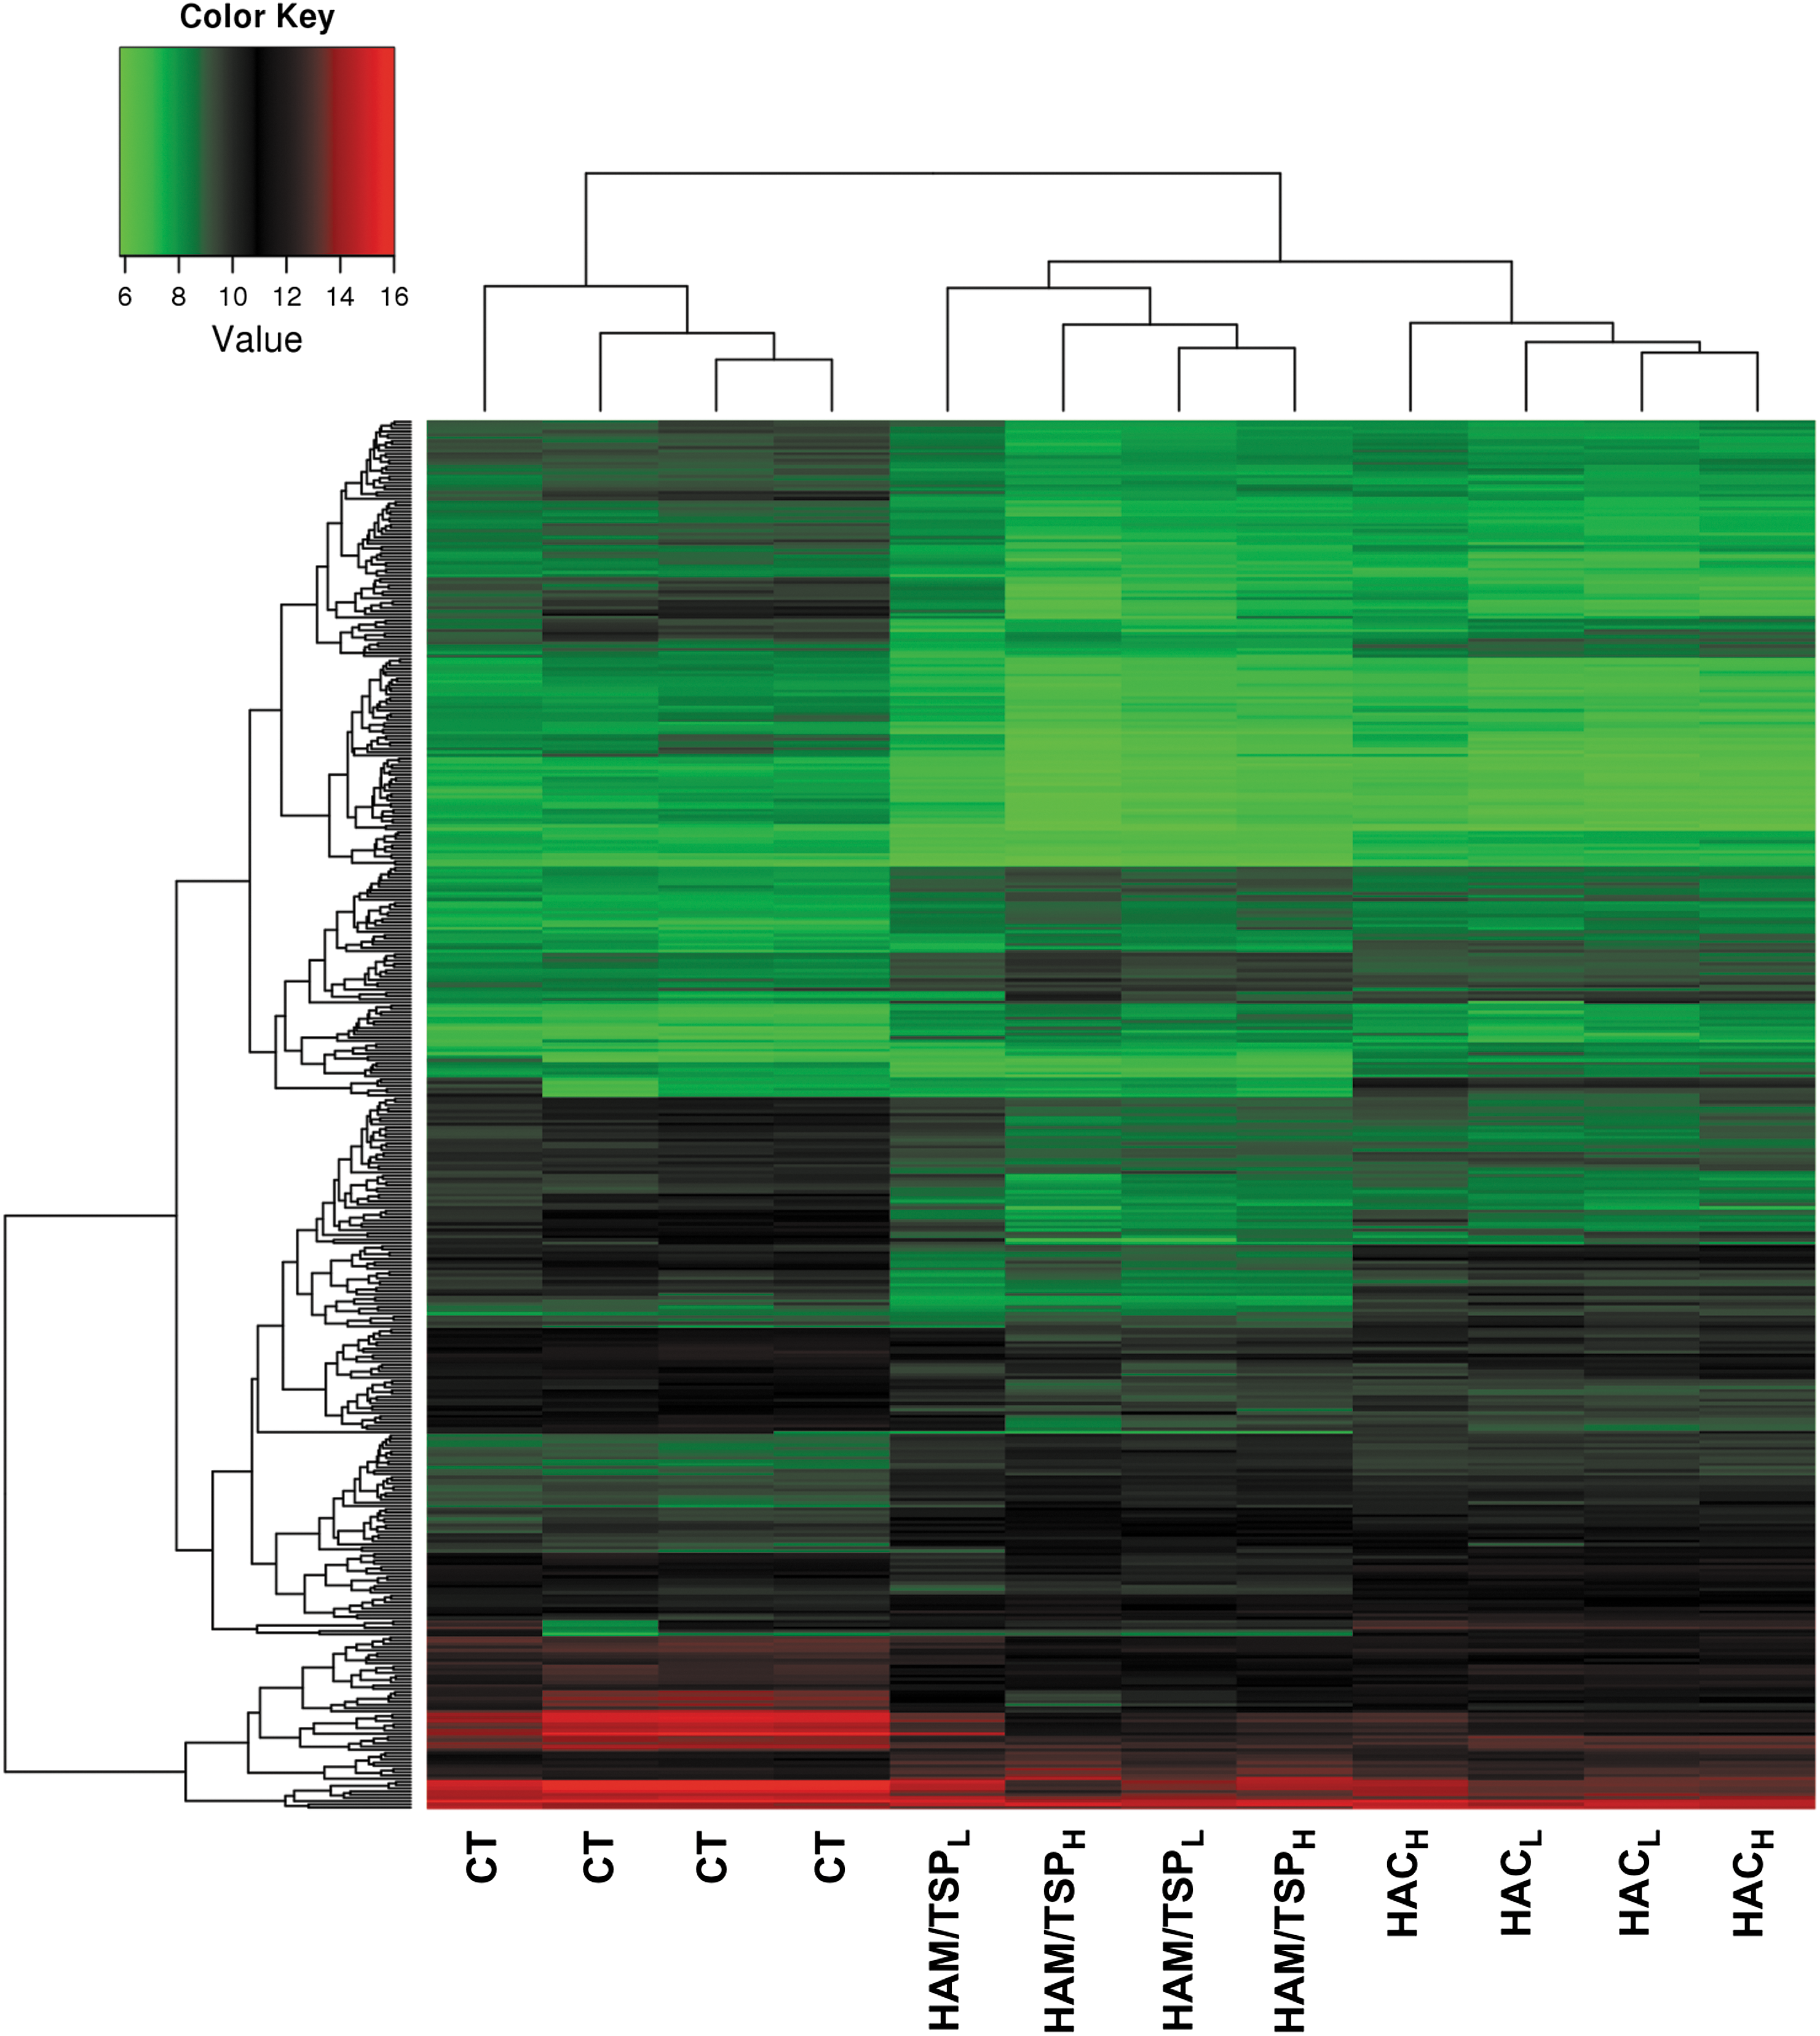
Gene expression heat map and dendrogram of CD4+ T cells. Hierarchical clustering of all detected genes showed a clear clustering of CT, HAC, and HAM/TSP samples using an average linkage and Euclidian distance metric. Expression values from all microarrays were used to group transcription profiles according to their similarities among groups. The heat map shows a distinct gene expression profile in the three groups analyzed. Rows indicate the relative levels of expression for a single gene, and columns show the expression level for a single sample. Green and red colors indicate those genes with lower and higher expression levels, respectively. CT, healthy control; HAC, asymptomatic human T cell leukemia virus type 1 (HTLV-1) carrier; HAM/TSP, HTLV-1-associated myelopathy/tropical spastic paraparesis; HACL, low TAX expression; HACH, high TAX expression; HAM/TSPL, low TAX expression; HAM/TSPH, high TAX expression.
Gene expression analysis
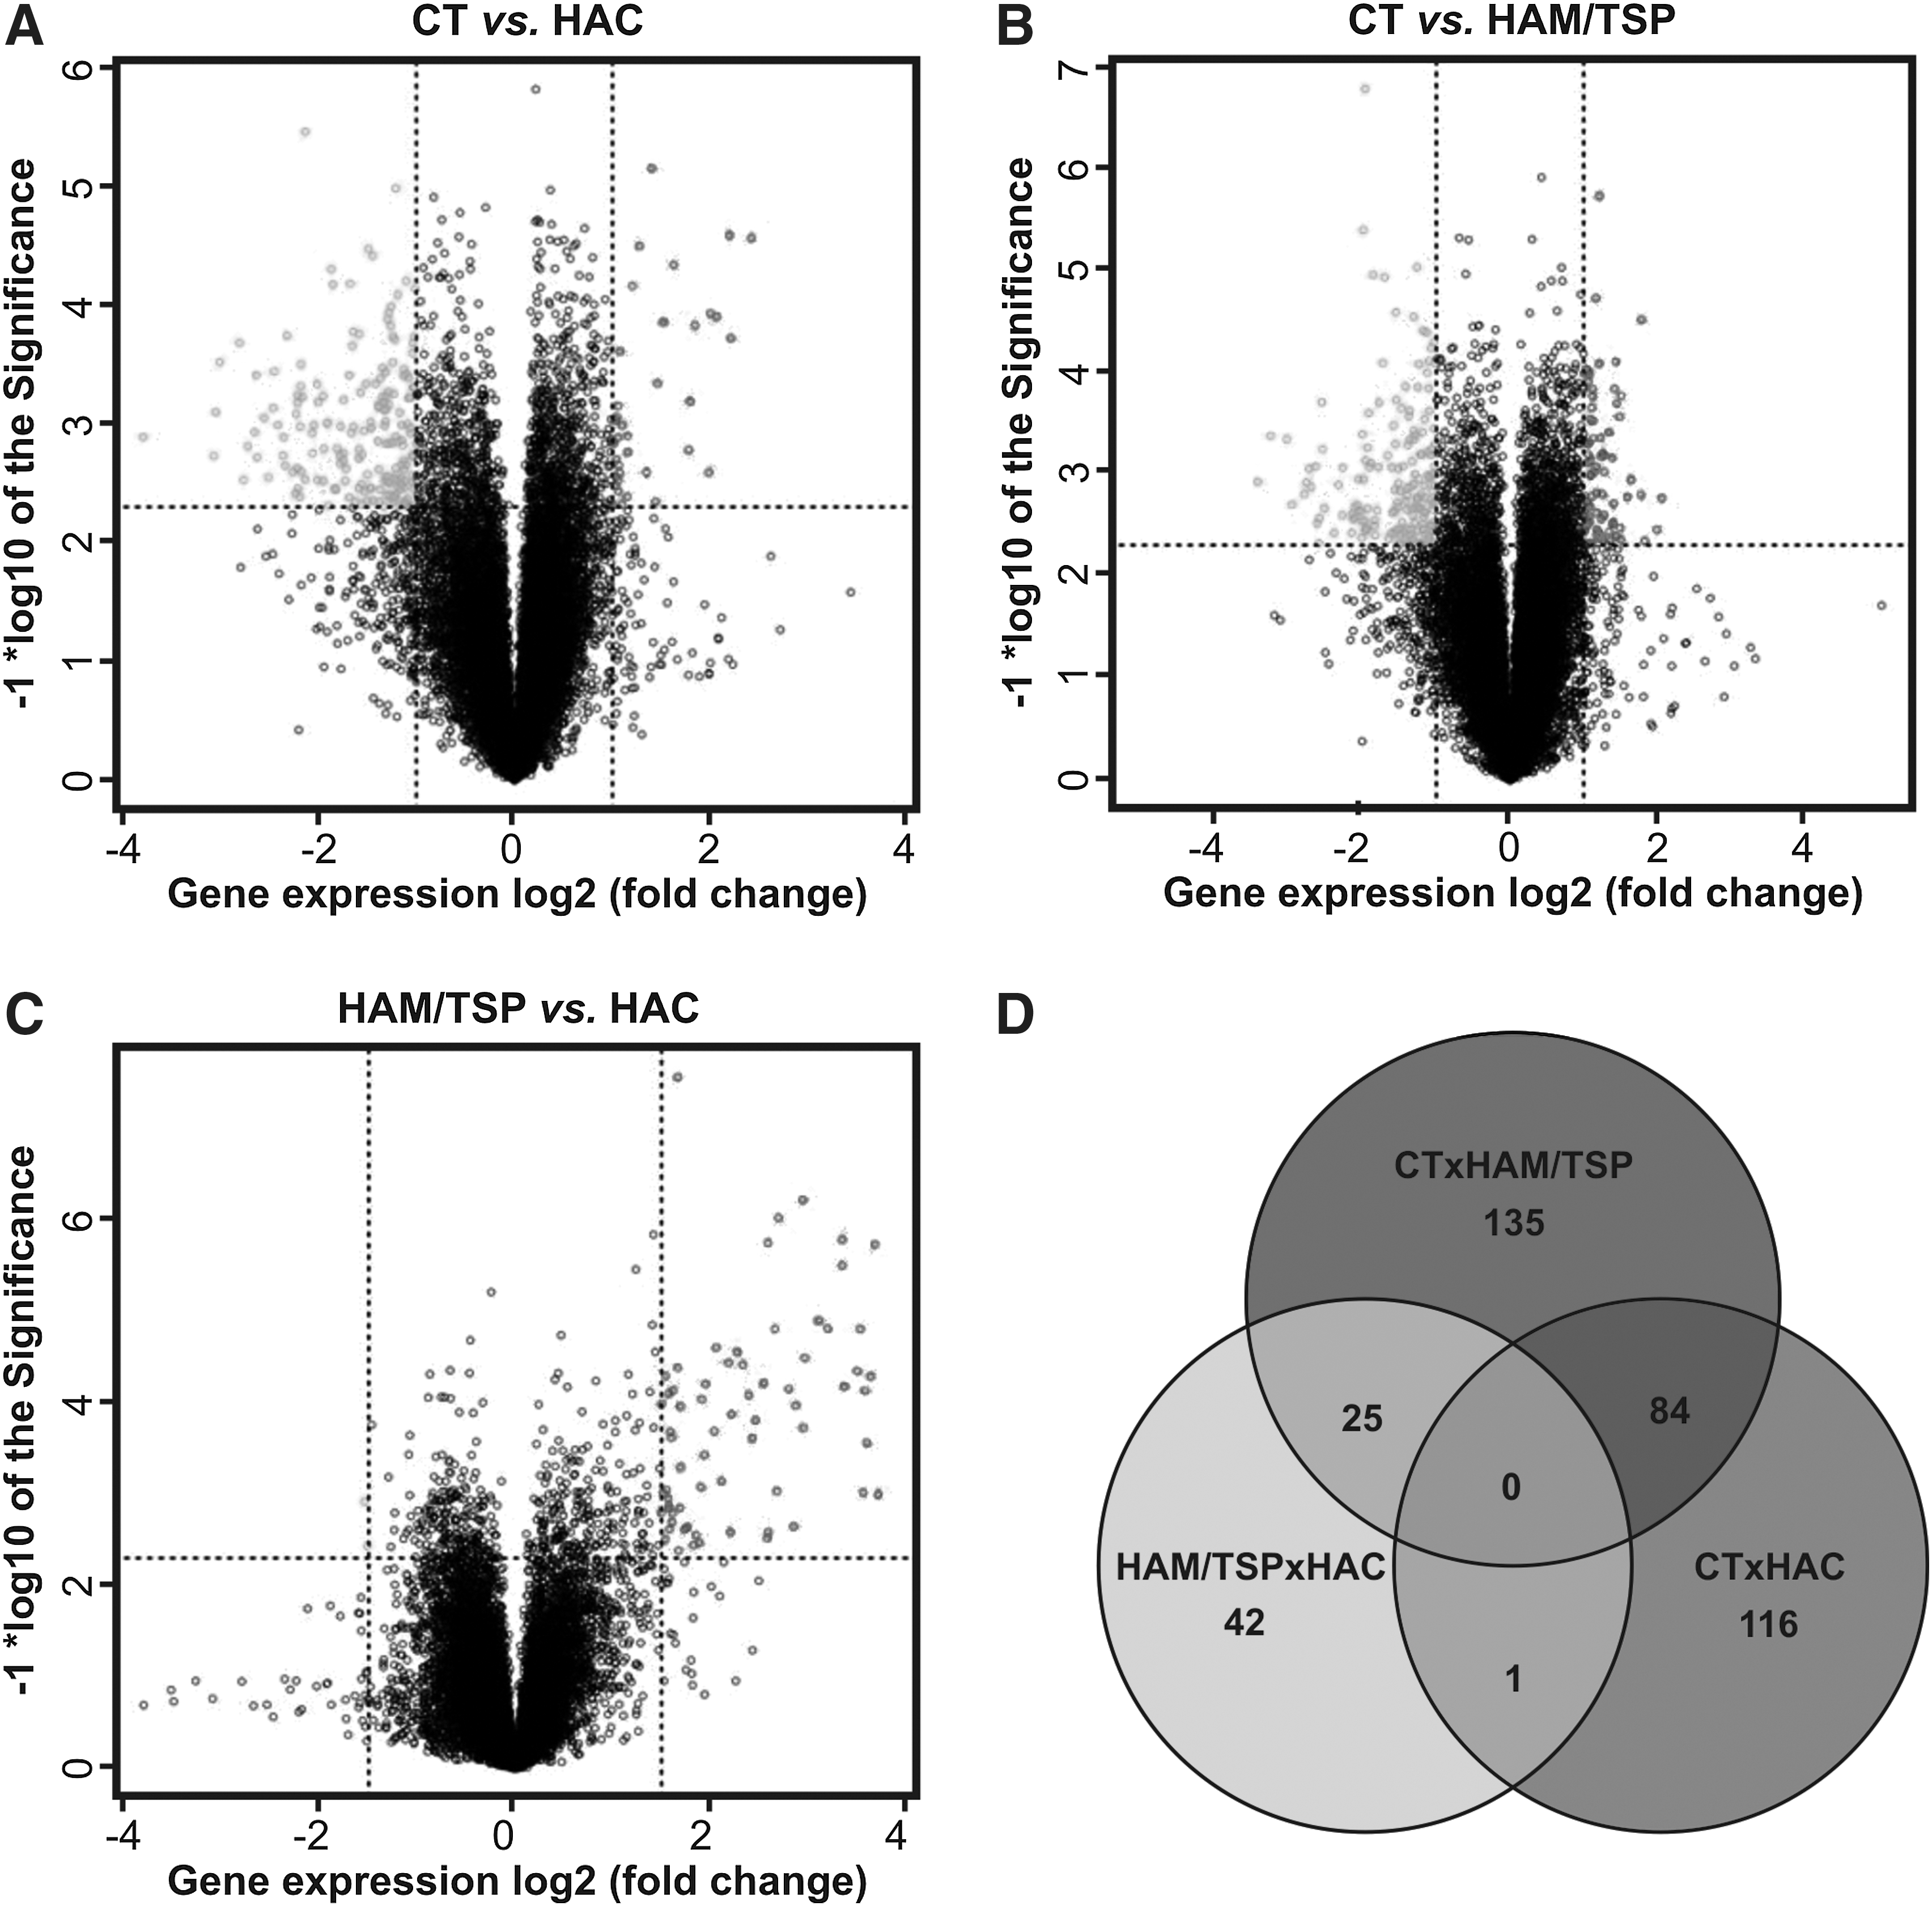
A total of 45,015 probes were screened by the Agilent microarray platform. The background correction, filtering, normalization, and summarization of probes were performed using the Agi4x44PreProcess package resulting in 27,061 distinct probes, from which only 19,668 remained in the subsequent analysis after the filtering of probes annotated as ribosomal proteins, or in sexual chromosomes or unannotated probes. In microarray analysis, genes were considered differentially expressed on the basis of a log2-fold change of 2-fold at least and a statistically significant level using a t-test (p value<0.005). We found 201 differently expressed genes between the CT and HAC groups (166 genes down-regulated and 35 genes up-regulated in the HAC group), 244 genes between the CT and HAM/TSP groups (165 genes down-regulated and 79 genes up-regulated in the HAM/TSP group), and 68 genes between the HAC and HAM/TSP groups (66 genes down-regulated and 2 genes up-regulated in the HAM/TSP group) (Fig. 2A–C). Additionally, we determined which genes were in common among these groups (Supplementary Tables S1–S6 (Supplementary Data are available online at
Differently expressed genes among the CT, HAC, and HAM/TSP groups. Differently expressed genes between the CT and HAC groups
Genes related to cell migration were up-regulated in the HAM/TSP group
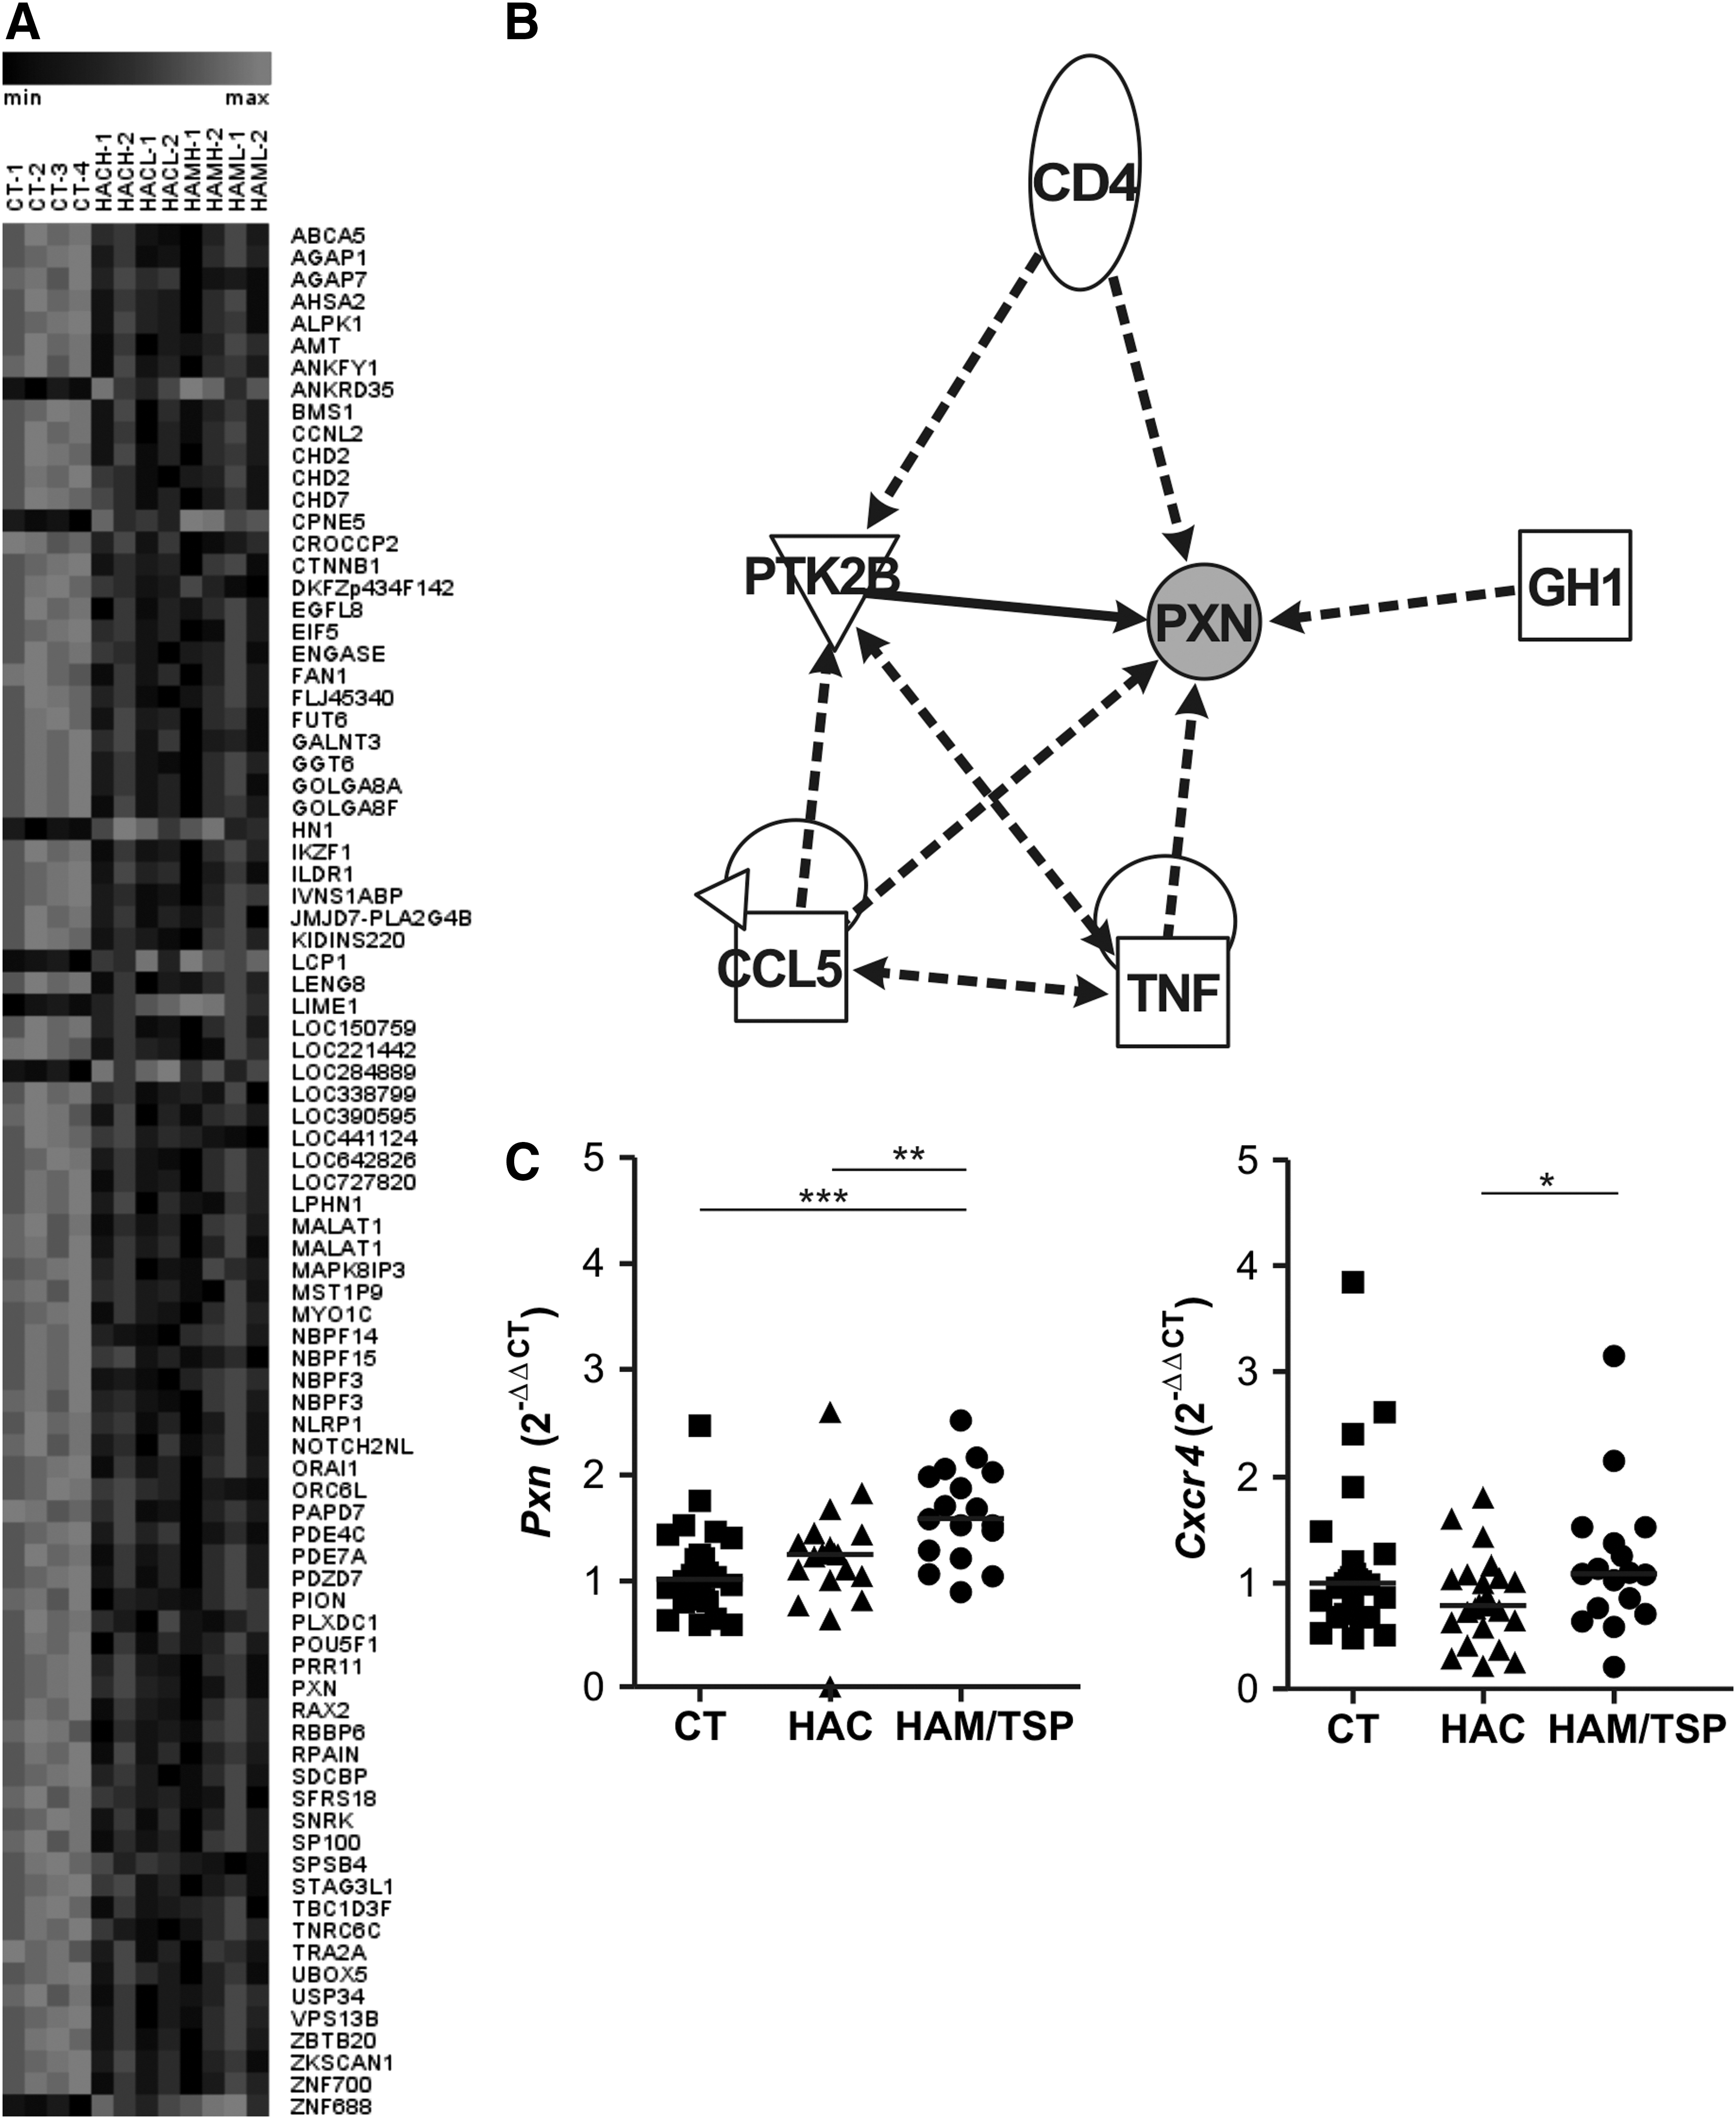
Eighty-four differentially expressed genes in common were observed between CT vs. HAC and CT vs. HAM/TSP analysis, with most of them overexpressed in the CT group (Fig. 3A). In silico analysis demonstrated that six genes, namely paxillin (Pxn), CD4, Ptk2b, Ccl5, Tnf, and Gh1, were represented in a network that is related to apoptosis, inflammatory and immunological diseases, cell–cell interaction, movement and repair of cell functions, and cell migration (Fig. 3B). The Pxn gene was also present in the Cxcr4 pathway that is responsible for cell migration. The global gene expression profile showed that Pxn was increased in the CT group compared to the HAC (fold change: 5.1, p=0.0913) and HAM/TSP groups (fold change: 8.2, p=0.0002). The Pxn and Cxcr4 genes were validated by quantitative real-time PCR (qPCR) and both of them showed an increased expression in HAM/TSP individuals (Fig. 3C). The level of Pxn gene expression was increased in HTLV-1-infected individuals (p=0.0022) (data not shown). Moreover, the CXCR4 protein was analyzed by flow cytometry among the groups, but no statistically significant difference was observed (data not shown).
Expression profiling of genes differentially expressed in HTLV-1.
IL27 gene expression is higher in HAC individuals
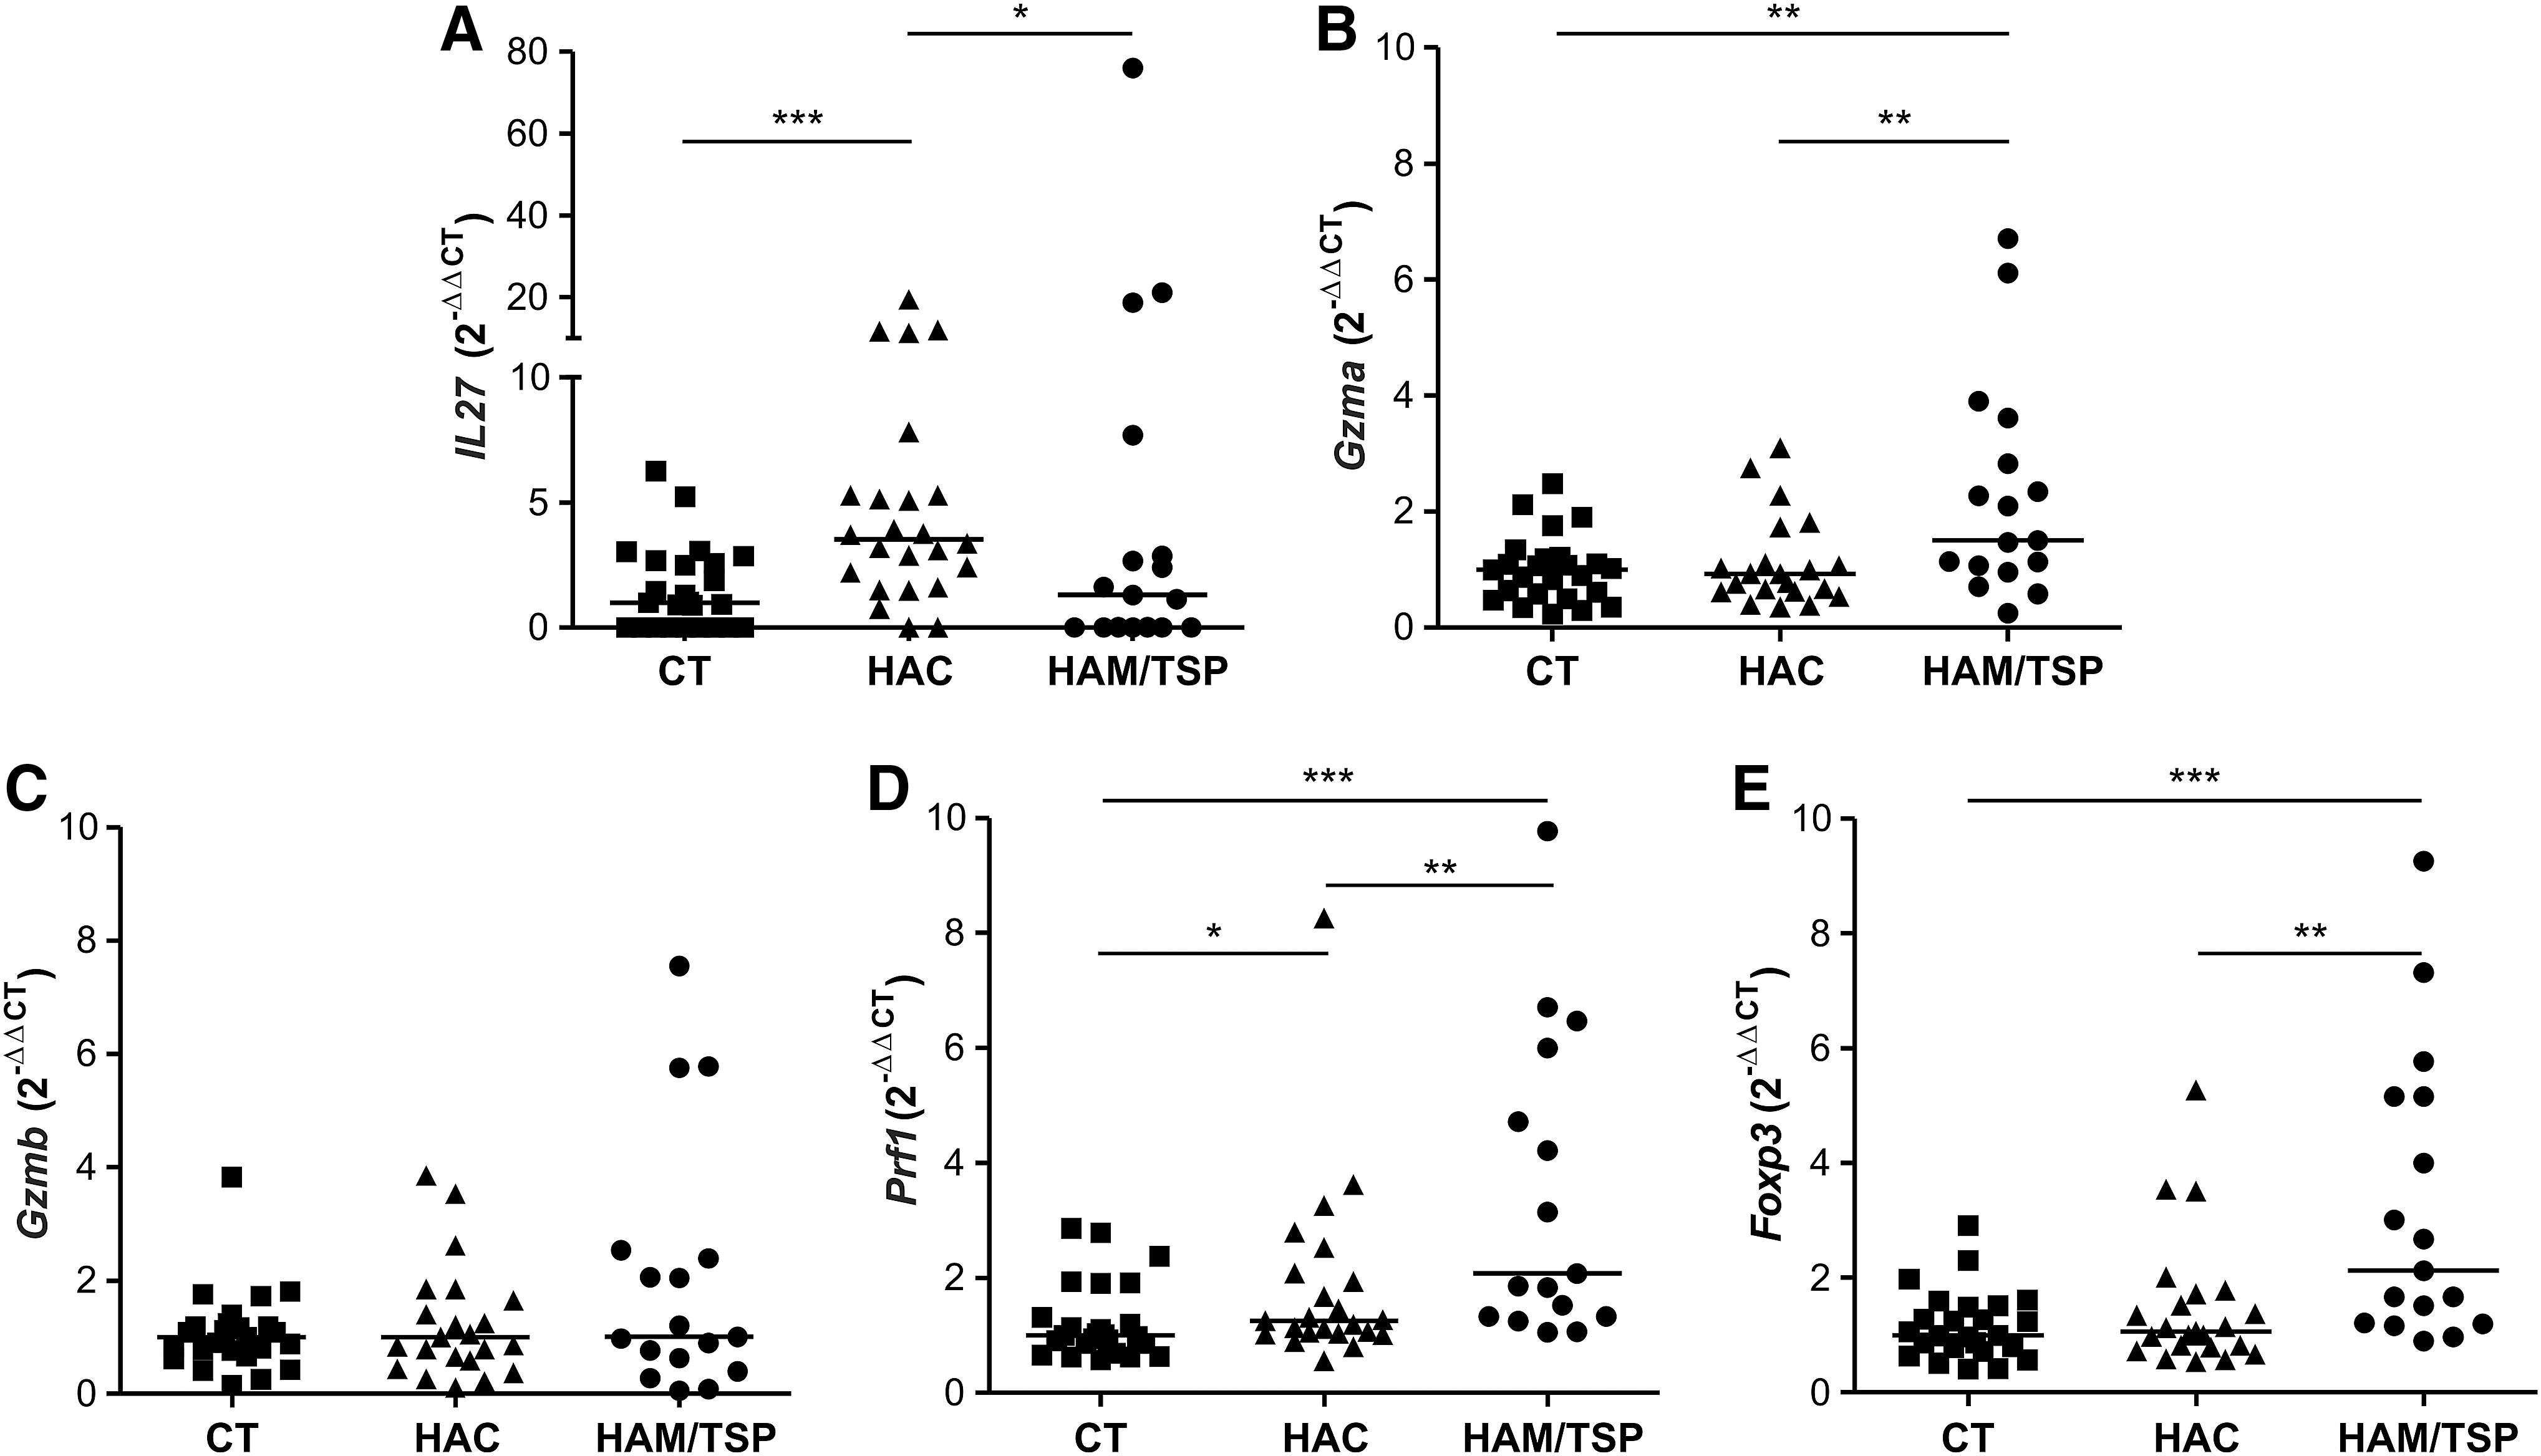
Forty-two differentially expressed genes exclusive between HAC and HAM/TSP analysis were found. These genes were related to cell–cell interaction, inflammatory response, and cellular immune response, which include interleukin 27 (IL27). A global gene expression profile showed that IL27 was increased in the HAC group compared to the HAM/TSP groups (fold change: 5.24). This result was validated by qPCR in which levels of IL27 gene expression were higher in the HAC group compared to the HAM/TSP group (p=0.0392) (Fig. 4A). Additionally, IL27 gene expression was higher in HTLV-1-infected individuals compared to the CT group (p=0.0019) (data not shown).
IL27, Gzma, Gzmb, Prf1, and Foxp3 gene expression by real-time PCR. Gene expression levels comparison of IL27
HAM/TSP CD4+ T cells had higher expression of cell lysis-related genes
The 25 differentially expressed genes in common between CT vs. HAM/TSP and HAM/TSP vs. HAC analyses were evaluated for their participation in signaling pathways and only three pathways were observed, among them granzyme A (Gzma). Although the Gzma gene was not in accordance with the parameters of analyses (2-fold and p value 0.005), the global gene expression profile showed that Gzma was increased in the HAM/TSP group compared to the CT (fold change: 1.9, p=0.0038) and HAC groups (fold change: 1.9, p=0.0071). For that reason, this gene was selected for validation due to it being poorly studied on CD4+ T cells infected by HTLV-1 and due to its possible involvement in HAM/TSP development.
The levels of Gzma gene expression were evaluated (Fig. 4B) and we observed an increase in the HAM/TSP group compared to the CT (p=0.0038) and HAC (p=0.0071) groups. Therefore, we suggest that other genes related to cell lysis could also be increased in the HAM/TSP group, such as Gzmb and Prf1. Therefore, we analyzed Gzmb and Prf1 gene expression (Fig. 4C and D). The HAM/TSP group showed higher gene expression levels of Prf1 compared to the CT (p<0.0001) and HAC (p=0.0037) groups. Prf1 gene expression was increased (p=0.003) in HTLV-1-infected individuals when compared to the CT group (data not shown). No difference was observed in gene expression level of Gzmb among the three groups. GZMB and PRF1 proteins were analyzed by flow cytometry; however, no difference was observed among the CT, HAC, and HAM/TSP groups (data not shown).
It was reported that regulatory T cells (Treg) have cytolytic capacity and perforin/granzyme pathways are required for this activity. 31 Foxp3 gene expression, one of the main Treg cell markers, was also evaluated (Fig. 4E). As expected, we notice an overexpression of Foxp3 in the HAM/TSP group compared to the CT and HAC groups (p=0.0003 and p=0.0016, respectively). Foxp3 gene expression was increased in HTLV-1-infected individuals (p=0.0128) compared to CT individuals (data not shown).
The lysis-related genes were correlated with Foxp3 expression and Prf1 and Foxp3 genes were correlated with TAX expression and proviral load (PVL)
Since the Gzma, Prf1, and Foxp3 genes were shown to have an increased expression in HAM/TSP individuals, we thought these genes could be correlated. We performed Spearman's correlation test and verified that the Gzma, Gzmb, and Prf1 genes were positively correlated with Foxp3 gene expression (Fig. 5A–C). We evaluated whether all the genes analyzed in this study (Pxn, Cxcr4, IL27, Gzma, Gzmb, Prf1, and Foxp3 genes) were correlated with TAX viral protein expression and PVL values. However, only the Prf1 and Foxp3 genes presented a positive correlation with TAX expression and the PVL (Fig. 5D–G).
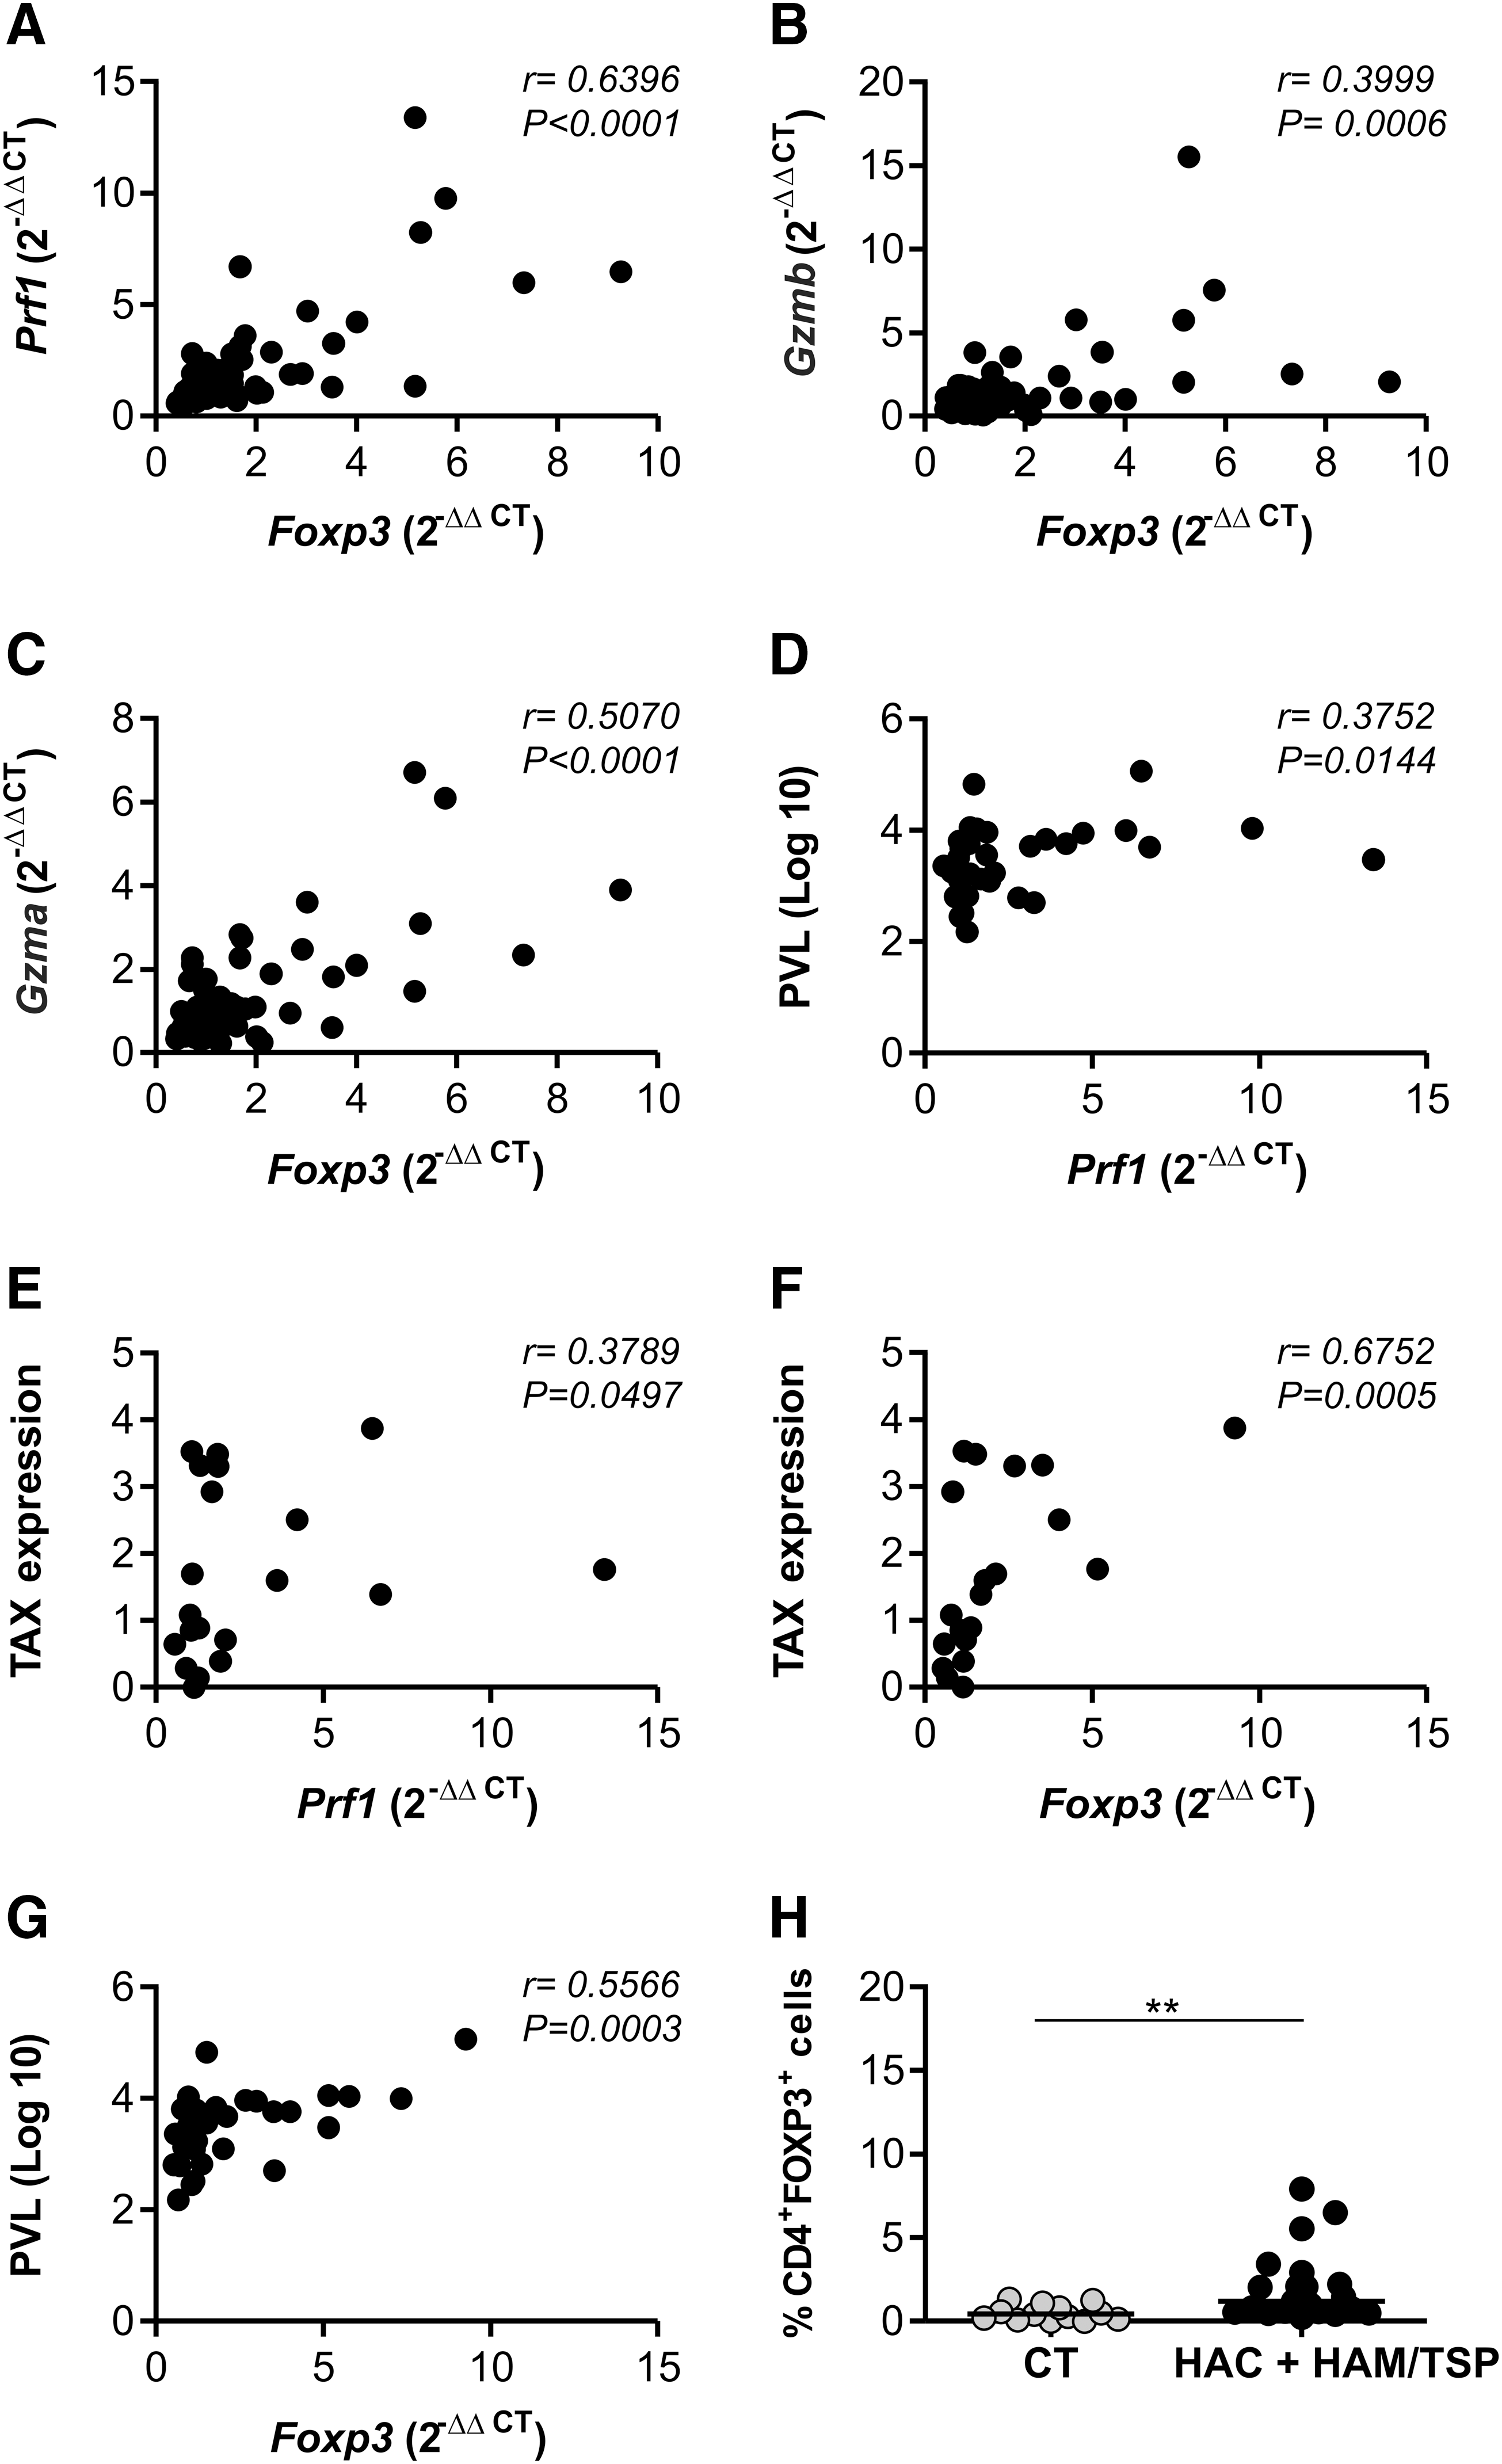
Correlation between cell lysis-related genes and Foxp3 in CD4+ T cells, percentage of TAX expression, and proviral load in peripheral blood mononuclear cells (PBMCs). The Foxp3 expression in CD4+ T cells positively correlated with Prf1
CD4+FOXP3+ cell percentage was increased in HTLV-1-infected individuals
The phenotype CD4+FOXP3+ is used to identify a major population of Tregs. 32 Thus we analyzed CD4+FOXP3+ cell percentage in the CT, HAC, and HAM/TSP groups. The percentage of CD4+FOXP3+ cells was consistently higher (p=0.0017) in HTLV-1-infected individuals than in the CT group (Fig. 5H). The analyses have revealed an increase (8×) in the HAC group compared to the CT group (p=0.0016) and an increase (3×) in the HAM/TSP group compared to the CT group (p=0.0128) (data not shown).
Discussion
We demonstrated that the gene expression profile in CD4+ T cells differs between the HAC and HAM/TSP groups regardless of TAX expression. It has been well established that HAM/TSP individuals have an HTLV-1 PVL and TAX expression higher than asymptomatic individuals. 33 –36 These findings suggest that the risk of HTLV-1 inflammatory diseases strongly correlates with PVL. 37 Here, we demonstrated that PVL and TAX expression of CD4+ T cells positively correlated in HTLV-1-infected groups, being higher in the HAM/TSP group. This observation reinforced the fact that these cells may contribute to the progression of HTLV-1-related diseases. 25,33 Although several authors have published TAX expression and PVL quantification values in HTLV-1-infected individuals, the standard reference values for these parameters have not been well established yet. In our study, we measured the levels of TAX expression and by setting the median value we defined low and high TAX expression samples. Hierarchical clustering analysis showed that CT and HTLV-1-infected groups clustered separately. Here, we also show that CD4+ T cells from HAC and HAM/TSP samples clustered separately regardless of TAX expression. Thus, our results demonstrate that genes are differentially expressed according to individuals' HTLV clinical status in CD4+ T cells. However, it would be important to analyze gene expression between the HAC and HAM/TSP groups with similar levels of TAX expression and PVL.
It was reported that the global gene expression profile did not allow observation of two independent clusters for HAC and HAM/TSP; however, ATLL samples were suitably clustered independently. 38 Another previous study did not find differences between the HAC and HAM/TSP groups when clustering CD4+ T cells. 37 These findings could be explained by how the sampling was done. In our analysis, individual samples were submitted to microarray analysis.
We analyzed Pxn and Cxcr4 gene expression since they are involved in cell migration. In response to its binding ligand stromal cell-derived factor-1 (SDF-1), CXCR4 induces downstream signaling by several different pathways. SDF-1 binding to CXCR4 promotes actin polymerization to initiate cell motility. CXCR4 triggers the activation of the src family of protein tyrosine kinases and then the focal adhesion complexes such as RAFTK/Pyk2, focal adhesion kinase, Crk, and paxillin are phosphorylated and activated. 39 –41 The focal adhesion components paxillin and Crk play a critical role in the chemotactic signaling pathways. 42
Although the Cxcr4 gene did not show deregulation in microarray analysis, the Pxn gene is a member of the Cxcr4 pathway. The Pxn gene was overexpressed in the CT group compared to the HTLV-1-infected group in microarray analysis. Intriguingly, after a validation process this gene was significantly up-regulated in the HTLV-1-infected group (HAC+HAM/TSP). The discordant results between microarray and qPCR techniques are explained by the inherent pitfalls of each technique. 43 –47 To confirm the gene expression results obtained from microarray analysis qPCR is frequently used as a validation tool. Furthermore, many different platforms exist for both microarray and qPCR analyses that have led to debates over which techniques produce the most exact measurements of gene expression. 48 –50 Additionally, we can also explain our discrepant results based on the fact that microarray and qPCR were not performed with the same number of samples.
CXCR4 is highly expressed by leukocytes in the immune and central nervous systems. 51,52 In this study, Cxcr4 gene expression was up-regulated in the HAM/TSP group compared to the HAC group and no difference in CXCR4 protein levels by flow cytometry was observed among the studied groups. These different results between Cxcr4 mRNA and protein expression can be explained by the fact that there are posttranscriptional mechanisms that might control the translation of the protein. The presence of this posttranscriptional control is demonstrated in many studies, suggesting that there is a poor correlation between the mRNA and protein pools in eukaryotic cells. 53 –58
On the other hand, one previous study demonstrated that CXCR4 levels in HTLV-1-infected cell lines were lower than in noninfected cell lines. 59 This could be explained by the type of cell samples used, since we are working with cells belonging to HTLV-1-infected individuals, in which genetic susceptibility should be taken into account. It was also demonstrated that the inhibition of the SDF-1α-CXCR4 axis by the CXCR4 antagonist AMD3100 suppresses the migration of cultured cells from ATL patients and murine lymphoblastoid cells from HTLV-1 TAX transgenic mice. Therefore, these results show the association of the SDF-1alpha/CXCR4 interaction as one mechanism of leukemic cell migration and this may offer a new target as part of combination therapy for ATLL. 60
HTLV-1-infected lymphocytes may cross the blood–brain barrier and may generate an intensive immune response leading to the development of HAM/TSP. All the aforementioned findings lead us to believe that there is a dynamic regulation of Cxcr4 expression, since the Pxn and Cxcr4 genes are overexpressed in the HAM/TSP group. This result suggests that this pathway could be deregulated in these patients and could lead to CD4+ T cell migration to the CNS. This way, our data suggest that the Pxn and Cxcr4 genes may be acting together in CD4+ T cells.
We observed that the IL27 gene was up-regulated in the HAC group when compared to the CT and HAM/TSP groups. IL-27 is a member of the IL-12 cytokine family and has many functions in immune response such as induction of proliferation of naive specificity and also as an early product of activated antigen-presenting cells. 61 Moreover, it has been shown that IL-27 is capable of regulating T helper subpopulations (Th1, Th2, and Th17) during acute and chronic infection and inflammatory processes. 62 –66 Previous studies have reported that IL-27 inhibits HIV-1 replication in T cells and macrophages and HCV replication. 67 –70 Furthermore, IL-27 may play an antiviral and antitumor role in ATLL and other lymphoid malignancies 71 and it has gathered considerable attention in terms of its therapeutic application in immune disease. This way, IL-27 was shown to suppress experimental autoimmune encephalomyelitis during bone marrow stromal cell treatment. 72 Other studies reported suppression of experimental autoimmune uveoretinitis (EAU), 73 inflammation in the joint, and severe arthritis by administration of IL-27. In addition, IL-27 administered in vivo showed its antiinflammatory effects on a delayed type hypersensitivity model, demonstrating its therapeutic potential against some diseases of immune origin. 74 However, IL-27 may be an effective therapeutic agent for HTLV-1-infected individuals in order to suppress the inflammation caused by retroviruses and consequently to decrease the risk of HAM/TSP development. Therefore, the specific role of this cytokine in HTLV-1 infection remains unclear.
The perforin/granzyme mechanism is mainly carried out by circulating white blood cells such as CTLs and natural killer (NK) cells. Several studies have shown that Treg cells may use the perforin/granzyme pathway as a system to suppress the function of immune cells by killing them. 31,75,76 It was demonstrated that activated murine Treg cells suppressed B cell proliferation in a granzyme B- and perforin-dependent fashion. 76 Likewise, the activated human Treg cells expressed granzyme A and/or B and could use the perforin pathway to cause autologous target cell death. 75 The transcriptional factor FOXP3 is considered one of the main specific markers for Treg cells 77 whose expression is a critical mediator for the development and the function of these cells. 78 Treg cells are major effector cells during immune response by the perforin/granzyme pathway. Considering this, we selected Gzma, Gzmb, Prf1, and Foxp3 for gene expression analysis.
The level of Prf1 and Gzma gene expression was significantly higher in the HAM/TSP group compared to the CT and HAC groups. No differences were observed in intracellular PRF1 among the studied groups. Protein detection and quantification are potent tools since mRNA detection could not guarantee that protein will be translated or functional. Thus there could be posttranscriptional mechanisms that regulate the expression of these molecules. Moreover, measurement of granzyme and perforin mRNA is better than immunostaining of granzyme and perforin proteins as a correlate of cytotoxicity, because the granzyme and perforin proteins do not accumulate in the cell but are rapidly and continually discharged in the lytic granules. 37 Therefore, all these considerations can explain our results.
Although it has been demonstrated that HTLV-1 has a tropism to Treg cells, 79 reduced FOXP3 protein expression in HTLV-1-infected cells of HAM/TSP patients has been reported. 80,81 However, in our analysis of Foxp3 gene expression, we also noticed a significant increase in the HAM/TSP group compared to the CT and HAC groups. We also observed a positive correlation among Gzma, Gzmb, and Prf1 to Foxp3. In addition to that, there was also a positive correlation between the Foxp3 gene and PVL and the Foxp3 gene and TAX expression. These data are consistent with the results from a previous report 82 describing higher FOXP3+ expression in CD4+ T cells of individuals with HAM/TSP compared to healthy individuals. In addition, the researchers have also observed a positive correlation between FOXP3 and PVL and FOXP3 and TAX expression. We also found an increased frequency of CD4+FOXP3+ cells in HTLV-1-infected individuals, as reported previously. 82,83 In our results, we showed that Foxp3 gene expression levels were increased in the HAM/TSP group compared to the HAC group, while the proportions of CD4+FOXP3+ cells were higher in the HAC group compared to the HAM/TSP group. This discordance may be due to differences between both applied techniques. In general, the sensitivity of real-time RT-PCR is higher than that of flow cytometry. 84
Many studies on solid-organ transplant recipients (heart, kidney, and intestine) have demonstrated a direct correlation between Treg marker FOXP3 and the cytotoxic T cell effector molecules (granzyme B, perforin, and granulysin) in the process of acute rejection. 85 –89 Therefore, in our study we speculate that FOXP3 is correlated with the cytotoxic T cell effector molecules (Gzma, Gzmb, and Prf1) in HTLV-1 infection. One previous study suggested two possibilities for the role of Treg cells in HTLV-1 infection. First, FOXP3+ T cells have hyperproliferation ability 90 and this could collaborate in the clonal expansion of HTLV-1-infected cells. Second, HTLV-1 can invade the immune system by direct infection of this immunosuppressive cell population. Consequently, HTLV-1 infection of FOXP3+ T cells can enable the virus to increase or maintain its proviral load and thus reach a state of persistent infection. 91 With this in mind, we suggest another possibility for the role of Treg cells. Treg cells may use the perforin/granzyme pathway as a system to suppress the immune cells by killing them. This way, the increase of FOXP3+ T cells analyzed in HTLV-1 infection may contribute to immunodeficiency, which is observed in HTLV-1 infection. 92
In a previous study, we reported differentially expressed genes in CD8+ T cells isolated from the same population as this study. Our results showed that patients with HAM/TSP have high expression levels of degranulation-related genes (Gzmh and Prf1) and of the cytoskeletal adaptor Pxn. We indicated that Gzmb and Zap70 genes were overexpressed in HTLV-infected individuals compared to the healthy control group. We also found that Ccl5 was higher in the HAM/TSP group compared to the HAC and CT groups. Therefore, our findings showed that CD8+ and CD4+ T cells from HAM/TSP patients have an inflammatory and active profile. 93
In conclusion, we demonstrated that Pxn, Cxcr4, IL27, and Gzma gene expression in CD4+ T cells differs between the HAC and HAM/TSP groups regardless of TAX expression. Prf1 and Foxp3 genes are increased in the HAM/TSP group compared to the HAC group and present a positive correlation to the expression of TAX and PVL. We believe that the IL27, Pxn, Cxcr4, Gzma, Prf1, and Foxp3 genes are novel molecules that could play an important role in HTLV-1 infection. Moreover, Treg may be a future strategy for the treatment and prevention of HTLV-1-infected individuals. However, further studies are required to elucidate the molecular mechanisms of CD4+ T cell involved in HTLV-1 infection.
Footnotes
Acknowledgments
The authors thank Rochele Azevedo for quantification of the proviral load, Patrícia Vianna Bonini Palma for flow cytometry analysis, Amelia Goes de Araujo for her assistance with the microarray technique, Maurício Cristiano Rocha Junior for help in writing the paper, and Prof. Charles Bangham for TAX expression analysis. They are also grateful to the patients. This work was supported by Fundação Hemocentro de Ribeirão Preto (FUNDHERP) and São Paulo Research Foundation (FAPESP-Process number: 2011/21740-7)
Author Disclosure Statement
No competing financial interests exist.
References
Supplementary Material
Please find the following supplemental material available below.
For Open Access articles published under a Creative Commons License, all supplemental material carries the same license as the article it is associated with.
For non-Open Access articles published, all supplemental material carries a non-exclusive license, and permission requests for re-use of supplemental material or any part of supplemental material shall be sent directly to the copyright owner as specified in the copyright notice associated with the article.