
Abstract
Viral blips, where HIV RNA plasma viral load (pVL) intermittently increases above the lower limit of assay detection, are a cause for concern. We investigated a number of hypotheses for their cause. We assessed HIV RNA, and total and episomal HIV DNA from 16 individuals commencing antiretroviral therapy (ART) consisting of raltegravir and tenofovir/emtricitabine for 3 years, using two assays: a single-copy assay [SCA; lower limit of quantification (LLOQ), <1 copy/ml] and the Amplicor assay (LLOQ of 50 copies/ml). Two individuals exhibited viral blips. From week 20 onward, the period where ART had achieved its final suppressive levels, pVL ranged from <1 to 330 copies/ml, except for one individual at the final time. Both assays were 98% consistent (108/110) in assessing pVL <50 copies/ml, but the Amplicor assay registered 56% of samples (19/34) as below the LLOQ that were in the 50 to 1000 copy/ml range as quantified by SCA. pVL changes between successive time points did not correlate with changes in cellular infection as measured through either total or episomal HIV DNA. Changes in pVL were correlated (negatively) with changes in total CD4+ T cell numbers (p=0.003), naive (CD45RO–CD62L+CD4+), natural regulatory (CD45RO–CD25+CD127–CD4+), activated effector (CD45RO+CD38++CCR5+CD8+), but not activated (CD38+HLA-DR+) CD4+ T cells. Patients receiving stable, seemingly suppressive ART can have pVL near the 50 copy LLOQ at multiple time points. The high Amplicor assay error rate around this level implies that viral blips underrepresent pVL being more consistently above the LLOQ. Activation of latently infected cells is less likely to contribute to this phenomenon.
S
A number of theories have been advanced to explain viral blips, but there are essentially two hypotheses: (1) differences in detection of pVL at or around the lower limits of assay quantification (LLOQ) occur through errors in the reproducibility of the assays and fluctuations of pVL around mean HIV RNA levels below the LLOQ 1 –3 ; and (2) new rounds of viral replication arise through a variety of mechanisms resulting in rapid increases in pVL above the LLOQ from previously low levels. 4 –6 An underlying assumption with the second hypothesis is that successful ART suppresses pVL much lower than 50 copies/ml and a blip represents a large change in pVL.
We investigated these questions using data from 16 HIV-infected, therapy-naive patients [eight primary (PHI) and eight chronic (CHI)] commencing raltegravir and Truvada (tenofovir/emtricitabine) who were followed for 3 years (the PINT Study 7,8 plus a 2 year extension phase). pVL was measured at weeks 0, 4, 12, 24, 32, 40, 52, 78, 104, 130, and 156 (Fig. 1A), with a standard HIV RNA assay (Roche Amplicor) with a 50 copy/ml LLOQ, and also with an assay with an LLOQ ≤1 HIV RNA copy/ml (the "single-copy assay," SCA 9 ). For the SCA, virus from 7 ml of plasma (with an internal standard virion control) was pelleted and RNA isolation, cDNA synthesis, and polymerase chain reaction (PCR) were performed. Primer and probe sequences were modified for four patients to accommodate sequence variability.
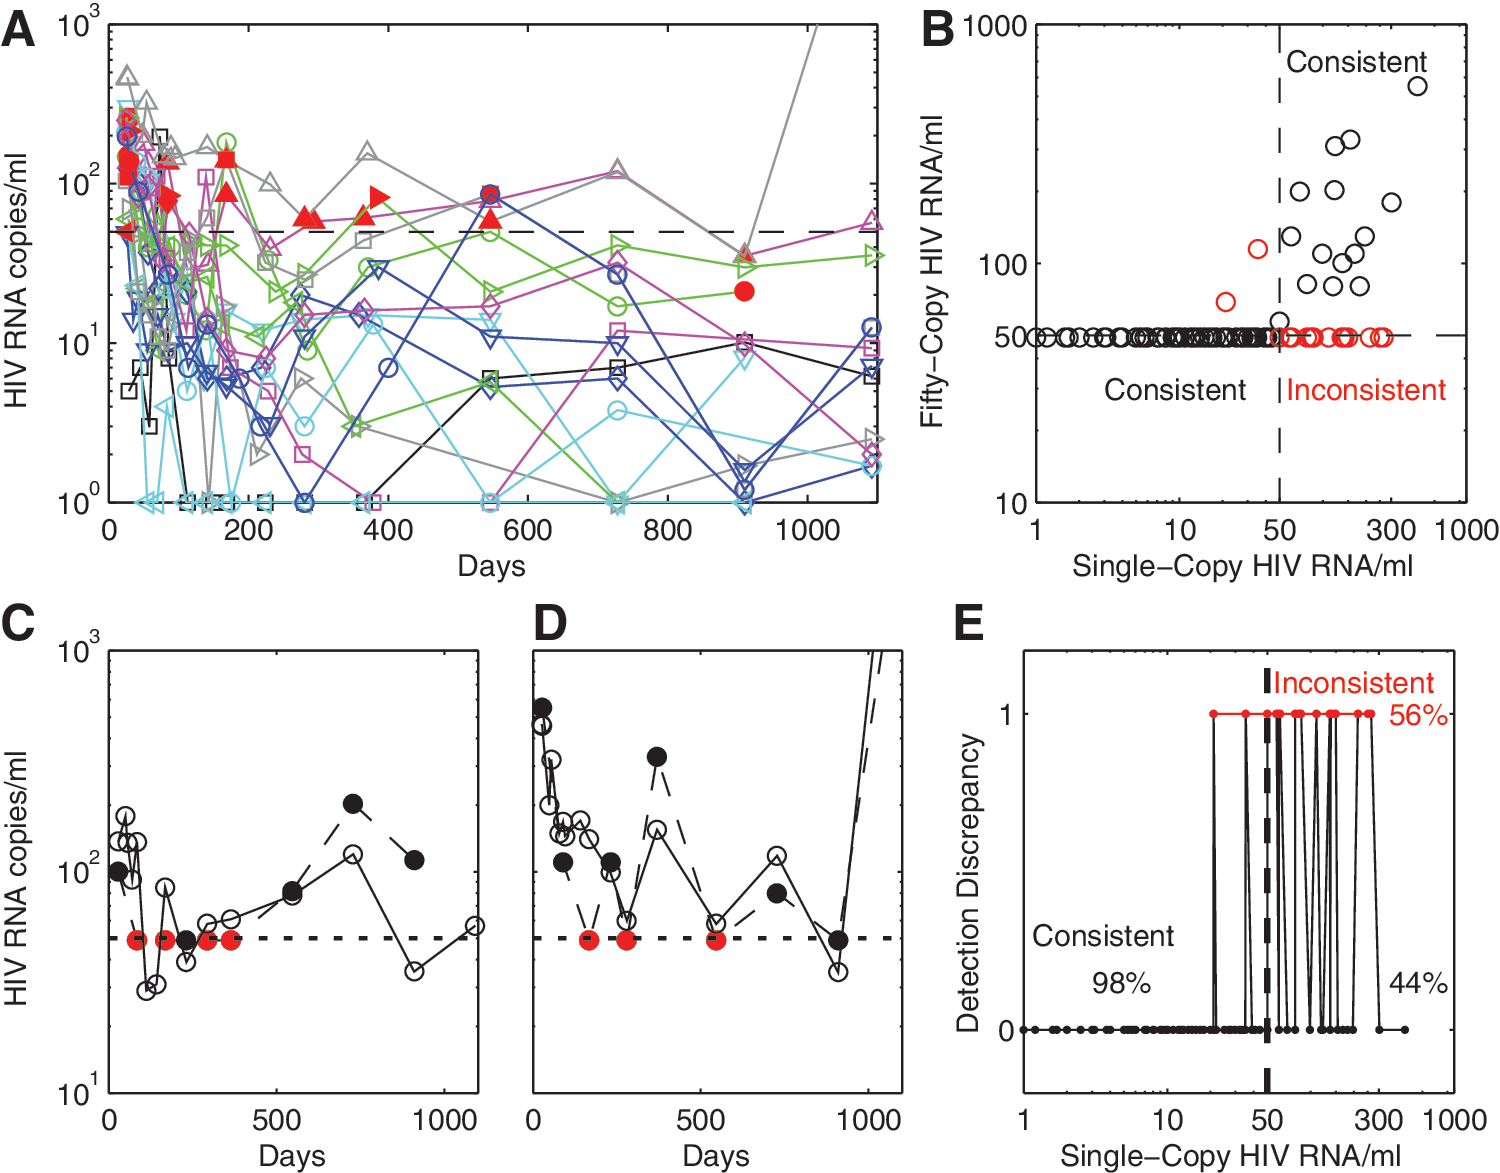
By week 4 of ART, pVL was below the 50 copy/ml LLOQ (“undetectable”) of the Amplicor assay for 9 of 16 individuals, whereas from week 12 onward pVL was in the detectable range for three individuals. Two patients exhibited viral blips (an HIV RNA measurement ≥50 copies/ml in between two measurements <50 copies/ml using the Amplicor assay), with two and three blips for these individuals over the 3 years. Using the SCA, pVL decayed to final phase levels of an average 9 HIV RNA copies/ml by week 16. From that point onward there was no further decay in pVL, 8 and from week 20 pVL ranged from less than 1 copy/ml up to 181 copies/ml by SCA (330 copies/ml by Amplicor) except for one individual at the final year 3 time point where pVL exceeded 3,000 copies/ml (Fig. 1A). Given the speed with which this regimen suppresses virus, 10 and the lack of further decay after week 16, this level of detectable virus on SCA may also represent the range of pVL achieved in other ART regimens after extended periods. Hence pVL levels should be expected to range up to, and sometimes above, the 50 copies/ml LLOQ level in some individuals despite an ART regimen achieving its maximal effectiveness and despite most of these pVL being <50 copies/ml on the Amplicor assay.
The Amplicor assay and SCA were 98% consistent (108/110) in predicting HIV RNA levels when the SCA estimates were less than 50 copies/ml (Fig. 1B and E). However, the Amplicor assay also registered pVL as undetectable 56% of the time when the SCA result was in the region of 50 to 1,000 copies/ml (19/34, Fig. 1B and C). These latter inconsistencies were limited to the HIV RNA range of 50 to 300 copies/ml as determined by the SCA assay. Relative to the SCA, the Amplicor assay therefore exhibited a specificity for assessing pVL below 50 copies/ml of 98%, but with a sensitivity of only 44% when in this low pVL range. Part of this discrepancy may be due to the accuracy of the SCA, which exhibited a standard deviation of 14 when tested against a 50 copy control. 9
Two example patients, both CHI, who exhibited either inconsistencies between assays and/or viral blips are shown in Fig. 1C and D. According to the SCA there were no viral blips for the second individual since pVL was consistently >50 copies/ml. From these findings, it seems likely that many viral blips will arise from pVLs that do not substantially change around the 50 copy/ml level, but where most of these that are really in the detectable range (approximately 56%) will be returned as below the 50 copy/ml LLOQ.
Nevertheless in some instances viral blips may arise from large, real changes in pVL as exhibited by one patient whose pVL increased from 12 copies/ml at week 20 to 181 copies/ml at week 24 before falling back to 33 copies/ml by week 32. We investigated whether activation of CD4+ T cells, within which latent infection resides, was responsible for these spikes in viral load, as suggested by others. 5,6,11 However, activated CD4+ T cell changes between successive time points {ΔT(i)=[T(ti +1) – T(ti )]/(ti +1 – ti )}, from week 20 to the end of the first year, were not correlated with pVL changes as determined by SCA {ΔV(i)=[V(ti +1) – V(ti )]/(ti +1 – ti ), Spearman rank correlation, p=0.49}. Changes in 6 of 15 T cell phenotypes as determined by changes in absolute cell numbers (cells/mm3) were negatively correlated with changes in pVL (Table 1), with total CD4+ T cell numbers being the most significant correlate (p=0.003, rho=–0.42).
Spearman rank correlates of changes in HIV RNA copies/ml are between successive time points {ΔV(i)=[V(ti +1)−V(ti )]/(ti +1−ti )}, with changes in successive values of total HIV DNA copies/ml, episomal (2-LTR) HIV DNA copies/ml, and T cell subsets [cells per mm3 (number) and percentage], from week 20 onward.
We had also assayed total and episomal (2-LTR) levels of HIV DNA and investigated changes in their numbers and how these associated with changes in pVL. Total and episomal (2-LTR) HIV DNA copies per 106 CD4+ T cells were determined as previously described, 7 with these values converted to copies/ml of peripheral blood using the number of CD4+ T cells/μl calculated at each time point. This ensured consistent units of measure for both pVL (copies/ml) and HIV DNA (copies/ml). These measures of cellular infection can reflect new rounds of infection (and hence result in increased pVL), with total HIV DNA also being a surrogate for integrated HIV DNA after sufficient time on ART. 12 Any pVL increase through latently infected cell activation would possibly result in a change in both forms of cellular infection. However, changes in pVL levels between successive time points from week 20 to the end of the first year did not correlate with changes in total and episomal HIV DNA (Table 1).
Previous blip analyses have inferred that errors in pVL quantification around a 50 copy/ml LLOQ contributed to their detection by mainly comparing blip frequency and magnitude between different assays employed over disjoint time periods or sets of patients. 1,13 Here we determine error in classification directly, using for the first time an assay in parallel that is quantitative to <1 copy/ml. We found that the Amplicor assay underreported pVL around its LLOQ. This is consistent both with other findings of assay variability at low pVL 14 and with the observation that switching from the Amplicor to the Taqman 1 assay (40 copy/ml LLOQ) led to increased observation of blips. 1 Of greater concern than issues of assay accuracy per se was that blip detection can imply that pVL is consistently high in the 50 to 300 copy/ml range (Fig. 1). Although blips <500 copies/ml were not correlated with virological rebound in the study by Grennan et al., 15 the one patient in this study who experienced three blips, and had pVL consistently >50 copies/ml according to the SCA, ultimately experienced virological failure (Fig. 1D).
After 16 weeks of this regimen, pVL was virtually constant at an average of 9 HIV RNA copies/ml. 8 Based on the SCA, pVL from week 16 ranged from ≤1 copy/ml to 181 copies/ml over the entire 3 years of the analysis (Fig. 1A, except for one patient failing therapy at the final time point). This is similar to, although slightly higher than, the pVL range seen with other regimens after more extensive periods of treatment. 16,17 Hence it is possible that some individuals on successful ART have pVL levels close to or ≥50 HIV RNA copies/ml, where this has consistently registered as <50 copies/ml on the standard Amplicor assay.
Although some viral blips may be associated with variations in effectiveness of the immune response or levels of activation, we found no correlation between changes in pVL and changes in total or episomal HIV DNA levels. The lack of correlation with total HIV DNA would suggest that latent cell activation, at least as observed in peripheral blood, is unlikely to be a consistent and primary source for viral blips. Although this analysis was performed on total HIV DNA from week 20, by this time the majority of HIV DNA should be either integrated or episomal. 12 However, direct verification of these results using integrated HIV DNA, a better measure of the replication-competent latent reservoir, 18 would be of value. A further limitation of this analysis is that it was applied to all pVL changes rather than specifically to viral blips.
If blips were due to activation of latently infected cells, or from increased availability of target cells as a consequence of antigenic stimuli, we would expect there to be a positive correlation with the occurrence of blips and activated CD4+ T cells and or CD8+ T cells that may be more responsive to changes in antigen load than CD4+ T cells. 19 This was not the case (Table 1). The negative correlations of total CD3, CD4, and CD8 T cells, plus other T cell subsets, may be due to perturbed trafficking in response to changes in antigen load as reflected in changes in pVL.
In summary our findings suggest that most viral blips are caused by variable assay sensitivity around its LLOQ, especially for some patients who maintain relatively high pVL levels despite apparently successful ART. We did not find evidence that blips were due to sudden rounds of activation of latently infected cells, although our analysis is limited by the low frequency of these events. The cause for concern with this underestimation of pVL in the 50 to 300 copy/ml range is that viral blips may be indicative of truly elevated pVL.
Footnotes
Acknowledgments
The PINT study was supported in part by a research grant from the Investigator-Initiated Studies Program of Merck and the National Health and Medical Research Council (NHMRC) program grant 510448, project grant (J.Z., J.M.) 510325, and a Practitioner Fellowship 455350 (A.K.). This project has been funded in part with U.S. federal funds from the National Cancer Institute, National Institutes of Health, under contract no. HHSN261200800001E.
The Kirby Institute is funded by the Australian Government Department of Health & Ageing and is affiliated with the Faculty of Medicine, the University of New South Wales. The views expressed in this publication do not necessarily represent the position of the Australian Government. The content of this publication does not necessarily reflect the views or policies of the U.S. Department of Health and Human Services, nor does mention of trade names, commercial products, or organizations imply endorsement by the U.S. Government.
Author Disclosure Statement
S.E. has received honoraria, consultancies, research grants, or has been an investigator in clinical trials sponsored by Gilead Sciences and Merck Sharp and Dohme.