
Abstract
HIV-1 tropism determination is necessary prior to CCR5 antagonist use as antiretroviral therapy. Genotypic prediction of coreceptor use is a practical alternative to phenotypic tests. Cell DNA and plasma RNA-based prediction has shown discordance in many studies. We evaluate paired cell and plasma either as single or replicate V3 sequences to assess prediction comparability. The HIV-1 partial env region was sequenced and tropism was predicted using geno2pheno and position-specific scoring matrices (PSSM). Nucleotide ambiguities at V3 were quantified and genetic distance (Protdist) was determined using BioEdit. Wilcoxon signed-rank test, t tests, and Spearman correlation were performed with Prism GraphPad5.0. Results are expressed as medians, with a level of significance of p<0.05, two tailed. Single (n=28) or replicate (n=26) paired cell/plasma sequences were obtained from 54 patients. Although the clonalfalse-positive rate (FPR) value from both compartments strongly correlated (r=0.86 p<0.0001), discordance in tropism prediction was observed in both singles and replicates using geno2pheno or PSSM. Applying clonalFPR10% 46% (25/54) were X4 tropic, with a plasma/cell discordance of 11% in singles and 23% in replicates. Genetic distance (p<0.0001) and clonalFPR value dispersion (p=0.003) were significantly higher among replicate sequences from cells. Discordance of viral tropism prediction is not uncommon and the use of replicates does not decrease its occurrence, but improves X4 sensitivity. Sequences from provirus had greater genetic distance and dispersion of clonalFPR values. This may suggest that DNA replicate assays may better represent the diversity of HIV-1 variants, but the clinical significance of these findings needs further evaluation.
Introduction
H
The determination of coreceptor use may be assessed by phenotypic assays, with one CLIA approved test, Trofile, or with “in-house” tests. 8,9 Genotypic prediction of viral tropism has been proposed as a more practical alternative to phenotypic assays. 10,11 Genotypic testing is based on the analysis of the V3 loop envelope (env) sequence of HIV-1, using sequence alignment motifs or bioinformatics prediction tools to predict coreceptor usage. Although other gp120 regions (such as V1, V2, and C4) and the gp41 transmembrane protein 12,13 may be involved in viral tropism, V3-based genotypic testing is commonly used. It is less technically demanding, more rapid, and less expensive than phenotypic tests, thereby meeting the need for a fast and reliable assay for routine diagnostics practice. A good prediction of virologic response to maraviroc using bulk (populational) genotyping testing has been documented. 14
Both genotypic and some phenotypic tests rely on the initial amplification of the HIV-1 glycoprotein gp120 coding sequence from plasma viral RNA. Detectable HIV-1 RNA is needed for a successful virion-based assay. Provirus DNA may be considered a potential alternative for tropism testing in patients with low or undetectable viral load, 15 –17 as for patients with suppressed viral load considering treatment change due to tolerance issues to one or more antiretroviral drugs. DNA-based tropism is used by an Italian network to provide a tropism test, 18 but prediction based on provirus DNA or virion RNA may be discordant, with a tendency for a higher X4 prediction in cell-derived DNA. 10 However, some studies report a good cell–plasma concordance. 19,20 In addition to the origin of genetic material analyzed, the number of sequences evaluated may be of relevance. RNA virus is known to consist of a group of similar variants knows as quasispecies. 21 The use of next generation sequencing may better grasp this variability, but its application in clinical routine, especially in resource-limited settings, is not yet feasible. The analysis of more than one sequence may improve the identification of variations of viral tropism within the HIV quasispecies, and the use of triplicates has been shown to better predict maraviroc response. 14 Moreover, the use of replicates has been proposed for use in clinical practice for tropism prediction in Europe. 7
The aim of this study was to evaluate genotypic tropism testing from plasma virion RNA and provirus DNA using single or replicate sequences, to investigate factors that may influence prediction, and to determine whether the use of replicates would minimize cell/plasma prediction discrepancies.
Materials and Methods
Study population
Biological samples included in the study were collected from HIV-infected patients failing an antiretroviral regimen, followed at clinical sites in São Paulo from 2008 to 2010. Patients provided written informed consent, obtained at clinical sites by physicians. A report of genotypic tropism prediction was generated to subsidize salvage therapy. The study was approved by the Ethical Committees of the participating institutions.
Nucleic acid isolation
Blood was collected with EDTA (BD, USA). Plasma and buffy coat were separated by centrifugation (2,000 rpm for 20 min) within 6 h of collection and stored at −70°C until use. HIV RNA was extracted from plasma with a QIAmp Viral RNA Kit (Qiagen, Hilden, Germany). Provirus DNA was extracted from peripheral blood mononuclear cell-enriched buffy coat (cell) with a QIAamp DNA Blood Mini Kit (Qiagen, Hilden, Germany), both following the manufacturer's instructions. For each sample, one extraction from plasma and one from buffy coat was performed.
Viral RNA amplification
RNA was amplified in one reaction (single sequence analysis) or in three independent replicates, using the nested one-step reverse transcription polymerase chain reaction (RT-PCR) method, adapted from a British Columbia Excellence Center protocol. 22,23 Briefly, the amplification of the partial HIV envelope (env V3) gene was performed with 2.5 μl of RNA input, Superscript III (20U), and Taq Platinum High Fidelity 0.625U (Life Technologies). The second PCR was done using 2.5 μl of RT-PCR products with Go Taq Green Master Mix (Promega, USA). In cases with less than three sequences in replicate assays, the procedure was repeated once, yielding up to five replicates whenever material was available.
Proviral DNA amplification
The HIV-1 env fragment (about 960 bp) including the V3 region was amplified from 2.5 μl of DNA input in single or independent replicates as described above. The reaction mixture includes 10 μM of each primer ED5, forward position ATG GGA TCA AAG CCT AAA GCC ATG TG (6557→6582) and ED12, reverse position AGT GCT TCC TGC TGC TCC CAA GAA CCC AAG (7782←7811) with Taq Platinum High Fidelity (Life Technology) to a final volume reaction of 25 μl. Positive and negative controls were included in each run. PCR conditions consisted of 35 cycles at 94°C for 2 min, 94°C for 15 s, 55°C for 30 s, 68°C for 1 min 30 s, and 68°C for 7 min. A second PCR (nested) was performed with 2.5 μl of first round PCR products and primers ED31, forward position CCT CAG CCA TTA CAC AGG CCT GTC CAA AG (6817→6845) and ES8, reverse position CAC TTC TCC AAT TGT CCC TCA (7648 ← 7668), using Taq DNA Polymerase (Invitrogen), to a final volume reaction of 25 μl. PCR conditions consisted of 35 cycles at 94°C for 2 min, 94°C for 15 s, 55°C for 30 s, and 72°C for 1 min, with a final elongation period at 72°C for 7 min. The PCR reaction was considered valid when the PCR products and positive control bands were visualized around 700 bp in 1.3% agarose gel with SYBR Safe DNA gel staining (Invitrogen, USA), along with negative controls.
Partial env region sequencing
Each amplified product, from either virion and provirus replicates, was marked with the Big Dye Kit (Ready Reaction Mix, Applied Biosystems, Foster City, CA) with the primers V3O2, forward position 5′ AAT GTC AGY ACA GTA CAA TGT ACA C 3′ (6948→6969), ES7, forward position 5′ CTG TTA AAT GGC AGT CTA GC 3′ (7005→7021), ED33 reverse position 5′ TTA CAG TAG AAA AAT TCC CCT C 3′ (7360←7378), and SQV3, reverse position 5′ GAA AAA TTC CCT TCC ACA ATT AAA 3′ (7350←7370). Cycle sequencing conditions consisted of 25 cycles at 96°C for 10 s, 50°C for 5 s, 60°C for 4 min, and 8°C for infinity. After cycle sequencing, DNA precipitation using a solution of sodium acetate and ethanol was followed by denaturation using Hi-Di Formamide at 94°C for 4 min and resolved at an automated sequencer Genetic Analyzer 3130 XL (Applied Biosystems).
Viral tropism determination
Electropherogram data were analyzed using Sequencher 4.6 software (USA). Sequences were edited manually and a contig was generated based in two or more sense and antisense sequences, considering ambiguous nucleotides as mixtures. Sequences were evaluated using web-based tools such as NCBI locator, BLAST, and genotyping, with reevaluation of the electropherogram whenever needed. The coreceptor usage of HIV-1 was predicted from the V3 env region nucleotide sequence by geno2pheno URL:
Distance metrics
Estimation of diversity at V3 of each sequence (intrasequence) was evaluated as the number of nonsynonymous ambiguities, nucleotide mixtures that would lead to codification of more than one amino acid (NSA) and as the ambiguity index, that is, the number of all degenerate nucleotides, excluding N, divided by the total number of nucleotides. The diversity intersequences (between replicates) was quantified by Protdist (Protein distance matrix—version 3.5c, BioEdit Sequence Alignment Editor, v7.2.5); dispersion was quantified by comparing the paired standard deviation of the sequence's FPR among replicates (n=26). The relationship of the sequences and subtypes was evaluated by phylogenetic analysis utilizing the neighbor-joining (NJ) phylogenetic tree, using the evolutionary model selected for the dataset by Modeltest TVM+i+g with PAUP software v4.0b and using a Bayesian inference method available in the software BEAST version 1.7.4. Each sequence of the corresponding data set was dated and a maximum clade credibility (MCC) tree was generated. The internal nodes were inferred using a Markov chain Monte Carlo (MCMC) Bayesian approach under a GTR model with a gamma proportion for the nucleotide heterogeneity model, as selected by Modeltest. An MCMC run of three chains was run for 10 million generations. Convergence of parameters during the MCMC run was assessed by their effective sample size (ESS) reaching values above 200 as calculated with Tracer v1.5 24. Sequences are available at GenBank with accession numbers KF947399–KF947425 and KF947426–KF947513.
Statistical analyses
Epi Info 6.04d (CDC, Atlanta, GA) and Microsoft Excel 2007 were used for data storage. t tests, Wilcoxon signed rank test, and linear regression and correlation (Spearman) were done with Prism GraphPad 5.0. Results are expressed as medians, with a level of significance of p<0.05, two tailed.
Results
Cell and plasma paired single sequences from 28 patients and paired replicates (two to five sequences) from 26 patients were evaluated, with six cases excluded (three cases with plasma replicate and cell single and three with single plasma and cell replicate). Most patients were multiantiretroviral experienced with advanced disease (Supplementary Table S1; Supplementary Data are available online at
The median number of sequences NSA and the ambiguity index were similar in sequences that originated from either virions or provirus and both plasma and cell-derived clonalFPR showed a negative correlation with the number of NSA (p=0.0009 and p<0.0001, respectively) (Supplementary Fig. S1A and B). The paired cell/plasma lowest clonalFPR value showed a strong correlation (r=0.86, p<0.0001) (Fig. 1). Discordances were observed at the different geno2pheno (g2p) cutoffs commonly used in clinical prediction (Supplementary Table S2). When only cases with cell/plasma paired triplicates are considered, 29% (2/7) discordances at clonalFPR10% were identified. The use of position-specific scoring matrices (PSSM) also showed cell/plasma discordances both in single pairs (5/28) and with replicates (6/26), and these tools disagreed in 14 (33/234) sequence-based predictions (Supplementary Tables S3 and S4). Evaluating the dispersion of FPR values from replicate sequences, the standard deviation of cell-derived FPR was significantly greater than that of plasma-derived sequences (p=0.003) (Fig. 2). Moreover, the genetic distance was significantly higher in provirus as compared to that from virions (p<0.0001) (Fig. 3). The genetic distance from both cell and plasma replicates showed no significant correlation with CD4 counts or viral load (data not shown). The phylogenetic relationship of each patient sequence was suggested by different phylogenetic methods. In Supplementary Fig. S2 a representative Bayesian tree is shown, with the non-B and a subset of B cell and plasma sequences along with references from GenBank (Supplementary Table S5). Sequences from the same patient form clusters, mostly with high bootstrap, but no clear cell/plasma or R5/X4 relationship can be observed.
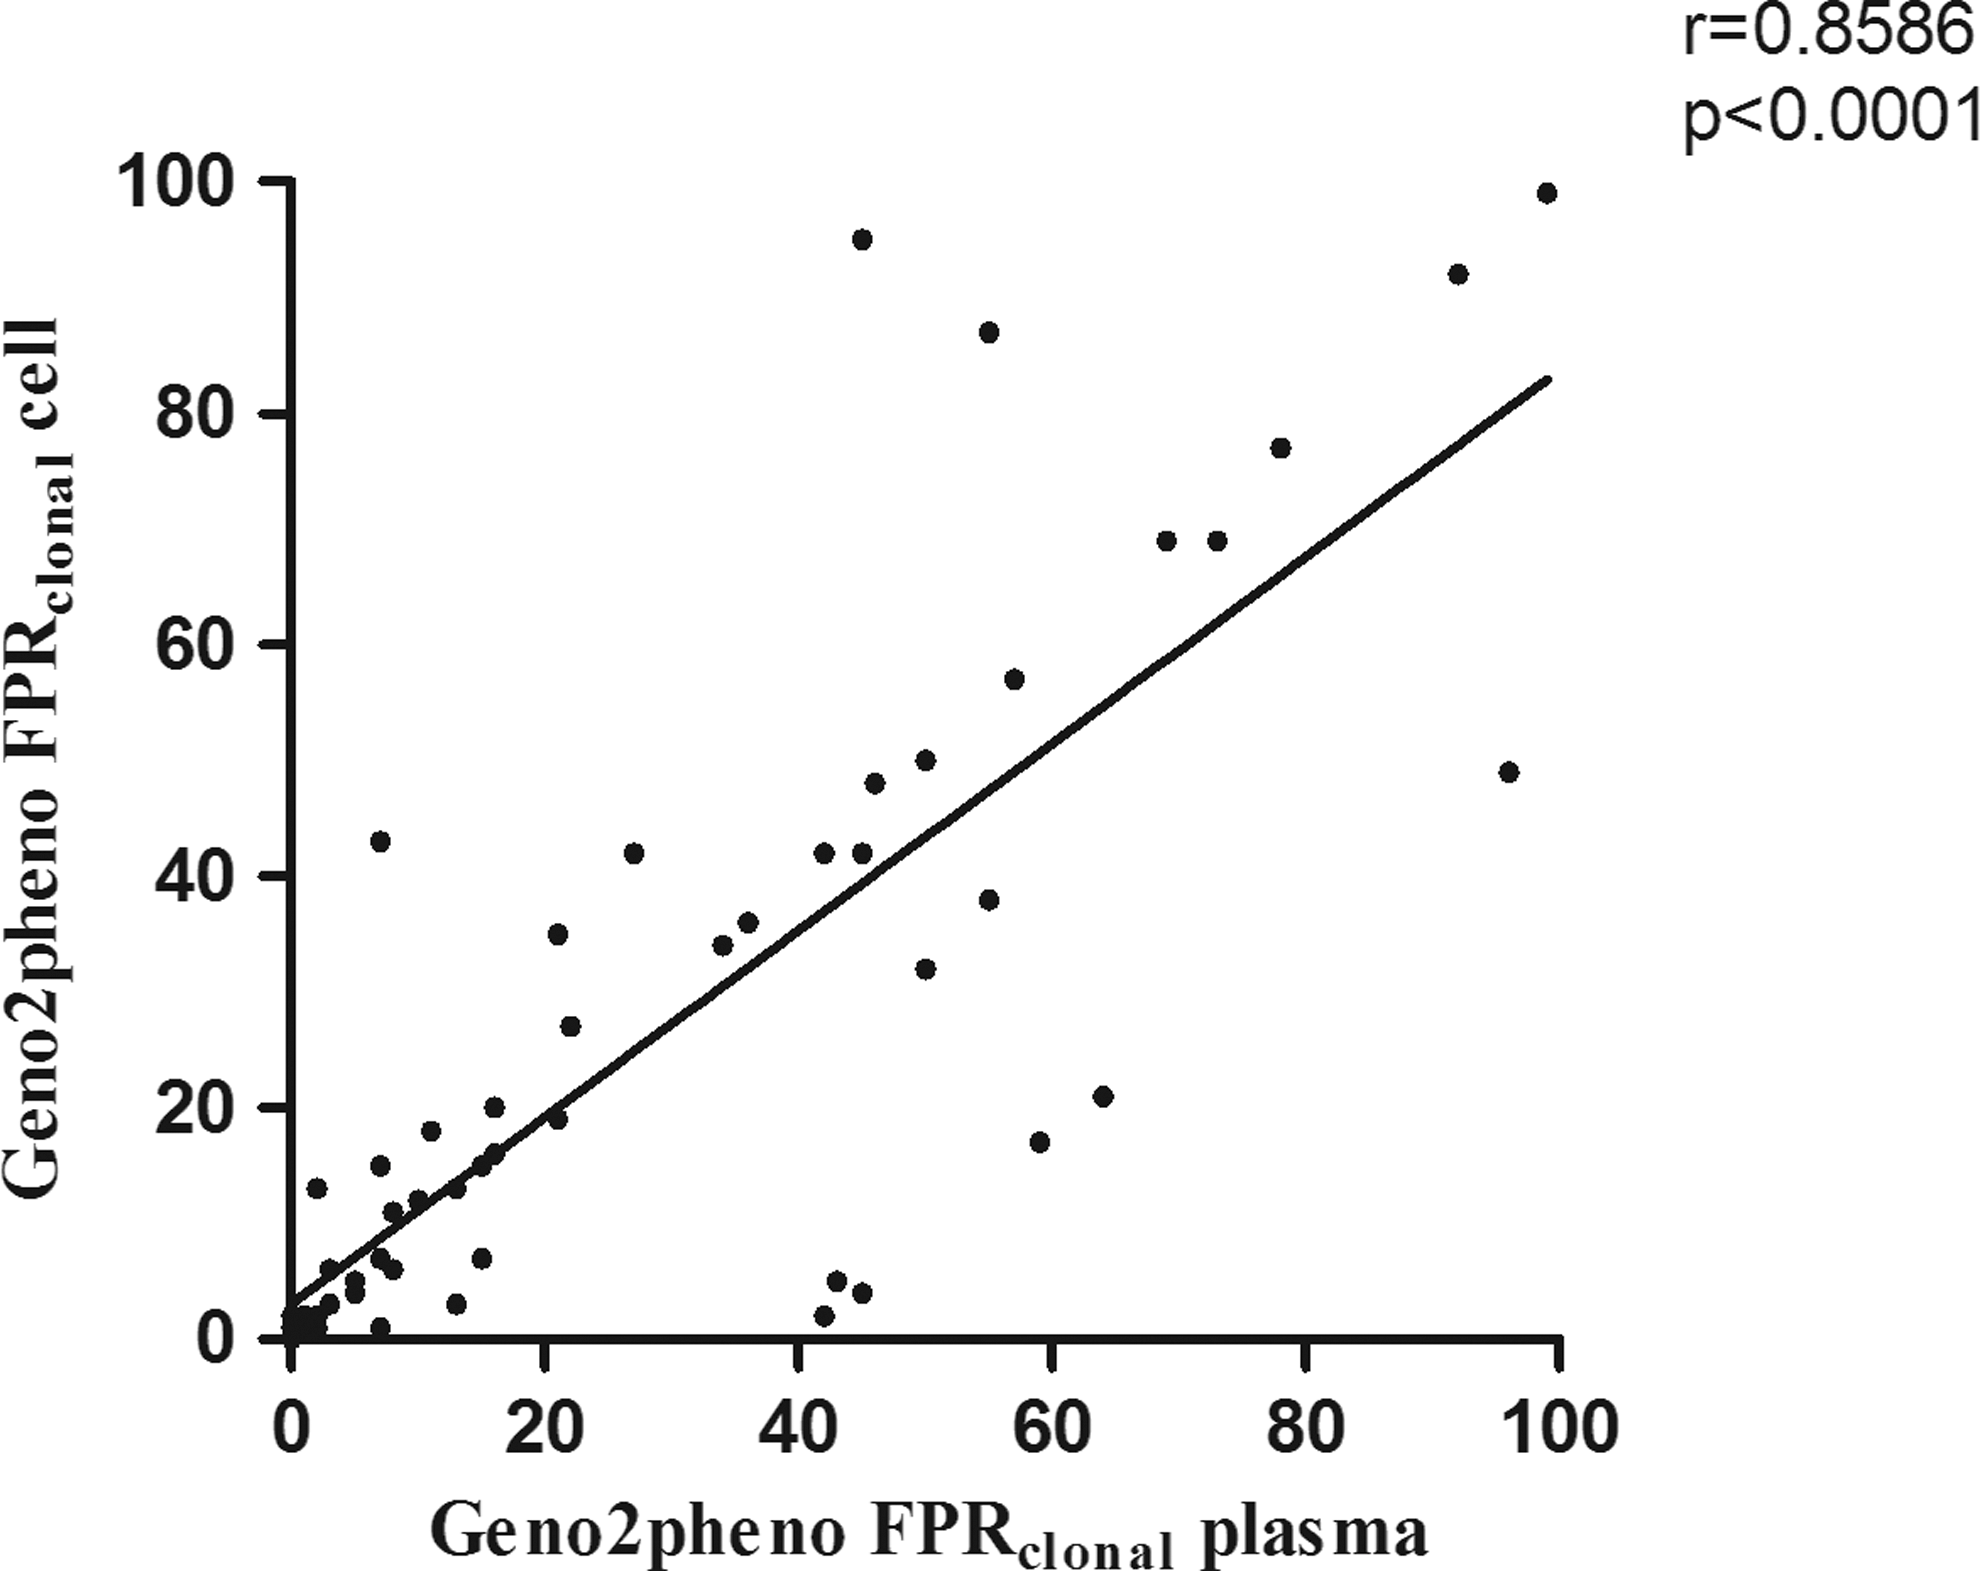
Correlation (Spearman) of the clonalfalse-positive rate (FPR) value from plasma and cell-derived sequences. In replicates the lowest value was selected as used for patients' tropism prediction report.

Wilcoxon signed-rank test of the standard deviation of paired plasma and cell-derived replicate sequences' clonalFPR.
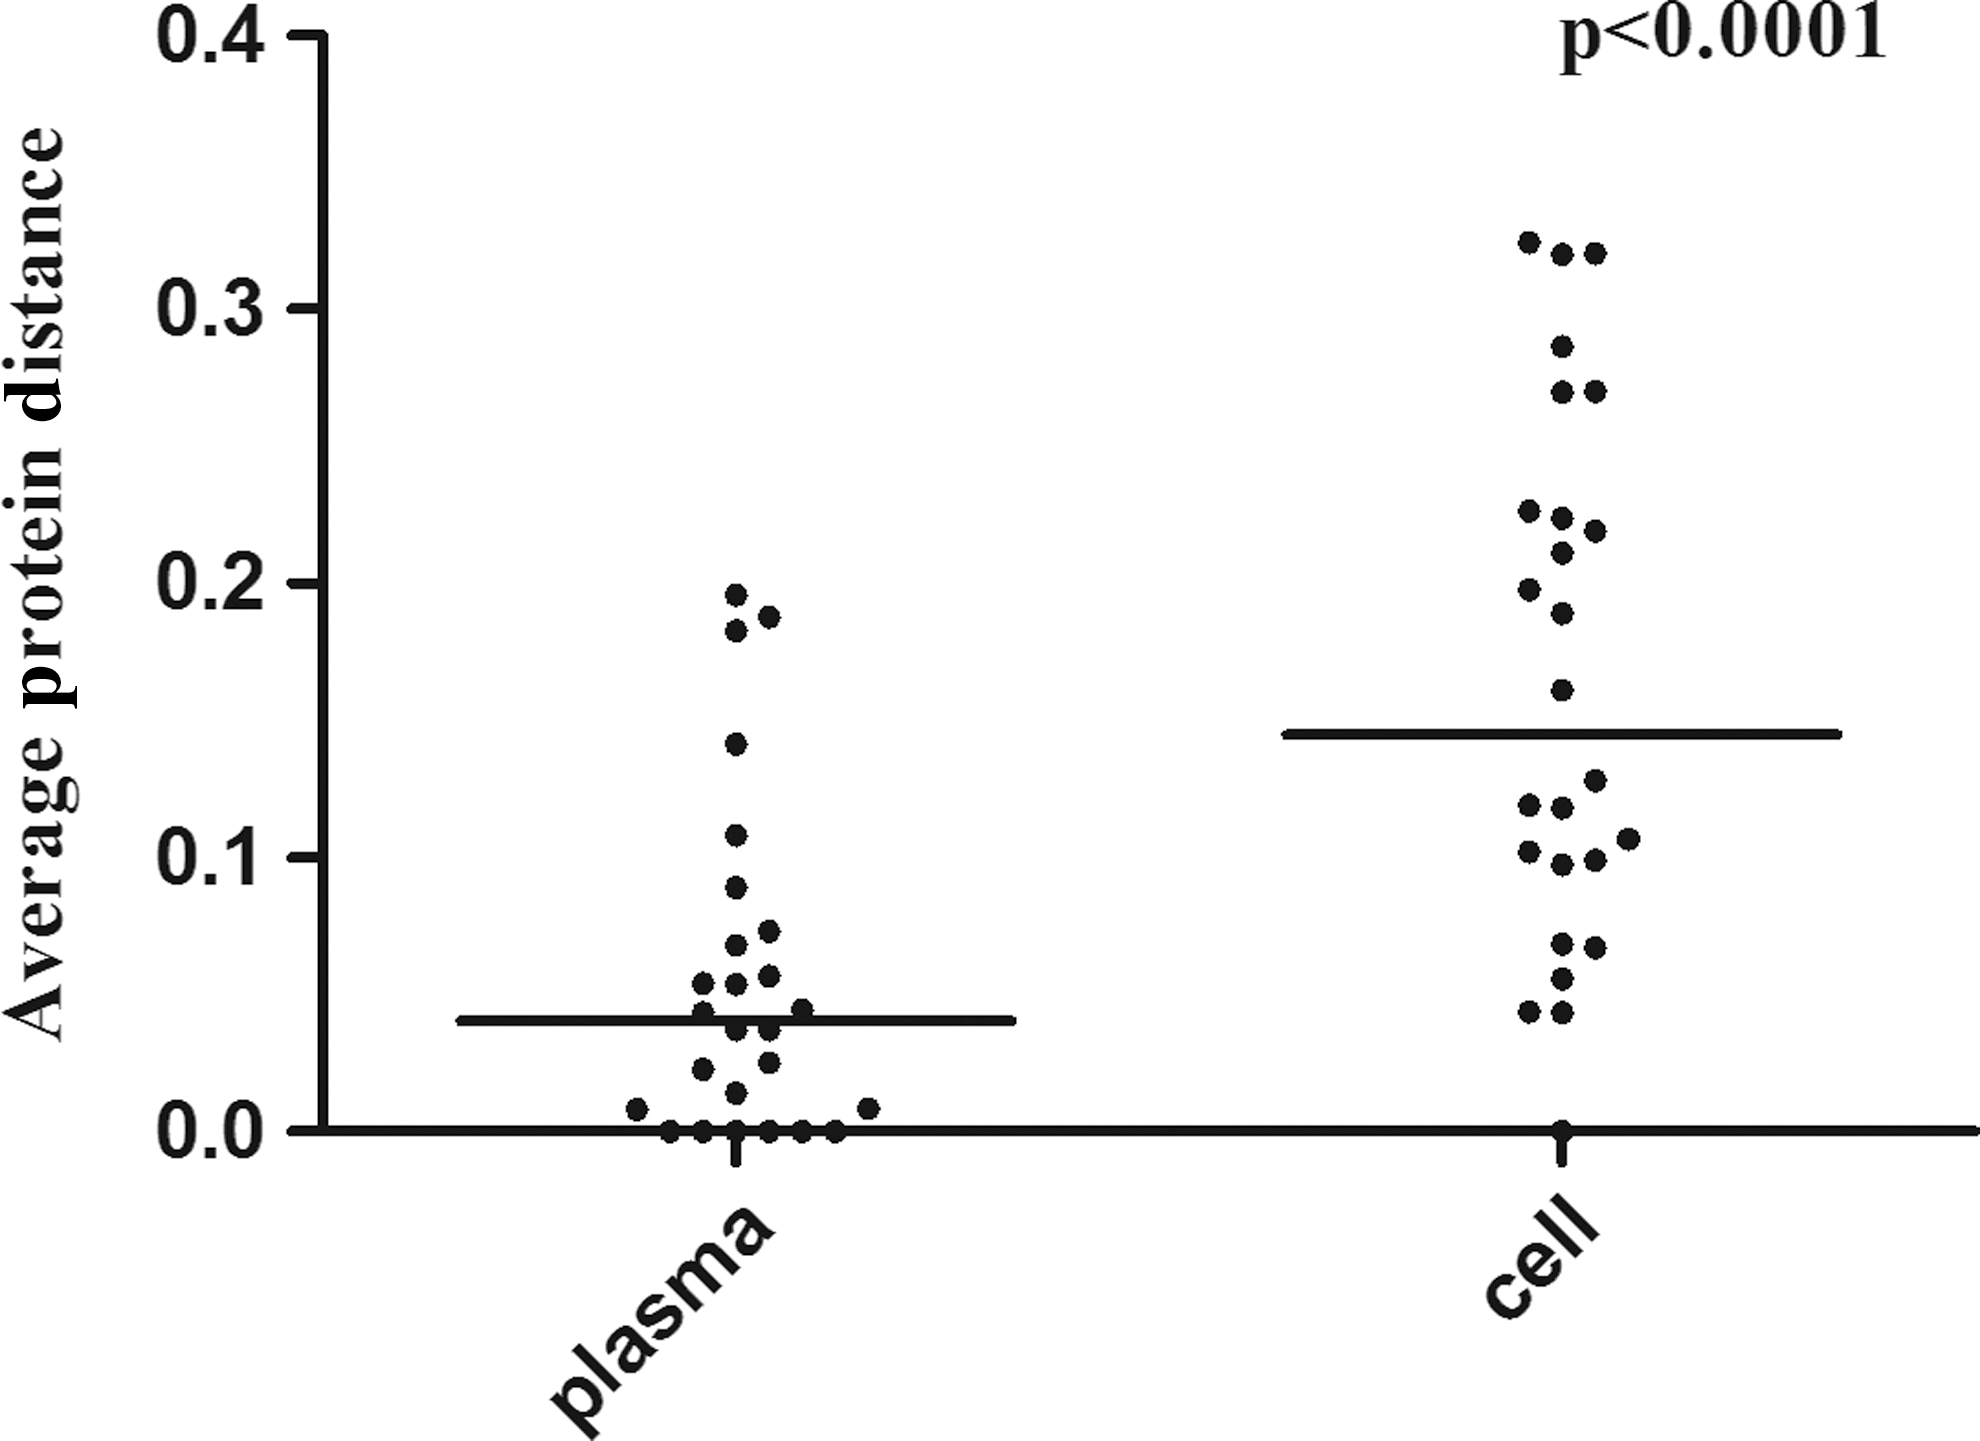
Wilcoxon signed-rank test of the paired cell/plasma genetic distance (Protdist).
Discussion
The V3 region of the HIV-1 envelope not only contributes important structural elements to viral entry but also may define by cell type specificity, employing differential chemokine coreceptor use, the viral tropism. Tropism determination using V3 sequencing analyzed by available bioinformatic tools is practical and generates a prediction that has been shown to be associated with CCR5 antagonist efficacy. 14 When the tropism test is used to support the use of CCR5 antagonists, the sensitivity with which to detect an X4 variant becomes a critical issue, as this class of antiretrovirals is indicated only for patients harboring R5 tropic viruses. In this work we studied paired genomic material obtained from cell DNA and plasma virus RNA to determine whether genomic information obtained from replicate assays improved the comparability of the V3-based tropism prediction in these two compartments.
The use of a single sequence for prediction has been challenged by studies showing the greater accuracy of triplicate sequences as compared to single sequences using the geno2pheno coreceptor algorithm for predicting HIV tropism. 25 More important is the clinical correlation of prediction using triplicates in therapy-experienced patients, where a reanalysis of clinical trial samples demonstrated that replicate genotypic tropism prediction better correlates with clinical response to maraviroc-containing regimens. 14 In the absence of a direct comparison of single and replicate tests in clinical practice, European guidelines advise triplicate testing with a 10% false-positive rate (clonalFPR10%).
For a single sequence a more conservative clonalFPR 20% may be recommended, both for RNA and DNA. 7 The fact that a single pol sequence has provided valuable antiretroviral resistance information in guiding salvage therapy may be cited as an argument for the redundancy of replicate sequence analysis. Differences in selective pressure on the viral envelope protein compared with pol, which are reflected by a 9-fold higher nucleoside substitutions/site/year in env, 26 may suggest that the resistance test might not apply directly to tropism prediction. Another issue that distinguishes the resistance of the genotype test to tropism prediction is the fact that, contrary to the pol resistance test, provirus cell DNA, especially important for antiretroviral-suppressed patients considering regimen modification, seems to provide adequate tropism prediction and some national networks, as in Italy, have been structured based on provirus prediction. 18
Tropism prediction based on provirus DNA or virion RNA has been shown to diverge in many studies that compared the two compartments, with a tendency for a higher X4 prediction in cell-derived DNA. 5,10 We hypothesized that replicate assays would diminish cell–plasma prediction discrepancies in patients with advanced disease. Our findings did not support this assumption, with replicate assays also showing discordances at different cutoffs used in clinical prediction. It is important to note that the number of replicates varied in our study due to occasional repetition of some assays to improve the number of sequences. In most routine clinical laboratory situations, a partially negative experiment (e.g., one positive out of a triplicate assay) may lead, upon repetition, to up to five replicates. We include all sequence information available, but even if only paired cell–plasma triplicates are evaluated, a comparable degree of discordances was observed.
It is important to note that the number of replicates used is small to rule out a more comparable prediction if a larger number of replicates on population sequencing, or next generation sequencing, is used; however, both are not practical for routine clinical laboratory studies. Some studies comparing cell/plasma genotypic prediction have not found important discordances, 19,27 but tropism prediction may be influenced by issues such as stage of disease, methods of analysis, and the subtype circulating in the region. A study in India, using single sequences, compared cell and plasma prediction, with good concordance. 19 The concordance observed in their study may be associated with the preponderance (40/42) of HIV-1 subtype C infections, with only 9.5% of sequences identified as X4 tropic. The only subtype C in our study also showed a concordant cell–plasma tropism, with all replicates having an FPR above 90% (data not shown). In another study 28 a good single/replicate concordance in these two compartments was observed. The study evaluated naive patients initiating antiretroviral therapy, with a time from diagnostics of 2 to 53 weeks. Accordingly, this study identified only 26% non-CCR5 in a population of 42 patients.
Early in infection most cases are infected with CCR5 variants. 2,23 A lower prevalence of non-CCR5 in the study population should minimize discordances when either single/replicate sequences or cell/plasma compartments are evaluated. However, as CCR5 antagonists are mostly used as part of salvage therapy, especially in resource-limited countries, the population considering the use of CCR5 antagonists usually consists of patients with advanced disease, a stage of HIV infection in which about half of the cases are expected to have X4 variants. 2,4 Moreover, as diversity increases with time of infection, 21 these patients have a greater chance of having both R5 and X4 variants at levels detectable in population sequencing, with a consequent potential discordance in tropism prediction.
Another aspect that we evaluated was the prediction comparability employing the two most used resources, geno2pheno and PSSM. As FPR cutoffs are used in geno2pheno prediction, small differences in the FPR value might determine a change in tropism. Accordantly, predictions in cell and plasma differ at different cutoffs (Supplementary Table S2), but there is an overall good correlation of viral tropism FPR values (Fig. 1). As cutoffs are arbitrary, cases with prediction based on sequences with FPR near the cutoff may deserve additional evaluation to better establish viral tropism. Further analysis of sequences with PSSM also showed a similar degree of cell/plasma discordance. Moreover, PSSM and geno2pheno disagreed in the prediction assignment in some sequences (Supplementary Tables S3 and S4).
Phylogenetic trees documented a high bootstrap value for most intrapatient sequence clusters, supporting the phylogenetic relationship of each sample sequence set. However, cell and plasma-derived sequences, as well as X4 and R5 predicted sequences, did not show any specific topology within each cluster with the phylogenetic tools used. Parameters such as CD4 and viral load did not show a significant association with the X4 prediction, but the number of ambiguities in each sequence (Supplementary Fig. S1A and B) is inversely correlated with FPR results. These results may signify the association of an older, more diverse viral population with X4 prediction, but also may be secondary to the fact that the chance to obtain an X4-related residue should increase with more amino acid possibilities. The intersequence distance (Figs. 2 and 3), or the dispersion (standard deviation) in the FPR obtained with replicates (Supplementary Table S4), seems to be more pronounced among provirus DNA, but this is not related to a higher proportion of ambiguities in the cell compartment (Supplementary Fig. S3A and B).
A recent study using next generation sequencing also identified more variable V3 in cells as compared to plasma. 27 These observations may suggest that proviral prediction results from a more heterogeneous viral population, a heterogeneity that is not secondary to a higher ambiguity in cell-derived nucleotide sequences. The presence of defective genomes may play a complicating role in this interpretation, as nonfunctional genomes may be included in such predictions. On the other hand, defective genomes may provide an indication of a related, viable virus, which may be of relevance. This variation could increase the number of X4 in cell prediction, as a more diverse population seems to be represented in sequence replicates from cell DNA. However, the virologic response to CCR5 antagonists is the major endpoint in tropism prediction, and some studies using second generation sequencing suggest that DNA prediction may be suboptimal for the objective. 27,28
Although the clinical response to CCR5 antagonists was not evaluated, our study supports the notion that the use of more than one sequence in genotypic tropism evaluation may improve X4 prediction sensitivity, that it is applicable to clinical laboratories even in resource-constrained environments, and that cell DNA replicates show more nucleotide variability as compared to plasma RNA-derived sequences.
Footnotes
Acknowledgments
This work was supported by the Foundation of Support to Research of the State of São Paulo: FAPESP 2009/08215-0 and FAPESP 2011/21958-2. Part of the content of this article was presented at the XIX International AIDS Conference, poster discussion sessions, as abstract THPE 074.
Author Disclosure Statement
The authors did not identify any potential conflicts of interest.
References
Supplementary Material
Please find the following supplemental material available below.
For Open Access articles published under a Creative Commons License, all supplemental material carries the same license as the article it is associated with.
For non-Open Access articles published, all supplemental material carries a non-exclusive license, and permission requests for re-use of supplemental material or any part of supplemental material shall be sent directly to the copyright owner as specified in the copyright notice associated with the article.