
Abstract
Genotype-based algorithms are valuable tools for the identification of patients eligible for CCR5 inhibitors administration in clinical practice. Among the available methods, geno2pheno[coreceptor] (G2P) is the most used online tool for tropism prediction. This study was conceived to assess if the combination of G2P prediction with V3 peptide net charge (NC) value could improve the accuracy of tropism prediction. A total of 172 V3 bulk sequences from 143 patients were analyzed by G2P and NC values. A phenotypic assay was performed by cloning the complete env gene and tropism determination was assessed on U87_CCR5+/CXCR4+ cells. Sequences were stratified according to the agreement between NC values and G2P results. Of sequences predicted as X4 by G2P, 61% showed NC values higher than 5; similarly, 76% of sequences predicted as R5 by G2P had NC values below 4. Sequences with NC values between 4 and 5 were associated with different G2P predictions: 65% of samples were predicted as R5-tropic and 35% of sequences as X4-tropic. Sequences identified as X4 by NC value had at least one positive residue at positions known to be involved in tropism prediction and positive residues in position 32. These data supported the hypothesis that NC values between 4 and 5 could be associated with the presence of dual/mixed-tropic (DM) variants. The phenotypic assay performed on a subset of sequences confirmed the tropism prediction for concordant sequences and showed that NC values between 4 and 5 are associated with DM tropism. These results suggest that the combination of G2P and NC could increase the accuracy of tropism prediction. A more reliable identification of X4 variants would be useful for better selecting candidates for Maraviroc (MVC) administration, but also as a predictive marker in coreceptor switching, strongly associated with the phase of infection.
Introduction
H
Virological failure to MVC therapy can occur through two main pathways: the emergence of CCR5-tropic viruses that can bind CCR5 in the presence of drug 4 –8 and, more commonly, the outgrowth of preexisting CXCR4-tropic HIV variants. 9 To reduce the possibility of developing resistance, current guidelines of the European Medicines Agency (EMA) and the U.S. Food and Drug Administration (FDA) recommend MVC for use in treatment-experienced adults in whom only CCR5-tropic virus is detected. Hence, accurate assessment of viral tropism is a crucial step for optimal selection of patients who can benefit from use of CCR5 inhibitors.
The gold standard method for HIV-1 tropism determination is the phenotypic assay, in which recombinant viruses harboring env sequences amplified from patient's samples are used to infect modified cell lines expressing either CCR5 or CXCR4. However, due to the complexity and the costs of this method, this assay is not widely used for clinical purposes. To overcome the limitations related to the implementation of phenotypic assay for routine diagnostic use, a considerable effort has been made to develop algorithms able to predict HIV-1 coreceptor usage based on the V3 sequence, 10 starting from the observation that this region of env is the major determinant of coreceptor binding during HIV-1 entry. 11 –17
Overall, population-based genotypic approaches appear to perform relatively well in correctly identifying R5 and X4 phenotypes. Nevertheless, discordant results between genotypic and phenotypic assays have been reported in several studies. 18,19 Discrepancies in tropism prediction by different methods are likely related to the strict dependence of genotypic methods on the learning dataset used to generate the prediction algorithm. Moreover, genotypic methods take in account only the V3 loop sequence, without considering different regions of envelope that are likely involved in coreceptor binding. Indeed, several studies have associated different regions in the env gene with R5, X4, or R5/X4 phenotypes, 18 linking HIV tropism to specific amino acid substitutions in env hypervariable regions (V1, V2, V4, and V5), as well as in constant regions, and in the gp41 transmembrane domain. 20 –26 In addition to amino acid signatures, tropism has been associated with other genotypic parameters such as V3 loop net charge (NC). 27,28 NC is tightly linked to envelope protein conformation, as recently proposed in a model in which the V3 region acts as an electrostatic modulator of the structure of the gp120 interaction surface. 28 –30
The geno2pheno[coreceptor] (G2P) is a bioinformatic tool for tropism prediction widely used in clinical practice. 31 G2P takes into account the similarity of the query sequence with a database of 514 sequences with known tropism, evaluating the overall structure of the V3 loop and allocating the sequence to the R5 or X4 group according to the chosen false-positive rate (FPR) cut-off. 32
In this study we analyzed tropism predictions obtained by G2P and V3 NC, with the aim to determine if the combination of the two methods could improve the accuracy of the prediction. Different FPR cut-offs for tropism determination by G2P were compared and associated with NC-based predictions. 33 In a subsequent analysis, a subset of sequences was analyzed by a phenotypic assay based on a single-cycle recombinant virus system. The phenotypic assay allowed the validation of the use of NC analysis as a supplementary tool for prediction, particularly for the identification of dual/mixed-tropic (DM) strains.
Materials and Methods
Study population
A total of 172 V3 loop sequences were obtained from 143 HIV
Cells isolation
After plasma collection, PBMCs were isolated from venous blood samples and separated on Lympholyte-H (Cedarlane Laboratories Limited, Canada) gradients. CD14+ monocytes and CD4+ T lymphocytes were purified by positive selection using micromagnetic beads (Miltenyi Biotec, Bologna, Italy).
RNA and DNA extraction
Plasma HIV-1 RNA and genomic DNA were extracted using the QIAamp Viral RNA Mini Kit and QIAamp DNA Mini Kit (Qiagen, Milan, Italy), respectively, following the manufacturer's instructions.
V3 loop genotyping
The V3 loop sequence was amplified using the Open kit Siemens Healthcare Diagnostics (Milan, Italy) with specific primers for the V3 loop region. The reverse transcriptase polymerase chain reaction (RT-PCR) for HIV-RNA was performed using primers V3S2 (5′–CAGCACAGTACAAT GTACACA–3′) and V3AS5 (5′–CTTCTCCAATTGTCCC TCA–3′). V3 loop genotyping from DNA samples was performed using a nested-PCR, with a first amplification step using V3S2 and V3AS5 oligos and a second step with primers V3S6 (5′–CTGTTAAATGGCAGTCTAGC–3′) and V3AS3bis (5′–CAATTTCTGGGTCCCCTC–3′). Amplification products were tested on 2% agarose gel and positive samples were sequenced using V3S6 and V3AS3bis primers (“OpenGene automated DNA sequencing system,” Siemens Healthcare Diagnostics, Milan, Italy).
Genotypic prediction of tropism
Virus tropism was inferred using geno2pheno[coreceptor] and net charge rule. The geno2pheno[coreceptor] predictions were obtained using different FPR cut-offs (
To calculate NC values, the amino acid sequence corresponding to the V3 loop was analyzed using the online tool Peptide Property Calculator available at
Production of env expression vectors
RNA was extracted from 1 ml of patients plasma using the QiAmp Viral RNA Mini Kit (Qiagen, Valencia, CA). The cDNA synthesis was performed starting from 1 μg of RNA with the Superscript First-Strand Synthesis System for RT-PCR (Invitrogen, Carlsbad, CA). The full-length env gene was amplified with primers Env1ADeg 5′–CACCGGCTTA GGCATYTCCTATGGCAGGAAGAA–3′ and Env1MDeg 5′–TADCCCWTCCAGTCCCCCCTTTTCTYTTA–3′. If necessary, a nested-PCR was performed with Env1 5′–TAG GCATCTCCTATGGCAGGA–3′ and Env2 5′–GCTCCAT GTTTTTCCAGGTC–3′. PCR products were purified using the NucleoSpin Extract II Kit (Macherey-Nagel) and cloned into the pcDNA3.1D/V5-His Topo vector (Invitrogen). Clones bearing inserts were identified by restriction digestion and sequenced using the Big Dye terminator kit (Applied Biosystems, Foster City, CA) on an Applied Biosystems Automated Sequencer (Applied Biosystems). Sequence analyses were performed using Sequencher and Bioedit software packages, together with the tools available at the HIV Sequence Database (
Pseudovirus production
Viral pseudotypes were produced by cotransfecting 4 μg of env expression vector with 8 μg of HIV-1 backbone (pNL4-3.Luc.R-E-) into 293T cells using the FuGENE 6 Transfection Reagent (Roche). Twenty-four and 48 h posttransfection, the pseudovirus-containing supernatant was collected, filtered, and stored at −80°C. HIV-1 molecular clone pNL4-3.Luc.R-E- was obtained from the Centre for AIDS Reagents, NIBSC, and was donated by Dr. Nathaniel Landau, Aaron Diamond AIDS Research Center, The Rockefeller University.
TCID50 evaluation
TZM-bl cells were grown in Dulbecco's modified Eagle's medium (DMEM) supplemented with 10% fetal bovine serum (FBS). A total of 104 cells were infected with serial dilutions of the pseudotyped viruses in 96-well plates. After 48 h, the cells were lysed and analyzed using the Luciferase Assay System (Promega).
Coreceptor tropism testing in U87 cell lines
U87 stably expressing CD4 and either CCR5 (U87_CD4+CCR5+) or CXCR4 (U87_CD4+CXCR4+) were cultured in DMEM+15% FBS supplemented with 1 μg/ml puromicin and 300 μg/ml geneticin. Cells were plated at 104 cells/well and infected with HIV-1 pseudoviruses at a 100-10-1 TCID50/ml dose after 24 h. A luciferase assay was performed after 48 h as a TZM-bl cells assay. Infection experiments were performed in quadruplicate. U87 cells expressing chemokine coreceptor were obtained from the Centre for AIDS Reagents, NIBSC, and were donated by Dr. Littman and Dr. HongKui Deng.
Statistical analyses
The statistical significance of observed differences was assessed using the Mann–Whitney test for continuous variables and Fisher's exact test for discrete variables. The significance of the association between nonparametric variables was assessed using Spearman's rank correlation coefficient. The correlation between the categorical outcomes of different assays was assessed using Cohen's kappa statistics.
Results
Tropism characterization using geno2pheno[coreceptor]
We first analyzed the sequences included in the dataset using G2P. The majority (71%) of sequences obtained from plasma samples showed R5 tropism, similar to what was reported in previous studies. 34,35 This result can be related to the presence of 32% of ART-naive patients in our cohort, since R5 viruses are predominant in the first stages of infection. 36 –38 Accordingly, the prevalence of R5 viruses in plasma samples was higher in naive patients compared to ART-experienced patients (61% vs. 48%, p=0.069; Fisher's exact test).
One of the major issues for the use of G2P predictions is the choice of the FPR cut-off value for tropism determination in DNA samples. In particular, the choice of a higher cut-off for the prediction increases the sensitivity in detecting X4 variants, while leading to higher chances of false-positive results. In this study we compared the predictions obtained applying 10% and 20% cut-off values to cell-derived sequences included in our dataset. When a 20% FPR cut-off was applied, the percentage of X4 predicted variants was higher compared to what was observed in sequences from plasma (cells: 61% R5 and 39% X4; plasma: 71% R5 and 29% X4). Lowering the FPR cut-off to 10% in cell-derived sequences reduced the frequency of X4 viruses 37.5% to 23.9%, leading to similar proportions of X4 and R5 sequences in plasma and cell compartments (Fig. 1).

Effects of false-positive rate (FPR) cut-off choice on the frequency of R5 and X4 variants identified by the geno2pheno[coreceptor] (G2P) method in cell-derived samples. For plasma samples, the FPR cut-off was set at 10%.
Paired plasma and cell samples were available for 10 patients. Among these patients (ART naive), 6/10 (60%) have shown concordant results with 10% FPR setting for DNA prediction. In one sample the DNA-based prediction changed after increasing the FPR cut-off to 20%, decreasing the concordance to 50%. Notably, in all the discordant pairs, the plasma sequence was predicted as R5 and the DNA sequence was predicted as X4.
Amino acid distribution at specific V3 positions correlates with tropism predictions
Many studies reported a link between the presence of specific amino acidic residues in V3 and tropism. 35 In X4-tropic variants, positive residues (K, R) are often retrieved at positions 11 or 25 of the V3 loop, an association that is commonly referred as “the 11/25 rule.” According to this rule, the presence of positive residues (K or R) in positions 11 or 25 is sufficient to identify X4-tropic viruses and these positions are the main determinants of tropism prediction. 39 The presence of positively charged residues at positions 11/25 is also associated with NC as demonstrated by Clevestig et al. 28 and more recently by Tan et al. 40
In our dataset, the presence of positive residues in at least one of these positions was significantly associated with X4 tropism predicted by G2P and by the increase in NC. Residues that are known to be associated with tropism can be included in algorithms for genotypic determination of tropism; thus the identification of other residues involved in coreceptor usage is of interest. By checking the frequencies of different amino acids in V3, we observed a significant association between the presence of positively charged amino acids at position 32 and both G2P and NC inferred X4 tropism. Figure 2 shows the frequency of K/R at positions 11, 25, and 32, demonstrating the distribution of positive charges in the groups according to NC-based and G2P-based tropism predictions.
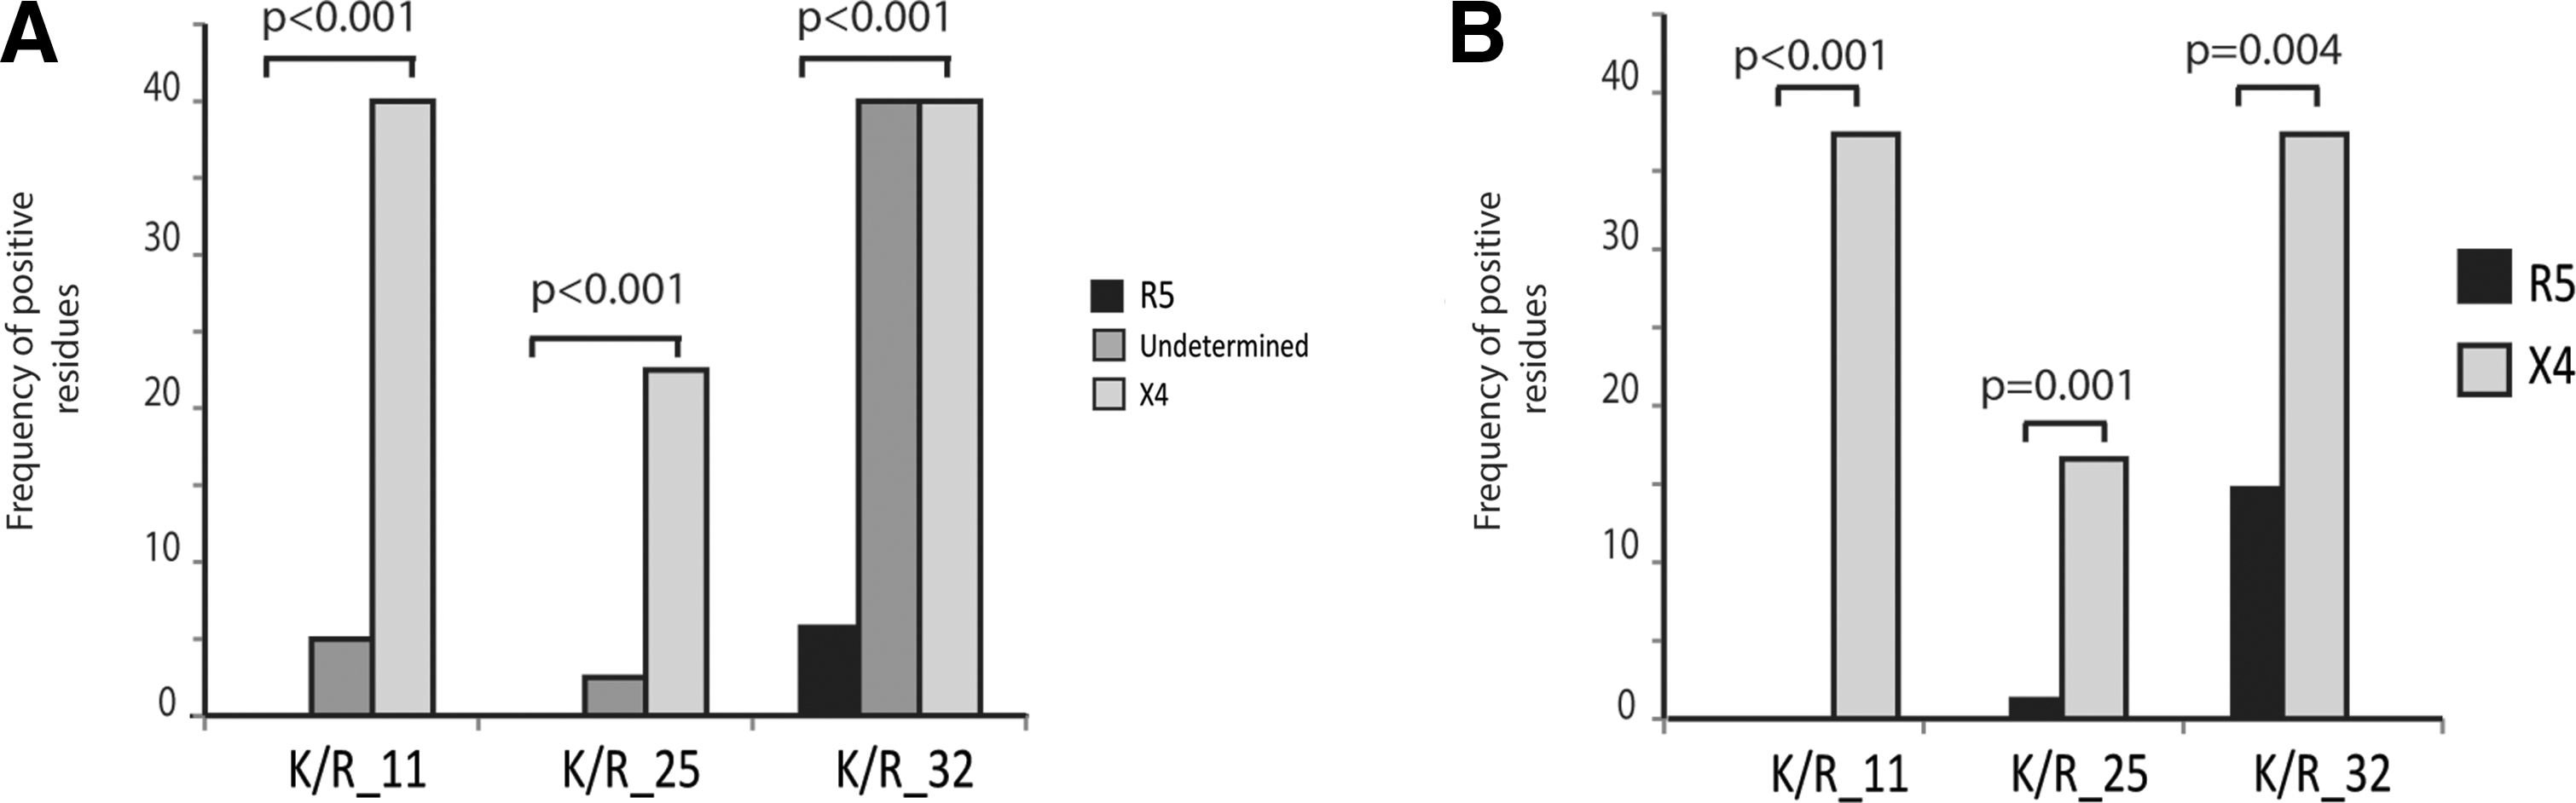
Frequencies of positive amino acids at positions 11, 25, and 32 within R5 and X4 variants as determined by NC method
Predictions based on FPR and NC are concordant in the majority of cases
The comparison between G2P output and V3 NC results was performed by two-way stratification according to FPR and NC values (Fig. 3). Stratification of NC values was done using 4 and 5 breakpoints, based on previous published observations by Clevestig et al. 28 For G2P classification, a 10% cut-off was used. After stratification, we obtained the following groups: concordant sequences, including R5 concordant sequences (NC values below 4 and FPR above 10%) and X4 concordant sequences (NC values above 5 and FPR below 10%), and undetermined sequences (NC values between 4 and 5). Sequences with features different from the above were classified as discordant (Fig. 3A).
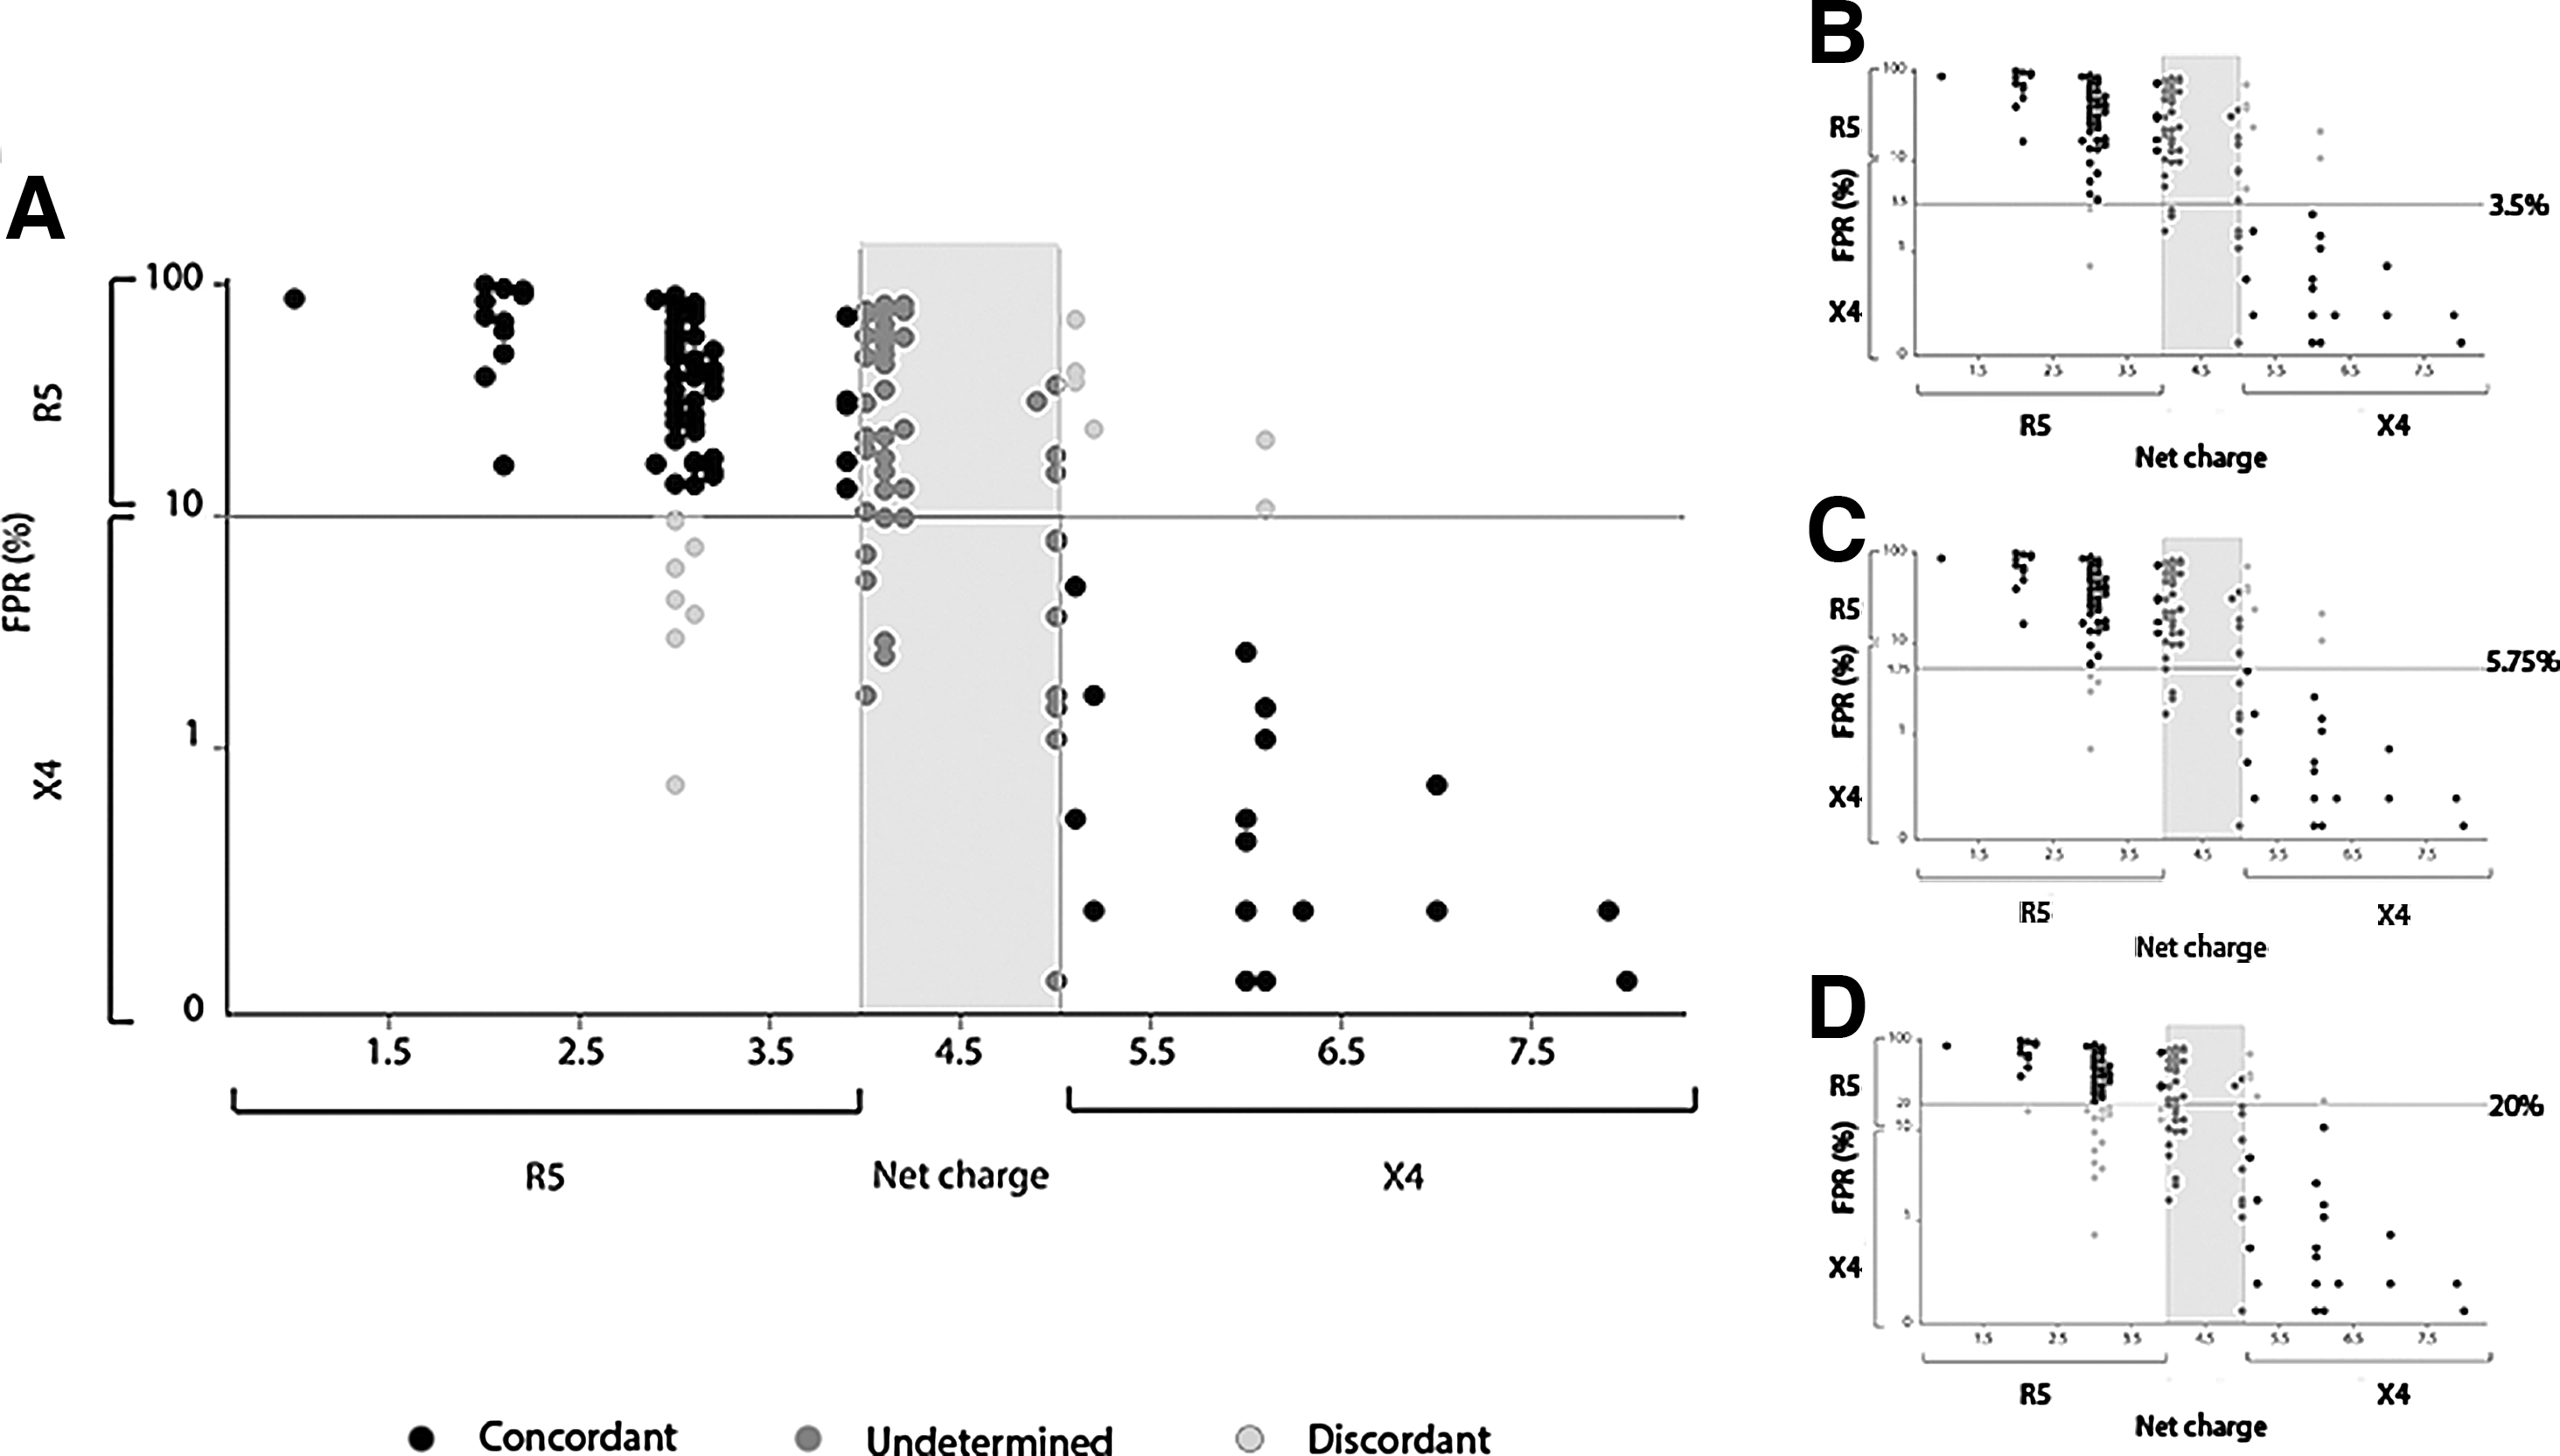
Results of the stratification performed according to the NC and G2P methods. The stratification was performed according to different FPR cut-offs: 10%
Overall, 64% of sequences were assigned to the concordant group, 8% were assigned to the discordant group, and 28% were classified as undetermined. Sixty-one percent of the sequences predicted as X4 by G2P showed NC values higher than 5, whereas 76% of sequences predicted as R5 by G2P had NC values lower than 4.
Taking into account only the sequences that could be classified with both methods, the concordance between G2P and NC predictions was 89.5% (Cohen's kappa coefficient=0.68, p<0.0001). Predictions were discordant for 14 sequences (8%): 6 were classified as R5 according to G2P and as X4 according to NC, whereas 8 were classified as X4 according to G2P and as R5 according to NC. None of the sequences that were included in the discordant group had positive residues in position 11 or 25, although 5 out of 14 displayed Q32K/R mutation.
In the undetermined group, which included sequences with NC values between 4 and 5, 35% and 65% of samples were classified X4 and R5 by G2P, respectively. The median FPR values of sequences with the same G2P inferred tropism were different between the concordant and the undetermined group: the median FPR of X4 variants was lower in the concordant group (0.4% vs. 2.9%, p<0.01 Mann–Whitney test), whereas the median FPR of R5 variants was higher (36.95% vs. 50%, p<0.05 Mann–Whitney test). Positive residues at positions 11 and 25 were present only in a small percentage of the sequences included in the undetermined group (8% position 11, 10% position 25); however 66% of sequences showed Q32K/R mutation.
The stratification was repeated using different FPR cut-offs, such as 3.5%, 5.75%, and 20% (Fig. 3). Cut-off values lower than 10% slightly lowered the proportion of discordant results (5.8% and 5.2%, respectively), whereas 20% FPR significantly increased the percentage of discordant predictions to 15.7% (p<0.05).
Predictions based on NC values can improve G2P predictions
A phenotypic assay was performed on a representative set of patients (n=8) to verify the accuracy of genotypic methods. Sixteen env sequences (6 concordant, 8 undetermined, and 2 discordant) were cloned and used to generate pseudotyped viruses (Table 1). For three patients multiple variants derived from the same patient were included in the analysis. Cohen's kappa coefficients were calculated to measure the agreement between the two methods and the phenotypic assay, showing high concordance between NC and the phenotypic assay (Table 2). The concordant group consisted of sequences that were all correctly classified by the two methods. The undetermined group included 8 sequences with NC values between 4 and 5: 2 were classified as X4 by G2P while 6 were classified as R5 variants. The phenotypic assay showed that 4 out of 8 env sequences included in this group were able to use both CXCR4 and CCR5 coreceptors in vitro, linking intermediate NC values to dual-tropic variants.
G2P, genoapheno; NC, net charge.
Two discordant sequences were analyzed by phenotypic assay: the first was classified as an X4-tropic variant by G2P despite the absence of positive residues in positions 11, 25, or 32 and an NC lower than 3.0; the second was classified as R5 by G2P and lacked positive residues in 11/25, but harbored the Q32K mutation and had an NC value above 5. For both sequences the phenotypic assay confirmed NC-based predictions, suggesting that in the presence of discordant results between NC and G2P, further genotypic methods, such as the 11/25 rule, should be applied to sequence interpretation for a tropism prediction close to the phenotypic determination.
Of note, in one of the patients analyzed, we found variants with equal NC values and very similar FPRs showing different tropism at the phenotypic assay. Out of four viruses derived from clones, two infected U87_R5+ cells but were not able to infect U87_X4+ cells, one was a pure dual-tropic virus (able to infect U87_R5+ and U87_X4+ with the same efficiency) and one infected U87-R5+ more efficiently than U87_X4+ as indicated by a higher luminescence signal. When the V3 regions sequence was analyzed we found that the two DM variants harbored an S-to-G mutation at position 11. Compared to the clones exhibiting R5 tropism, dual variants harbored some mutations in the sequence of regions outside V3 (Fig. 4). Furthermore, a number of mutations distinguished the C1 and V1V2 regions of the pure DM variant from the R5 and the dual strain with low X4 usage efficiency, including the mutation V87R, which was previously associated with DM/X4 tropism. 18
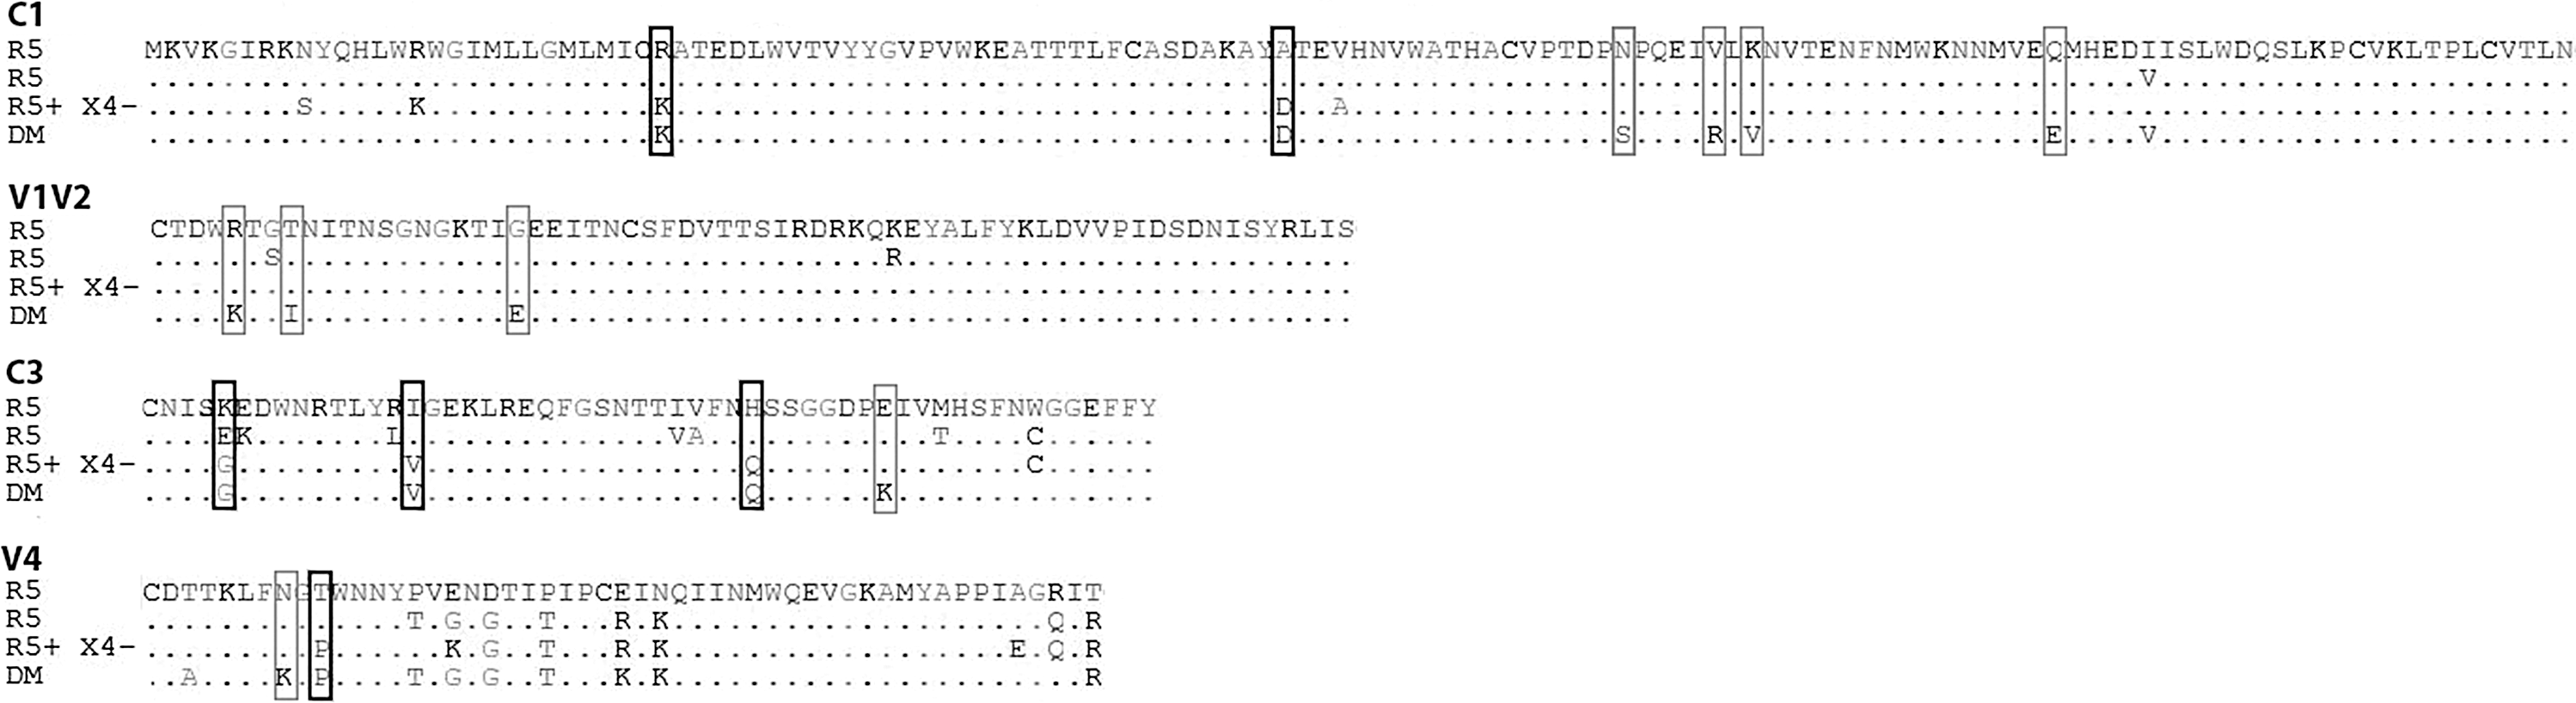
Alignment of gp120 sequences (regions C1, V1/V2, C3, and V4) of four isolates deriving from the same patient displaying different tropism at the phenotypic assay despite showing very close net charge and FPR values. R5 indicates variants using only the CCR5 coreceptor and R5+X4− indicates the variant with higher luminescence in the presence of U87_CCR5 cells and lower luminescence with U87_CXCR4 cells. DM indicates the pure dual variant. Black boxes show the amino acid changes between pure R5 and dual variants, whereas gray boxes highlight the differences between the R5+X4− and the DM strains.
Discussion
The introduction of CCR5 antagonists in clinical practice has strongly stimulated scientific research on HIV-1 coreceptor usage. Administration of CCR5 inhibitors requires sensitive and accurate tropism determination, since drug usage in patients infected by a minority of X4-tropic variants could promote the replication of these strains, inducing antiretroviral treatment failure.
Genotypic assays are more practical alternatives to phenotypic assays for the evaluation of viral tropism before treatment of CCR5 antagonists in the clinical routine. According to the literature, concordance between genotypic assays and the gold standard phenotypic test is high, ranging from 63% to 76%. 41 –46 However, when multiple bioinformatics algorithms are tested on the same sample, their results are discordant or in contrast to the phenotypic assay in 30–50% of cases. 47 In this study we evaluated whether the combination of two different genotypic methods, geno2pheno[coreceptor] and net charge analysis, could improve the accuracy of tropism determination. We analyzed 172 sequences from 143 patients, forming a heterogeneous group both for disease stage and antiretroviral treatment. We observed a good association between the G2P and NC methods for the sequences with NC values below 4.0 and above 5.0, suggesting the application of this parameter as an additional tool for tropism determination. Moreover, even if on a limited number of sequences, our results revealed a correlation between intermediate NC values (between 4 and 5) and the presence of dual variants.
The prevalence of X4 variants varies significantly between different groups of patients, depending on transmission route, stage of disease, and patient-related characteristics. 48 –50 To obtain a cohort reflecting the structure of the HIV patient population, we included in the study a group of patients consecutively tested in two different Italian hospitals. In this cohort, according to G2P analysis (FPR=10%), the majority of samples harbored R5 viruses, while X4 tropic viruses were identified in 26% of samples.
Our study group included a consistent proportion of ART-naive patients (32%). Among this subset of patients, X4-tropic viruses were identified in 29% of samples using G2P (FPR=10%), a result that partially disagrees with previous studies in which the proportion of X4 viruses in naive subjects is reported to be lower than 20%. 34,36,51,52 This discrepancy is likely related to the heterogeneity of the ART-naive population analyzed in this study, which includes patients diagnosed in both early and late stages of infection.
The FPR cut-off is a fundamental parameter for optimal interpretation of G2P predictions and the optimal choice of this value is still debated. 45 Retrospective analysis of the MVC licensing studies suggested a G2P FPR cut-off of approximately 5.75, 46 while the European guidelines recommend the use of 20% in DNA samples to obtain a higher sensitivity in the detection of minority variants. 33 Nevertheless, recently prospective studies demonstrated that setting FPR to 10% provided a clear discrimination between responders and nonresponders to MVC-containing regimens, and applying this cut-off to the analysis produced fewer incorrect X4 classifications. 53,54 Using the current European Guidelines recommendations 33 (20% FPR cut-off for DNA samples), 39% of the sequences included in our dataset were classified as X4-tropic variants. As expected, the frequency of X4-tropic viruses was strongly reduced after lowering the FPR to 10% in the cellular compartment. In addition, using a 10% FPR cut-off, the frequency of X4-tropic variants better matched the frequencies reported in previously published studies that were performed using both phenotypic and genotypic assays. 34,38,55 These findings support the choice of a 10% FPR cut-off for both RNA and DNA samples as a good compromise between high sensitivity and low risk of having false-positive results.
Cellular samples are the only source of tropism prediction in patients with undetectable viremia; thus, a reliable tropism evaluation starting from sequences from the cell compartment is needed. The majority of paired plasma and PBMC samples included in our analysis were concordant, with discordant results due to the presence of X4 variants in PBMCs and R5 variants in the correspondent plasma samples. Although obtained for a limited number of samples, the increased detection of X4 variants in cell-derived sequences is consistent with previous reports and with the presence of archived variants in PBMCs. 34,53,56,57
Mutation analysis of the V3 loop confirmed the association between inferred tropism and specific amino acid positions. In particular, positions 11 and 25 were associated with X4 tropism in multivariate analysis. Moreover, we found that positively charged amino acids in position 32 were associated with NC values higher than 5.0 and FPR values lower than 10%, corresponding to X4 tropism. Interestingly, position 32 has been previously identified as a component of the coreceptor binding site, as shown by Sander et al. using a support-vector-machine approach. 39
Positions outside V3 have repeatedly been associated with coreceptor usage, although the high degree of sequence variability in the gp120 region prevented the identification of specific determinants of tropism. A clonal analysis of samples deriving from the Los Alamos HIV Sequence Database identified 16 mutations in the V2 loop associated with either R5 or X4 tropism and demonstrated that inclusion of the V2 sequence in prediction algorithms enhances the accuracy of tropism prediction. 58 More recently, additional mutations potentially associated with R5/DM tropism were identified in the V1V2 region as well as in the C3 region and V4 region. 18 Viral variants harboring similar V3 sequences, but able to use the coreceptors differently, were identified in one of the patients included in the study. The two variants showing DM tropism had identical V3 sequences, but differed in the ability to infect cells harboring the CXCR4 coreceptor. Several positions along all the envelope protein sequence differed between these two clones. This observation supports a role for regions outside V3 in tropism determination; however, it remains to be established whether the improvement in prediction accuracy obtained by including additional regions to genotypic algorithms will be enough to compensate for the additional costs for sequencing and analysis. 31
In this study, we evaluated the accuracy of tropism predictions obtained using NC analysis and G2P alone and in combination. It has been demonstrated that the combination of different genotypic tools as well as the inclusion of clinical parameters can improve the reliability of genotype-based predictions. 59,60 The use of NC in combination with other genotypic methods was initially proposed by Delobel et al. who selected an NC cut-off of 5 to discriminate R5- and X4-tropic variants and used the NC prediction to confirm the results obtained on the basis of the 11/25 rule. 61 Seclén et al. assessed the performances of a combination of NC and 11/25 rule on a group of 150 plasma samples. 57 According to their method, a sequence was classified as an X4 variant if a basic amino acid was recognized at position 11/25 or the NC of the V3 loop was higher than 5. This method showed a high degree of concordance with the phenotypic assay, and performed better than geno2pheno in terms of sensitivity and specificity.
In our study, NC-based tropism prediction identified three groups: NC values below 4 and above 5 were associated with R5 and X4 tropism, respectively, whereas NC values between 4 and 5 could not be associated unequivocally with a tropism. Compared to G2P predictions (FPR:10%), NC inferred tropism was concordant for the majority of sequences; however, in 8% of sequences results were discordant. We performed the phenotypic assay on a set of representative samples of the three groups obtained after NC/G2P stratification in order to evaluate the accuracy of the predictions. The cloning procedure made it possible to avoid ambiguities in the sequence and to unambiguously associate genotypic predictions and coreceptor usage. Taken singularly, the two methods showed a high degree of concordance with the phenotypic method, consistent with what was previously reported by other groups. 47,62
The sequences for which G2P and NC predictions were in agreement were confirmed, whereas in the discordant sequences the phenotypic assay confirmed NC predictions. Although based on a limited number of samples, this observation confirms the optimal correlation between NC predictions for values below 4 or above 5 and suggests its use in combination with G2P as a confirmatory tool. When facing discordant results, we suggest the use of additional genotypic tests, such as the 11/25 rule, as it has been demonstrated that concordance between multiple tools is associated with improved accuracy in tropism prediction. 59
We could not assess the concordance between the two methods for the sequences with NC values between 4 and 5 that were included in the undetermined group. According to G2P analysis, these sequences were evenly distributed between the R5 and X4 groups. Interestingly, the median FPR values of R5 and X4 variants significantly differed between concordant and undetermined sequences, with sequences belonging to the undetermined group presenting intermediate FPR values. The switch from R5 to X4 tropism is generally described as a stepwise process in which X4 variants gradually arise from R5 variants through a series of consecutive mutations that modify the coreceptor affinity of the virus. 63,64 Previous studies identified a correlation between FPR values and the preferential use of CCR5 and CXCR4. 65 Considering these findings, the intermediate FPR values observed in the undetermined group can reflect the presence of viruses that are gaining X4 affinity and decreasing R5 affinity, possibly corresponding to DM variants.
Interestingly, we found that four of eight of the sequences that were classified as undetermined by NC analysis belong to dual-tropic variants. Of note, only one of these four dual-tropic variants was identified as a CXCR4-using variant by G2P, and this could represent an issue for the correct identification of patients eligible for CCR5 antagonist therapy.
The response of DM strains in MVC therapy in vivo is still debated and seems to be dependent on the affinity of the variant for the CXCR4 receptor, with the variants showing higher affinity being resistant to treatment. 65 Moreover, many studies reported that coreceptor usage is strongly related to disease progression, being associated either with coreceptor switching in chronic HIV-infected patients 66 or with faster disease progression in acute phase HIV-1-infected patients. 67 In light of these considerations, developing genotypic tools able to distinguish between DM and pure X4 variants will be worthwhile in order to perform accurate coreceptor tropism screening in all HIV-1-infected patients. 51 A possible limitation of this study lies in the use of sequences obtained by bulk sequencing. Although the sequence of the main variant responsible for viral persistence can be detected by bulk amplification, 68 this techniques does not make it possible to determine whether sequences with indeterminate NC values were derived from dual-tropic variants or from the combined presence of pure X4 and R5 variants in the same sample. By generating clones instead of bulk sequences, ultradeep sequencing could overcome this limitation while increasing the sensitivity for detecting minor variants; as a result, it should be preferred in future studies on DM variants.
Although the number of sequences included in the phenotypic assay is too small for statistical validation, we observed that the combination of G2P and NC can substantially improve tropism prediction.
Our results suggest that coupling genotypic algorithms for tropism determination with V3 net charge evaluation can improve the accuracy of genotypic tests, particularly for NC values below 4 or above 5. Further studies are needed to confirm whether NC-based predictions can be used to evaluate the presence of DM variants.
Footnotes
Author Disclosure Statement
No competing financial interests exist.