
Abstract
HIV-1 samples submitted by clinicians from the United States for routine drug susceptibility testing (PhenoSense GT) were evaluated for genotypic and phenotypic resistance to darunavir and other protease inhibitors (PIs). Among these samples (Monogram Biosciences database January 2006–June 2012; N=78,843), isolates harboring zero IAS-USA darunavir resistance-associated mutations (RAMs) increased from 77.7% in 2006 to 92.8% through the first half of 2012 (H1 2012; upward trend, p=0.0008); a downward trend seen for samples with three or more darunavir RAMs (7.5% in 2006 and 2.6% in H1 2012; p=0.002). Among samples with any PI resistance (N=15,932), samples harboring zero darunavir RAMs gradually increased (39.9% in 2006 vs. 55.0% in H1 2012; upward trend, p=0.005), but three or more darunavir RAMs did not change over time (21.7% in 2006 and 19.2% in H1 2012; p=0.27). During this period, the frequency of the 11 individual darunavir RAMs (IAS-USA 2011 list) decreased among all samples. The frequency of each darunavir RAM in PI-resistant samples decreased or remained relatively stable. The prevalence of samples with phenotypic resistance to darunavir (partial-to-full) decreased over time in all samples (8.2% in 2006 vs. 2.3% in H1 2012), as did resistance to other PIs (p<0.006 for all PIs). Phenotypic resistance to darunavir and other PIs also decreased in PI-resistant samples (darunavir: 23.9% in 2006 vs. 17.1% in H1 2012; p<0.013 for all PIs). Since approval of darunavir in 2006, there was a significant decrease in prevalence of samples with genotypic and phenotypic resistance to darunavir in commercially tested HIV-1 isolates. Furthermore, the prevalence of phenotypic resistance to darunavir was lower than all other PIs.
Introduction
T
In common with other boosted PIs, long-term clinical trial data show that treatment failure on darunavir/r is associated with a low probability of resistance development. 7 –11 The resistance profile of darunavir is well characterized with a distinctive list of 11 darunavir RAMs. 10 –12 The presence of one or two of these darunavir RAMs does not confer significant phenotypic resistance, with data suggesting that an accumulation of at least three darunavir RAMs is required before the virologic efficacy of darunavir is compromised. 10,11,13
Although examination of the epidemiology of drug resistance can provide important insights into future ARV management, few studies have described the epidemiology of drug-resistant HIV among treatment-exposed patients. Furthermore, most of these studies are cross-sectional and have only investigated the prevalence of RAMs without phenotypic drug susceptibility data. 14 –21 Nevertheless, these diverse studies have consistently shown the prevalence of darunavir RAMs in clinical populations to be low.
Since its approval in 2006, use of darunavir has changed due to its approval in different patient populations and changing recommendations in the U.S. clinical guidelines. 22 We therefore wished to examine how the prevalence of darunavir resistance has changed throughout this period. To assess potential changes in the prevalence of darunavir RAMs and phenotypic resistance over time in the United States, we evaluated over 75,000 samples received by Monogram Biosciences for routine commercial resistance testing (PhenoSense GT; South San Francisco, CA). The primary objectives were to assess the potential changes over time in the frequency of darunavir RAMs and phenotypic resistance, overall, and in isolates with evidence of reduced PI susceptibility. We also examined how the prevalence of phenotypic resistance to other commercially available PIs changed during this period.
Materials and Methods
Clinical samples
HIV isolates (N=78,843; mostly subtype B) submitted from a large number of clinical centers across the United States to Monogram Biosciences between January 2006 and June 2012 for routine clinical resistance testing (PhenoSense GT) were analyzed for genotypic and phenotypic resistance. Paired genotypic and phenotypic test results from deidentified samples were utilized for further analyses. Samples from research studies and clinical trials were excluded. If multiple samples from the same patient were submitted for resistance testing at different time points over the course of this analysis, resistance test results from all time points were included.
Assessment of genotypic resistance to darunavir in clinical samples
The prevalence of darunavir RAMs was studied in all samples received, and also in the subset of samples with evidence of PI resistance. Darunavir RAMs examined were those previously characterized by De Meyer et al. 11 and were described in the International AIDS Society (IAS)-USA 2011 darunavir RAMs list 23 (unchanged in the 2013 update 12 ): V11I, V32I, L33F, I47V, I50V, I54L/M, T74P, L76V, I84V, and L89V. The prevalence of each of the individual darunavir RAMs was evaluated at yearly intervals between 2006 and the first half of 2012. In addition, the proportion of samples with zero, one, two, or three or more darunavir RAMs was also recorded over this time period.
The mean number of all IAS-USA major PI RAMs 23 was also calculated over time; major PI RAMs analyzed were D30N, V32I, M46I/L, I47A/V, G48V, I50L/V, I54L/M, Q58E, T74P, L76V, V82A/F/L/S/T, N83D, I84V, N88S, and L90M.
Assessment of phenotypic resistance to darunavir and other PIs in clinical samples
Phenotypic darunavir resistance was defined by fold change (FC) in 50% inhibitory concentration (IC50) greater than the previously defined lower phenotypic clinical cut-off (partial to full resistance; darunavir/r cut-off >10, which is the FC in IC50 value at which the start of a gradual reduction in HIV RNA response was demonstrated). 10,11,24 Phenotypic PI resistance was defined by FC in IC50 greater than the lower clinical cut-off for at least one PI, regardless of resistance to other classes; these clinical cut-offs were previously determined as the best discriminator of reduced clinical response using drug-specific clinical outcome data. The following cut-off values were used (/r denotes with low-dose ritonavir): amprenavir/r: >4.0; atazanavir: >2.2; atazanavir/r: >5.2; indinavir/r: >10; lopinavir/r: >9; nelfinavir: >3.6; saquinavir/r: 2.3; and tipranavir/r: >2.0 using the PhenoSense GT. Median darunavir FC and the prevalence of samples with phenotypic resistance to darunavir/r (partial to full; defined above) were assessed at yearly intervals. In addition, the prevalence of samples with phenotypic resistance to other commercially available PIs (defined by FC>lower clinical cut-off, defined above) was also assessed at yearly intervals.
Prevalence data and statistical analysis
Throughout the analysis, results for prevalence of genotypic and phenotypic resistance over time were expressed as annual proportion of (1) all samples and (2) samples with phenotypic PI resistance. Changes over time were evaluated using a statistical trend analysis (one-sided Jonckheere–Terpstra significance test on yearly data used when there is an a priori ordering of independent samples, in this case with time). Trend tests were used to examine genotypic and phenotypic resistance to darunavir, as well as all commercially available PIs. A one-sided Wilcoxon test was used to determine the statistical significance of the lower prevalence of resistance to darunavir compared with the other PIs.
Results
Demographic data
Overall, 78,843 clinical isolates submitted to Monogram for routine resistance testing between January 2006 and June 2012 were analyzed. The number of samples submitted per year was fairly evenly distributed over the time period of the study (standard deviation of N across the years=2,197).
Overall genotypic prevalence data
During the study period, the prevalence of routine clinical samples (N=78,843) harboring zero darunavir RAMs increased over time (Fig. 1a; upward trend, p=0.0008). Accordingly, a decrease was seen in the prevalence of samples with three or more darunavir RAMs (IAS-USA 2011 list 23 ) in the overall sample population; a downward trend was seen from 7.5% in 2006 to 2.6% in the first half of 2012; p=0.002) (Fig. 1a).

Proportion of samples harboring zero, one, two, or three or more darunavir RAMs (from IAS-USA 2011 darunavir RAMs list
23
: V11I, V32I, L33F, I47V, I50V, I54L/M, T74P, L76V, I84V, and L89V) among
The prevalence of each of the 11 individual darunavir RAMs also decreased over time among routine clinical samples (Fig. 2a). Of the 11 darunavir RAMs, L33F (minor IAS-USA PI RAM 23 ) and I84V (major IAS-USA PI RAM) were the two most prevalent in the overall sample population throughout the study period. These two RAMs showed a marked decrease (L33F: 11.2% in 2006 to 3.9% in the first half of 2012, p=0.0008; I84V: 10.9% in 2006 to 2.8% in the first half of 2012, p=0.0008).

Prevalence of individual darunavir RAMs (per IAS-USA RAM list
23
)
The mean number of major IAS-USA PI RAMs in the overall population declined throughout the study period from a mean of 1.00 in 2006 to 0.32 during the first half of 2012 (p=0.0008; Table 1).
p=0.0008.
p=0.003.
Statistical trend analysis demonstrated a significant downward trend in overall samples.
H1 2012, first half of 2012; PI, protease inhibitor.
Genotypic prevalence data in samples with any PI resistance
Among the subgroup of samples with any PI resistance (N=15,932), a gradual increase was seen in samples harboring zero darunavir RAMs (39.9% in 2006 vs. 55.0% in the first half of 2012; p=0.005) (Fig. 1b). The percentage of PI-resistant samples with three or more darunavir RAMs did not change significantly over time: 21.7% in 2006 and 19.2% in the first half of 2012 (p=0.27; Fig. 1b).
The frequency of each of the 11 individual darunavir RAMs in PI-resistant samples varied over time, either decreasing or remaining relatively stable (Fig. 2b). Again, the two most prevalent darunavir RAMs in samples with PI resistance were L33F and I84V; the prevalence of both these two RAMs decreased over the study period (L33F: 31.7% in 2006 to 27.1% in the first half of 2012, p=0.012; I84V: 30.8% in 2006 to 20.7% in the first half of 2012, p=0.005).
In samples with any PI resistance, the mean number of major PI RAMs decreased throughout the study from 2.74 in 2006 to 2.15 during the first half of 2012 (p=0.003; Table 1).
Phenotypic resistance to darunavir/r
In the overall cohort, the prevalence of samples with phenotypic resistance (partial to full resistance) to darunavir/r significantly decreased over time (8.2% in 2006 vs. 2.3% in the first half of 2012) (p=0.002; Fig. 3a). The median darunavir FC values remained stable and low (median FC between 0.72 and 0.85 throughout the study; p=0.38) (Table 2).
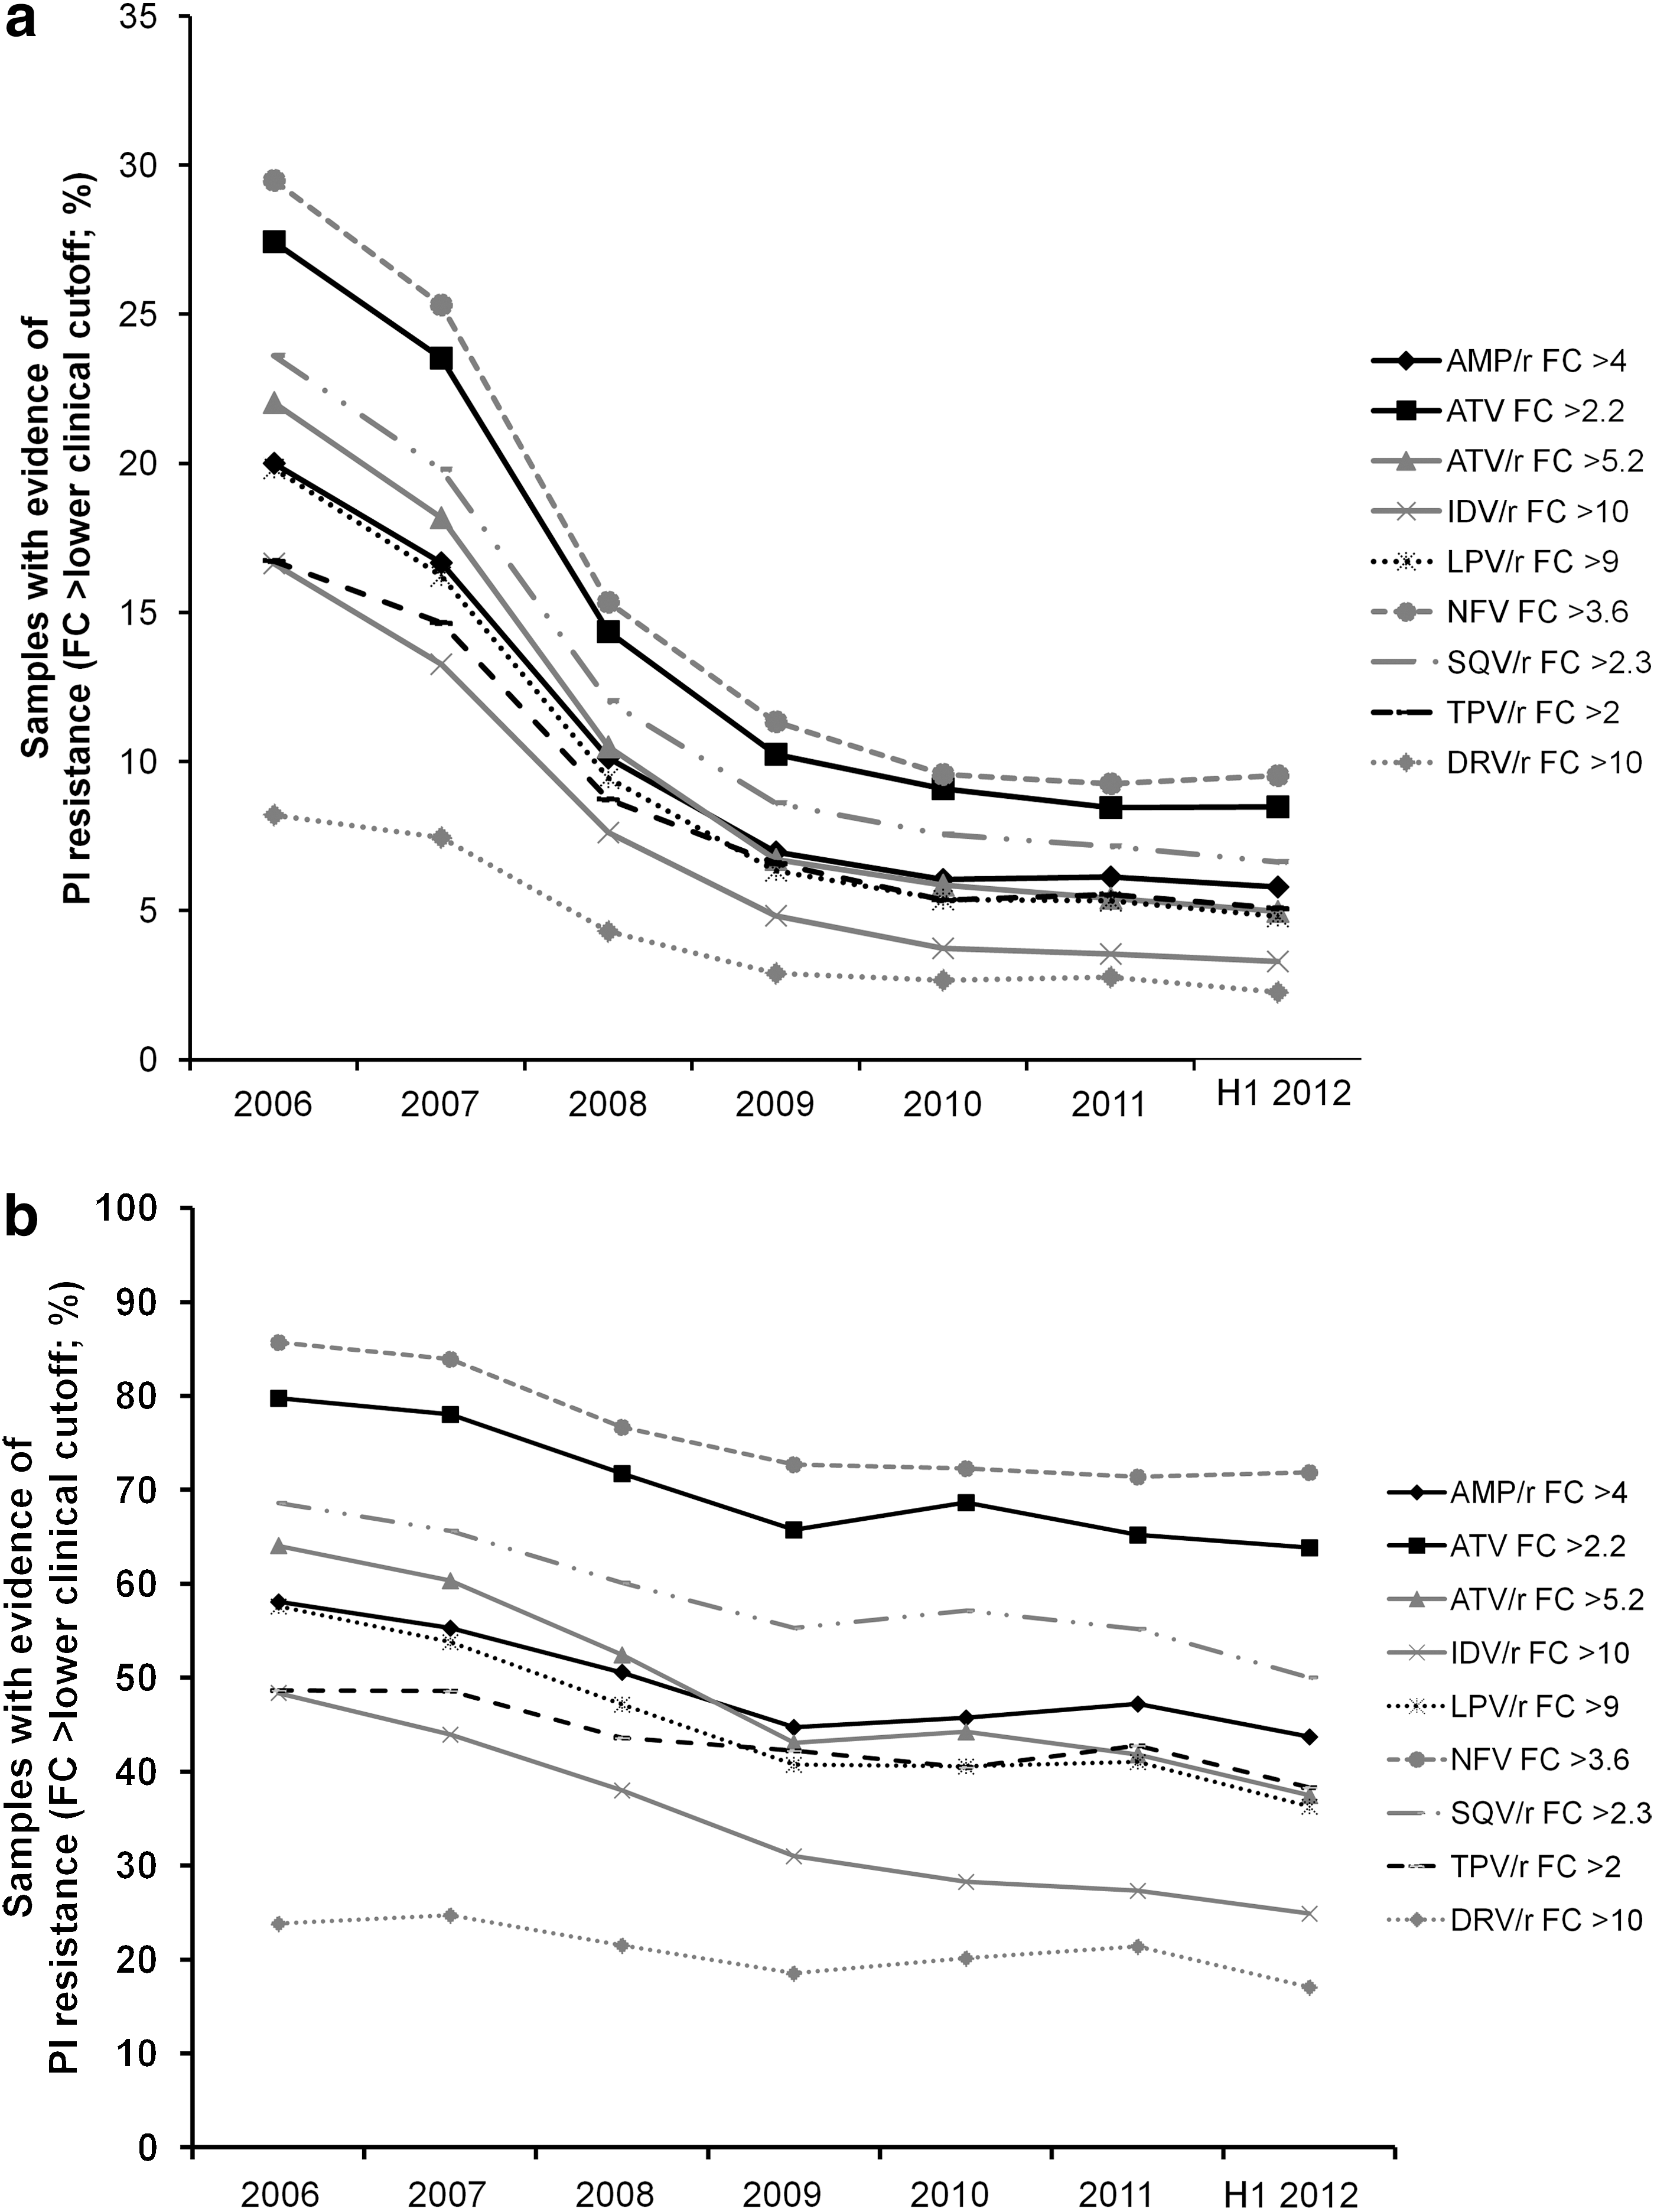
Prevalence of resistance to commercially available PIs (defined by FC>lower clinical cut-off)
Statistical trend analysis demonstrated no significant trend in overall samples, p=0.38.
Statistical trend analysis demonstrated a downward trend in overall samples, p=0.012.
H1 2012, first half of 2012; PI, protease inhibitor.
Among phenotypically PI-resistant samples, the prevalence of isolates with phenotypic resistance to darunavir decreased over time, from 23.9% in 2006 to 17.1% in the first half of 2012 (p<0.025; Fig. 3b). Additionally, the median darunavir FC decreased slightly over time (2.20 in 2006 vs. 1.51 in the first half of 2012; p=0.012; Table 2). Importantly, throughout the duration of the study, the results remained considerably below the lower clinical cut-off of 10 for darunavir/r.
Phenotypic resistance to other PIs
In the overall population, the percentage of samples with evidence of phenotypic resistance (partial to full resistance) to other PIs decreased over time (p<0.006 for all PIs; Fig. 3a). This decrease was generally consistent across the PI class. Comparison of rates of phenotypic resistance showed that although the prevalence of samples with resistance to any of the PIs analyzed decreased annually (Fig. 3a), the order of resistance remained almost the same [in 2006, overall incidences of phenotypic resistance were nelfinavir (29.5%)>atazanavir (27.4%)>saquinavir/r (23.6%)>atazanavir/r (22.0%)>amprenavir/r (20.0%)>lopinavir/r (19.8%)>indinavir/r (16.6%)>tipranavir/r (16.7%)>darunavir/r (8.2%); at the end of the study, in the first half of 2012, overall incidences of phenotypic resistance were nelfinavir (9.5%)>atazanavir (8.5%)>saquinavir/r (6.6%)>amprenavir/r (5.8%)>tipranavir/r (5.1%)>atazanavir/r (5.0%)>lopinavir/r (4.8%)>indinavir/r (3.3%)>darunavir/r (2.3%)]. The only exception was samples with resistance to tipranavir, which changed slightly relative to the other PIs over the study period. In the overall population, the rates of phenotypic resistance to darunavir were lower than all other PIs studied (Fig. 3a) (p<0.001; one-sided Wilcoxon test).
Examination of phenotypically PI-resistant samples also showed that phenotypic resistance to other PIs also decreased over time (p<0.013 for all PIs) (Fig. 3b). As with the overall population, in the PI-resistant population, the prevalence of isolates with phenotypic resistance to darunavir was lower than all other PIs studied (Fig. 3b) (p<0.001; one-sided Wilcoxon test). At the end of the study, in the first half of 2012, incidences of phenotypic resistance in the PI-resistant sample population were nelfinavir (71.9%)>atazanavir (63.8%)>saquinavir/r (50.0%)>amprenavir/r (43.7%)>tipranavir/r (38.3%)>atazanavir/r (37.5%)>lopinavir/r (36.3%)>indinavir/r (24.9%)>darunavir/r (17.1).
Discussion
Since its initial approval in 2006, darunavir has been incorporated into guidelines for use in a wide range of patient populations, 3 –6 making it a valuable treatment option for ARV-naive, as well as treatment-experienced, patients. We showed that from 2006, genotypic and phenotypic resistance to darunavir has decreased significantly in commercially tested HIV-1 isolates, including those with PI resistance. The finding that 92.8% of all patient samples harbored zero darunavir RAMs during the first half of 2012 is especially notable, since once-daily darunavir is now a possible option for treatment-experienced patients with no darunavir RAMs. 3 –5
Although variability is seen, the trends in this commercial cohort of >75,000 samples are in overall agreement with previous longitudinal data as well as several smaller cross-sectional cohort studies examining the prevalence of darunavir resistance in a wide range of clinical populations (although it should be noted that the clinical cohorts vary in terms of geography, age, previous ARV experience, and ARV resistance). 14 –21 These findings show a high prevalence of clinical samples with no darunavir RAMs and a low prevalence of clinical samples with three or more darunavir RAMs, supporting the cohort results from a U.S. clinical population with sampling between 1998 and 2006, where 70% of PI-experienced patients had zero darunavir RAMs. 14 A low incidence of darunavir RAMs was also seen in HIV-infected children in the United Kingdom—96% of ARV-naive children and 84% of ARV-experienced children had zero darunavir RAMs and less than 2% of ARV-experienced and none of the ARV-naive patients had three or more darunavir RAMs. 19 Also, the prevalence of darunavir RAMs in multidrug-experienced patients failing other PIs in Brazil was similarly low (6% having three or more darunavir RAMs). 18
Although the trends are the same, differences were seen between the data presented here and those from a previous longitudinal study, 17 which examined mostly European isolates from the Virco database (Janssen Diagnostics; Beerse, Belgium) undergoing routine clinical resistance testing. Most notably, there is a difference in the overall incidence in the proportion of routine clinical samples with evidence of PI resistance in the two studies (overall 20.2% during the study, according to PhenoSense GT lower CCO versus overall 40.0% during the study, according to VircoTYPE HIV-1 lower CCO). 17 This might suggest that the Virco genotype assay has a lower threshold for defining PI resistance than the Monogram phenotype assay.
This discrepancy between the two studies is probably due to the way PI resistance is defined. The Virco genotype assay calculates quantitative levels of PI susceptibility/resistance based on the presence of resistance-associated mutations, whereas the Monogram phenotypic assay measures the actual resistance level of the HIV virus. Moreover, in general, the lower CCOs for all boosted PIs were lower in the VircoTYPE HIV-1 (version 4.2.01) compared to the current PhenoSense GT lower CCOs. This explains why the observed frequency of samples harboring DRV RAMs was lower in the Virco database compared to the findings observed in this study (most apparent in the PI-resistant samples). Moreover, samples from treatment-experienced patients submitted for phenotypic testing are likely to have more complex genetic patterns and higher levels of resistance compared to samples submitted for genotypic testing.
Qualitative variation may also play a role in the observed differences between the two studies. Geographic variation or differing clinical practices at the time (resulting in differences in the samples sent for testing) may also account for some of the disparity. Nevertheless, despite the differences in the assays, it is notable that the changes in prevalence of both the number of DRV RAMs and the number of specific individual DRV RAMs over time are the same in both studies, with both studies also showing decreasing trends in the prevalence of isolates with evidence of PI resistance.
The decrease in overall prevalence of darunavir resistance in commercially tested isolates over time is consistent with a lower proportion of PI-resistant isolates over time. The decline in resistance to all PIs suggests that pharmacologic pressure exerted by combination therapy results in a general decrease in the mutation rate of the pr gene of HIV-1. Notably, the decline in genotypic and phenotypic resistance to all PIs is more apparent in the overall samples than the PI-resistant samples. This decline could therefore be driven by earlier use of boosted PIs, 25 and the fact that currently there are fewer failures on first-line (or first time) PI-based combination therapy than at the advent of PI-based therapy. 26 Other factors may be increasingly potent drug combinations, better clinical management of the disease, and improvements in resistance information available to the clinician.
The prevalence of each of the 11 individual darunavir RAMs decreased over time in the overall population and, for most darunavir RAMs, also in samples with PI resistance. Of note, during the period of 2006–2009, steep declines in L33F and I84V were seen, with the other mutations showing a moderate decline. In parallel, a steep decline in phenotypic resistance was seen until 2009, when it then leveled out. As no patient demographics or ARV treatment history are available, it is difficult to provide any explanations for these trends. Nevertheless, the genotypic and phenotypic resistance patterns observed here are consistent with our previous analysis from the Virco database during the overlapping period (2006–2009). 17
The prevalence of phenotypic resistance was highest to the unboosted PIs, atazanavir and nelfinavir. The prevalence of resistance to the ritonavir-boosted PIs, atazanavir/r, saquinavir/r, amprenavir/r, and lopinavir/r, was similar. Higher numbers of samples with resistance to unboosted atazanavir and nelfinavir are expected due to their lower genetic barrier to resistance than boosted PIs, as demonstrated previously. 27,28 The prevalence of PI resistance may also have been influenced by the considerable degree of cross-resistance between all PIs. For example, cross-resistance to nelfinavir is extensively observed for patients failing any PI-based therapy. 29
Our findings showed that in both the overall samples and in samples with PI resistance, darunavir exhibits the lowest rates of phenotypic resistance among all PIs. This may be a result of the high genetic barrier to the development of resistance to darunavir compared with the other PIs; accumulations of many PI RAMs are needed before darunavir resistance is observed. 2,11,30 Indeed, previous data have consistently shown that full resistance to darunavir is uncommon in clinical practice; 20,21,31 with darunavir/r efficacy compromised only when three or more darunavir RAMs are present. 11,13 It is therefore reassuring that the overall prevalence of samples with three or more darunavir RAMs fell by two-thirds during the period of this analysis (from 7.5% to 2.6% during the first half of 2012). However, it should be noted that within PI-resistant samples, the presence of three or more darunavir RAMs remained relatively constant (a yearly prevalence of 19–23% throughout the study).
Several limitations need to be considered in this analysis. One limitation is that no protected demographic characteristics of the patients were used in the analysis. Additionally, no information was available regarding patient-specific ARV regimen or PI use. However, since the samples came from the United States, with no filtering of samples, we believe that the findings are representative of U.S. clinical practice. There are also possible limitations in the prevalence data. Since a phenotype test may not always be requested as a first-line resistance test in clinical practice, we cannot rule out that our data overestimate the prevalence of RAMs. Nevertheless, our results still provide important trends on the distribution of RAMs and their impact on resistance to particular ARV drugs.
In conclusion, since darunavir first became commercially available in 2006, there has been a significant decrease in genotypic and phenotypic resistance to darunavir and other HIV PIs in commercially tested HIV-1 isolates. Our data also show that throughout this period, darunavir exhibited the lowest rates of phenotypic resistance among the HIV PIs.
Footnotes
Acknowledgments
The authors thank the participants, study center staff, and Janssen study personnel. We would like to thank Katia Boven, Chrispin Kambili, and Eric Wong from Janssen for their important contributions to the manuscript, and Laura Napolitano and Yolanda Lie from Monogram Biosciences for participating in the study design.
We are grateful to the Monogram Biosciences Clinical Reference Laboratory for performance of all phenotype and genotype assays. The analysis was supported by Janssen. Medical writing support was provided by Patrick Hoggard of Zoetic Science, an Ashfield Company, Macclesfield, UK; this support was funded by Janssen.
All authors substantially contributed to the conception of the analysis and had a significant involvement in the interpretation of data herein. All authors were involved in the development of the manuscript, have read and approved the final version, and have met the criteria for authorship as established by the ICMJE.
These data were previously presented at the 20th Conference on Retroviruses and Opportunistic Infections, Atlanta, GA, March 3–6 2013. Abstract and poster 590.
Author Disclosure Statement
The authors have the following conflicts of interest to declare: E.L., S.G., S.D.M., and B.B. are full-time employees of Janssen. M.H. and A.P. have received salary in the past 3 years from Monogram Biosciences and its parent company, LabCorp, and own LabCorp stock.