
Abstract
Acute HIV-1 infection is characterized by the rapid generation of highly diverse genetic variants to adapt to the new host environment. Understanding the dynamics of viral genetic variation at this stage of infection is critical for vaccine design efforts and early drug treatment. Here, using a high-resolution deep sequencing approach targeting the HIV-1 gag region, we reveal very early immune pressure with dramatic subpopulation shifts in a single acutely infected participant providing further insight into the genetic dynamics of acute HIV-1 infection.
Introduction
A
Revealing the dynamic genetic adaptations of HIV-1 under immune selection pressure in the new host environment is essential for an improved understanding of viral pathogenesis and for efforts to develop a universal vaccine. Multiple studies provide support that a single founder HIV-1 virus per patient is responsible for establishing the majority of productive infections. 8 –11 In the weeks following viral transmission the founder genotype undergoes an unprecedented expansion in the mutational space enabled through the replicative error rate of the viral reverse transcriptase (RT) enzyme at ∼10–3.6, a rapid generation output of ∼1010 virions per patient per day, and the propensity of RT to mediate RNA recombination via template switching. 12 –17 Host CTL responses targeting HIV-1 epitopes are the major immune selection force driving the evolution of early viral sequences (other than env) during acute infection. 18 –22 Here we use a deep sequencing approach to define the immunodominant HIV-1 gag gene at serial time points around peak viremia and provide high-resolution genetic detail into the evolutionary dynamics of viral adaptation in a single case of acute HIV-1 infection.
Participant Information
Samples from an HIV-1-infected person enrolled in the NIH-funded Acute Infection Early Disease Research Program (AIEDRP) were obtained under University of California, Los Angeles, Institutional Review Board exempt protocol. The HLA genotype, viremia level, and percent CD4+ and CD8+ cell count measurements from the first six sample collection visits are shown in Fig. 1. Viremia at the first two visits (27 and 36 days post-symptoms onset) remained relatively stable at ∼3.5×10⁵ viral RNA copies/ml plasma. At visit 3 (V3—day 43) the participant had the highest viremia detected at 1.21×10⁶ viral RNA copies/ml plasma, which subsequently dropped over 4-fold to 2.83×10⁵ a week later by V4 (day 50). At 83 days post-symptoms onset (V5) viremia decreased over 15-fold to its lowest point during the study duration at 1.8×10⁴ viral RNA copies/ml plasma, and then rebounded slightly over 2-fold to 4.07×10⁴ by V6 (day 113). The percentages of CD4+ and CD8+ T lymphocytes remained relatively constant over the duration, at a median CD4% of 32.3% (range 27.4 to 35.5%) and a median CD8% of 47.8% (range 38.8 to 50.1%). Plasma samples from V4–V5 were excluded from our analysis due to availability. V1–V3 and V6 were evaluated by deep sequencing.
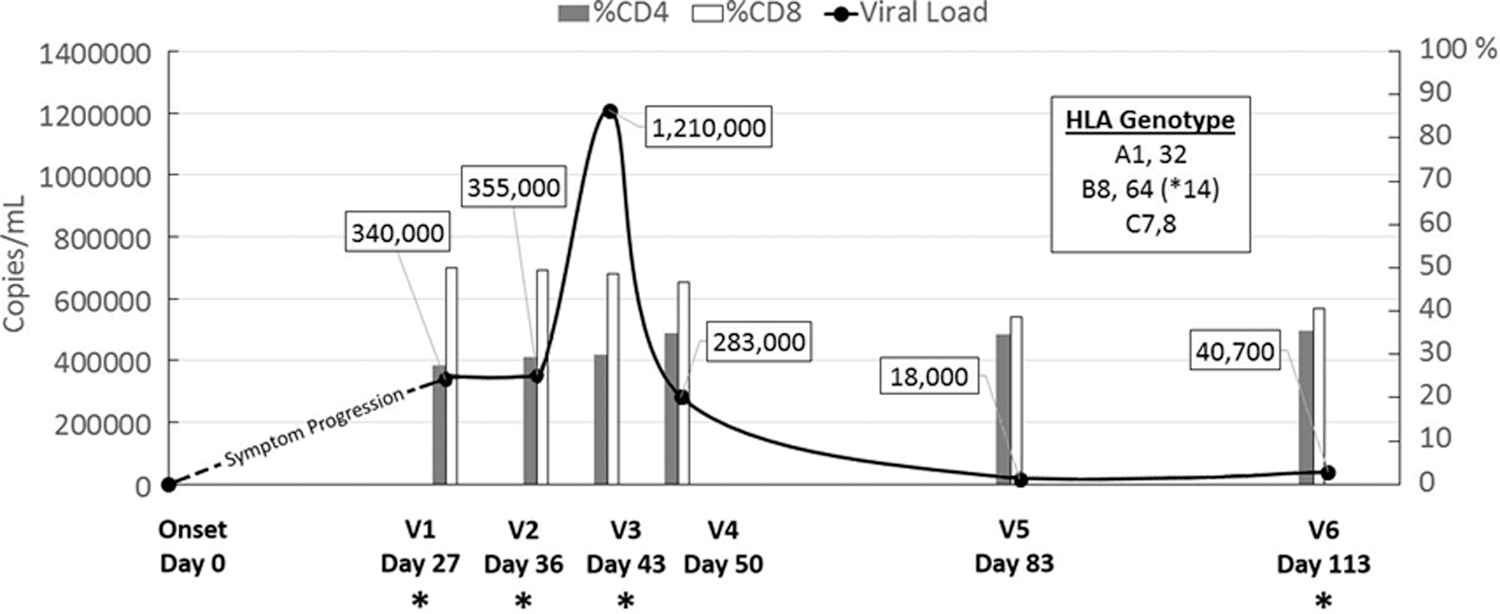
The acute infection profile of a study participant. The smooth curve depicts changes in viremia (viral RNA copies/ml plasma) whereas the bar chart shows CD4% (gray) and CD8% (white) cell count per ml of peripheral blood mononuclear cells (PBMC) at each visit sample collection time point. The HLA genotype of the study subject is provided as a boxed inset. Visit samples chosen for deep sequencing are denoted by an asterisk.
Sequencing Approach
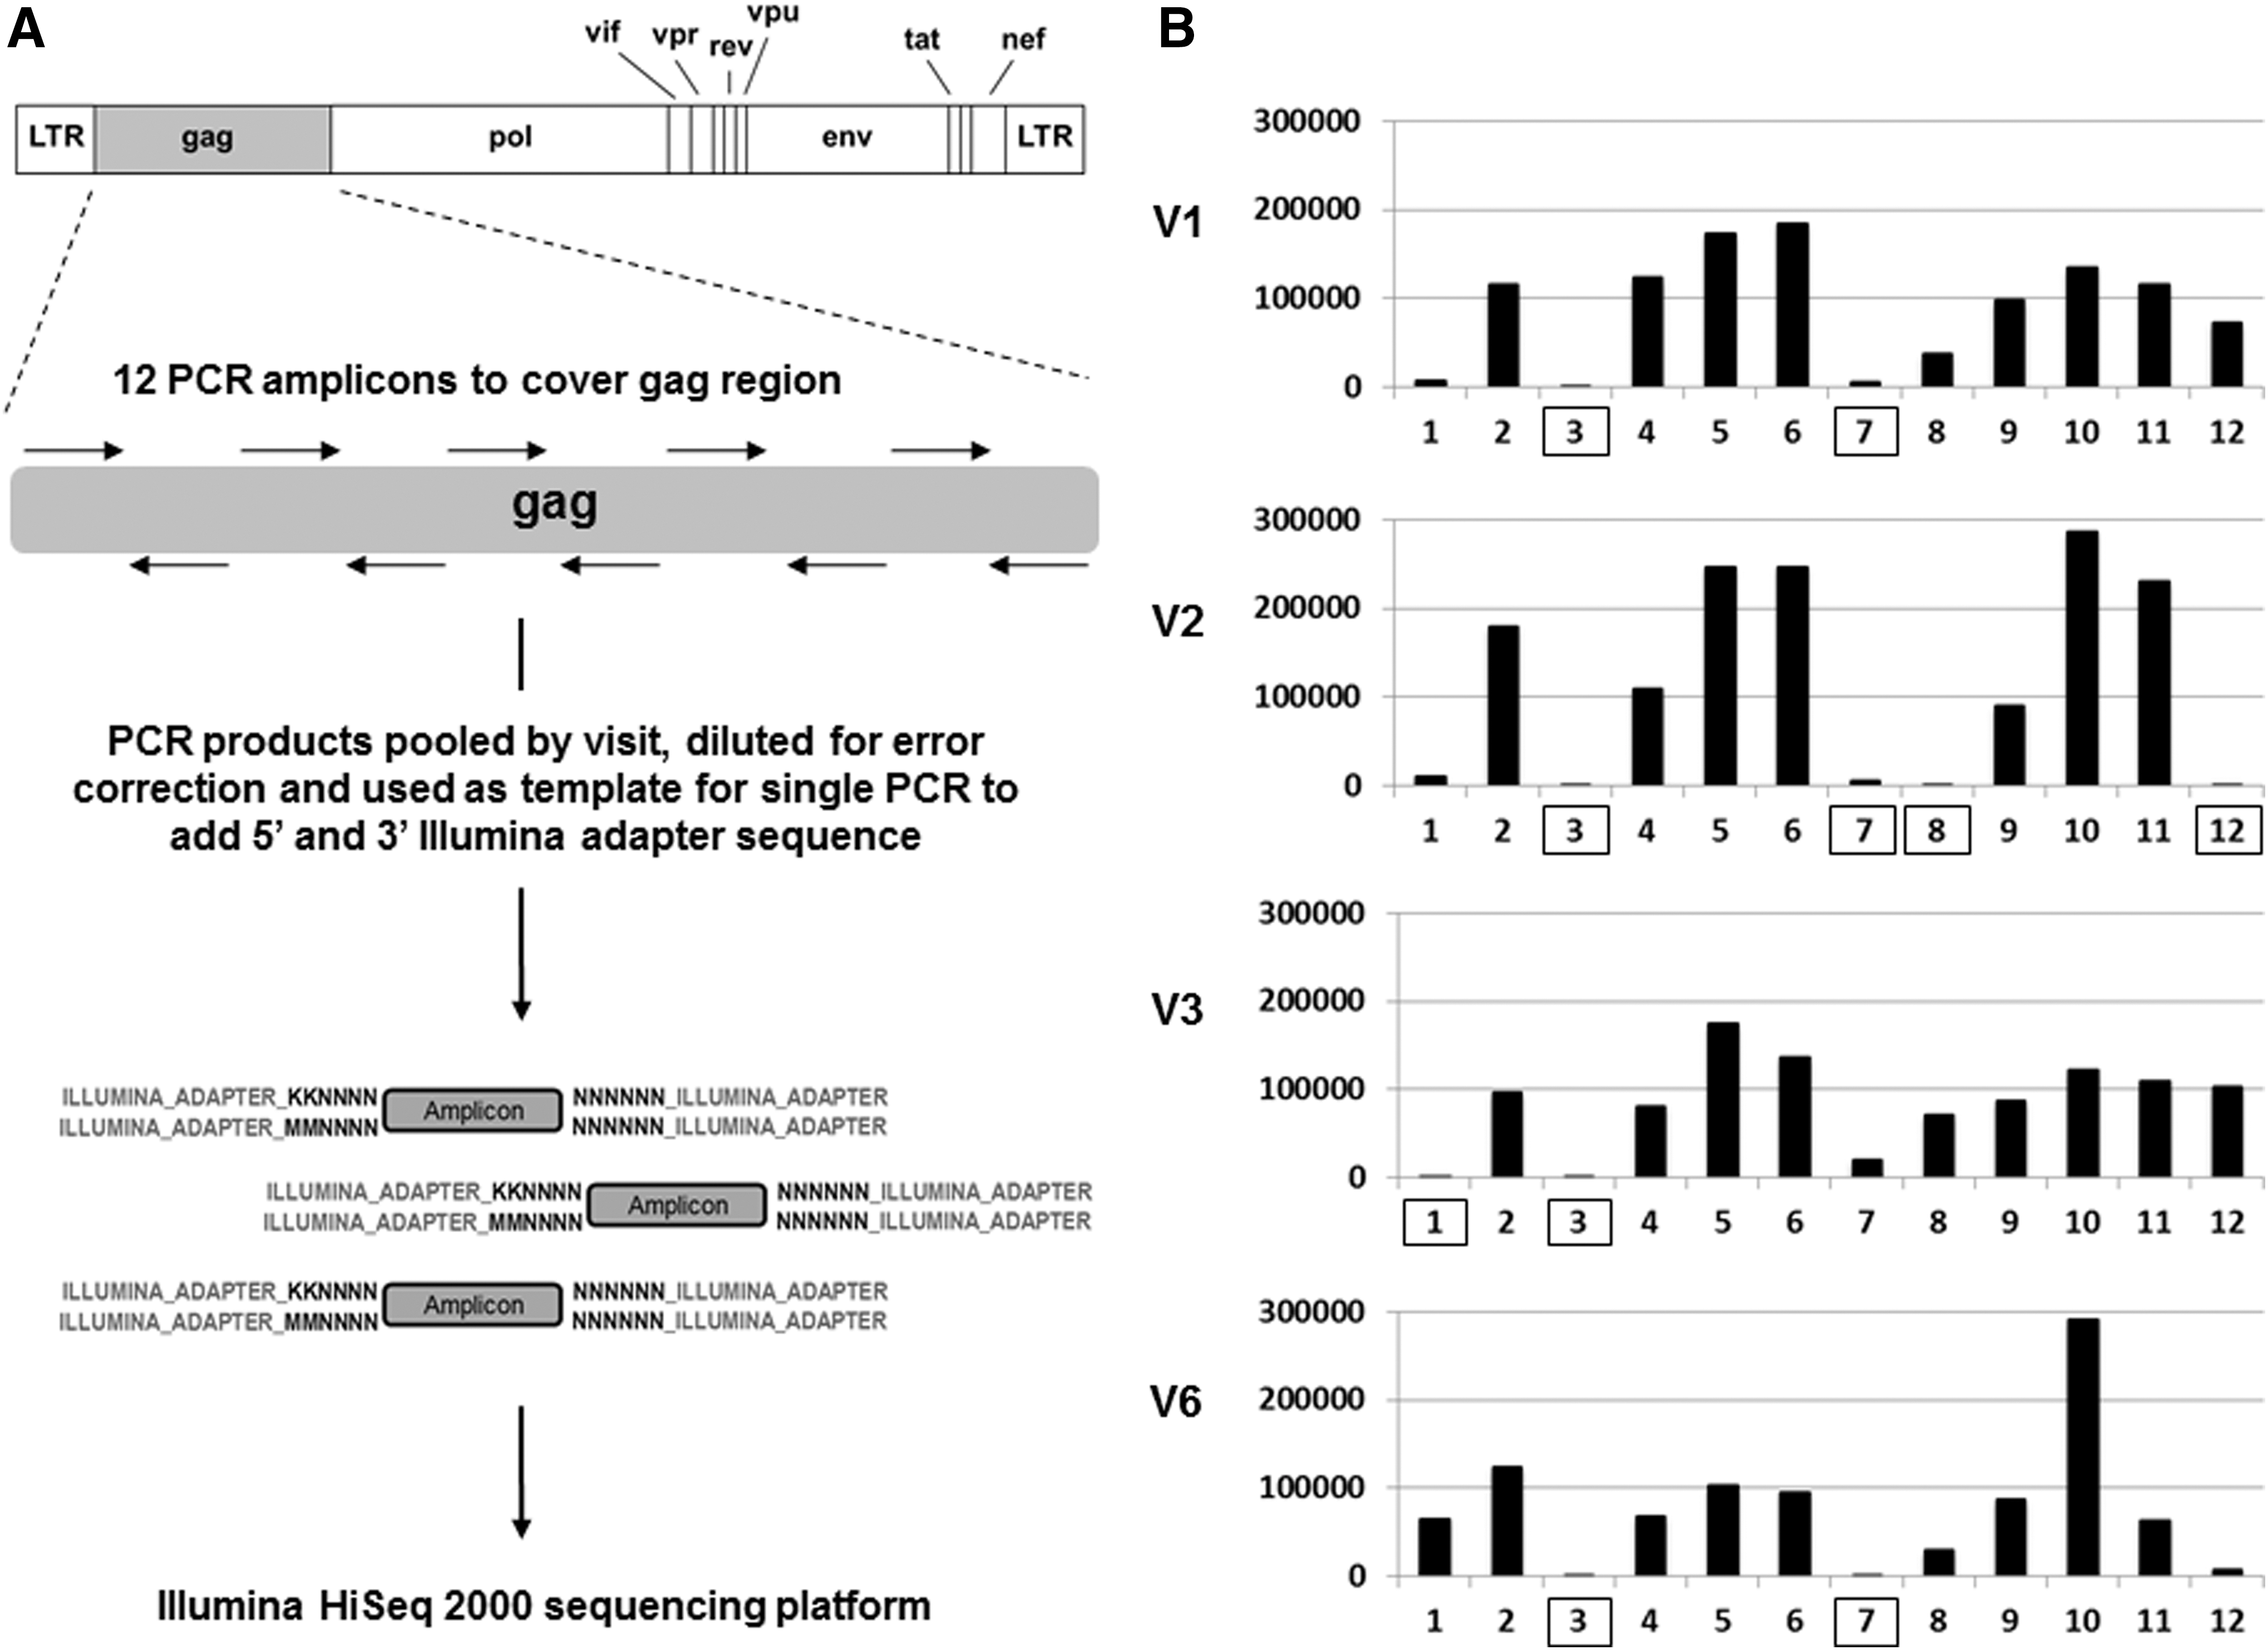
A 1 ml plasma sample from each visit was used to extract HIV-1 RNA, and the total RNA from this volume was used to generate cDNA using Superscript III Reverse Transcriptase (Invitrogen) using random hexamers. Total viral cDNA was then used as a template to amplify 12 short (∼188 nucleotides) staggered polymerase chain reaction (PCR) fragments covering the entire gag. All PCR reactions used high-fidelity KOD DNA polymerase (EMD Millipore). Each primer pair contained 12 randomized bases as a unique nucleotide tag (4,194,304 possible sequences) to identify each distinct HIV-1 sequence, and a constant sequence at each terminus corresponding to a portion of the 5′ and 3′ adapter region specific for the Illumina sequencing platform. PCR products from each visit were electrophoresed on a 3% agarose gel to confirm product amplification; aliquots of each were then pooled by visit and column purified. The final pooled sample was measured for concentration and precisely diluted before being used as a template for a second PCR reaction at subsaturation (∼20 cycles) with a single primer set to add the remaining sequence of the Illumina adapter region. The PCR products were then submitted for 2×100 bp paired-end sequencing using the Illumina HiSeq 2000 machine utilizing 60% of DNA space on a single sequencing lane and totaling ∼108 million reads. The sequencing preparation scheme is shown in Fig. 2A and all primer sequences are provided in Supplementary Table S1 (Supplementary Data are available online at
Deep sequencing.
All Illumina HiSeq 2000 filtered gag sequencing reads were mapped to the reference consensus sequence derived from clonal sequencing of V1 samples. Mapping was performed using the Burrows-Wheeler Alignment tool with 10% of mismatches allowed. 24 Sequencing reads were clustered by unique tag. Clusters containing three or less reads were removed and only mismatches that had an occurrence of >95% within a cluster were considered true mutational variants. These criteria provided a high statistical confidence with a p-value≤10–9 (binomial exact test, p=0.001) for individual mutation calling. Custom Python scripts were used to conflate error-corrected sequences. The sensitivity of our sequencing approach to detect rare variants was ultimately limited by the error rate of reverse transcription at ∼0.0034% (∼1/29,400) at the cDNA generation step of the process. Sensitivity above this threshold is dependent on amplicon coverage and varied by each amplicon and visit sample. Shown in Fig. 2B is a histogram of the amplicon coverage per visit sample, whereas actual amplicon counts, sensitivity, and nucleotide region covered are given in Supplementary Table S2. Amplicons with coverage of <5,000 reads, corresponding to a sensitivity of ≥0.02% (1/5,000), were excluded from analysis (boxed in Fig. 2B). The gag regions representing amplicons 3 and 7 consistently did not meet our coverage cutoff for analysis as PCR product was repeatedly low presumably due to poor annealing of our designed primers. Raw sequencing data were deposited to the NCBI Sequence Read Archive (SRA) under the accession code BioProject PRJNA244693.
Quasispecies Variation
Our high-resolution sequencing approach enabled us to track the fluctuation of extremely rare gag mutations not observed in previous studies within the HIV-1 quasispecies population during the course of acute infection. Shown in Fig. 3A is a heat map depicting the frequencies of individual point mutations with a maximum frequency of >1% across all four time points. A hierarchically clustering analysis was applied to group mutations with a similar frequency trend. We observed two distinct occurrence frequency patterns that were reciprocal. In Pattern 1 mutations had a relatively low occurrence frequency in V1 and V3, but had a relatively high occurrence frequency in V2 and V6. Pattern 2 displayed the reciprocal trend: mutations that had a relatively low occurrence frequency in V2 and V6 showed a relatively high frequency in V1 and V3. This reciprocal fluctuation suggested there are two major subpopulations, one dominating under replication conditions present in V1 and V3, and the other dominating under the conditions present in V2 and V6. This was further supported by a pairwise correlation analysis of the genetic content across all four time points (Fig. 3B). The occurrence frequency correlation of point mutations between V1 and V3 (0.96) was higher than that of V1 and V2 (0.91) and V1 and V6 (0.60). Additionally, the occurrence frequency correlation of point mutations between V6 and V2 (0.68) was higher than that of V6 and V1 (0.60) and V6 and V3 (0.65). Together, this analysis suggests that the gag genetic content was derived from two major HIV-1 subpopulations alternating in replicative dominance during acute infection.
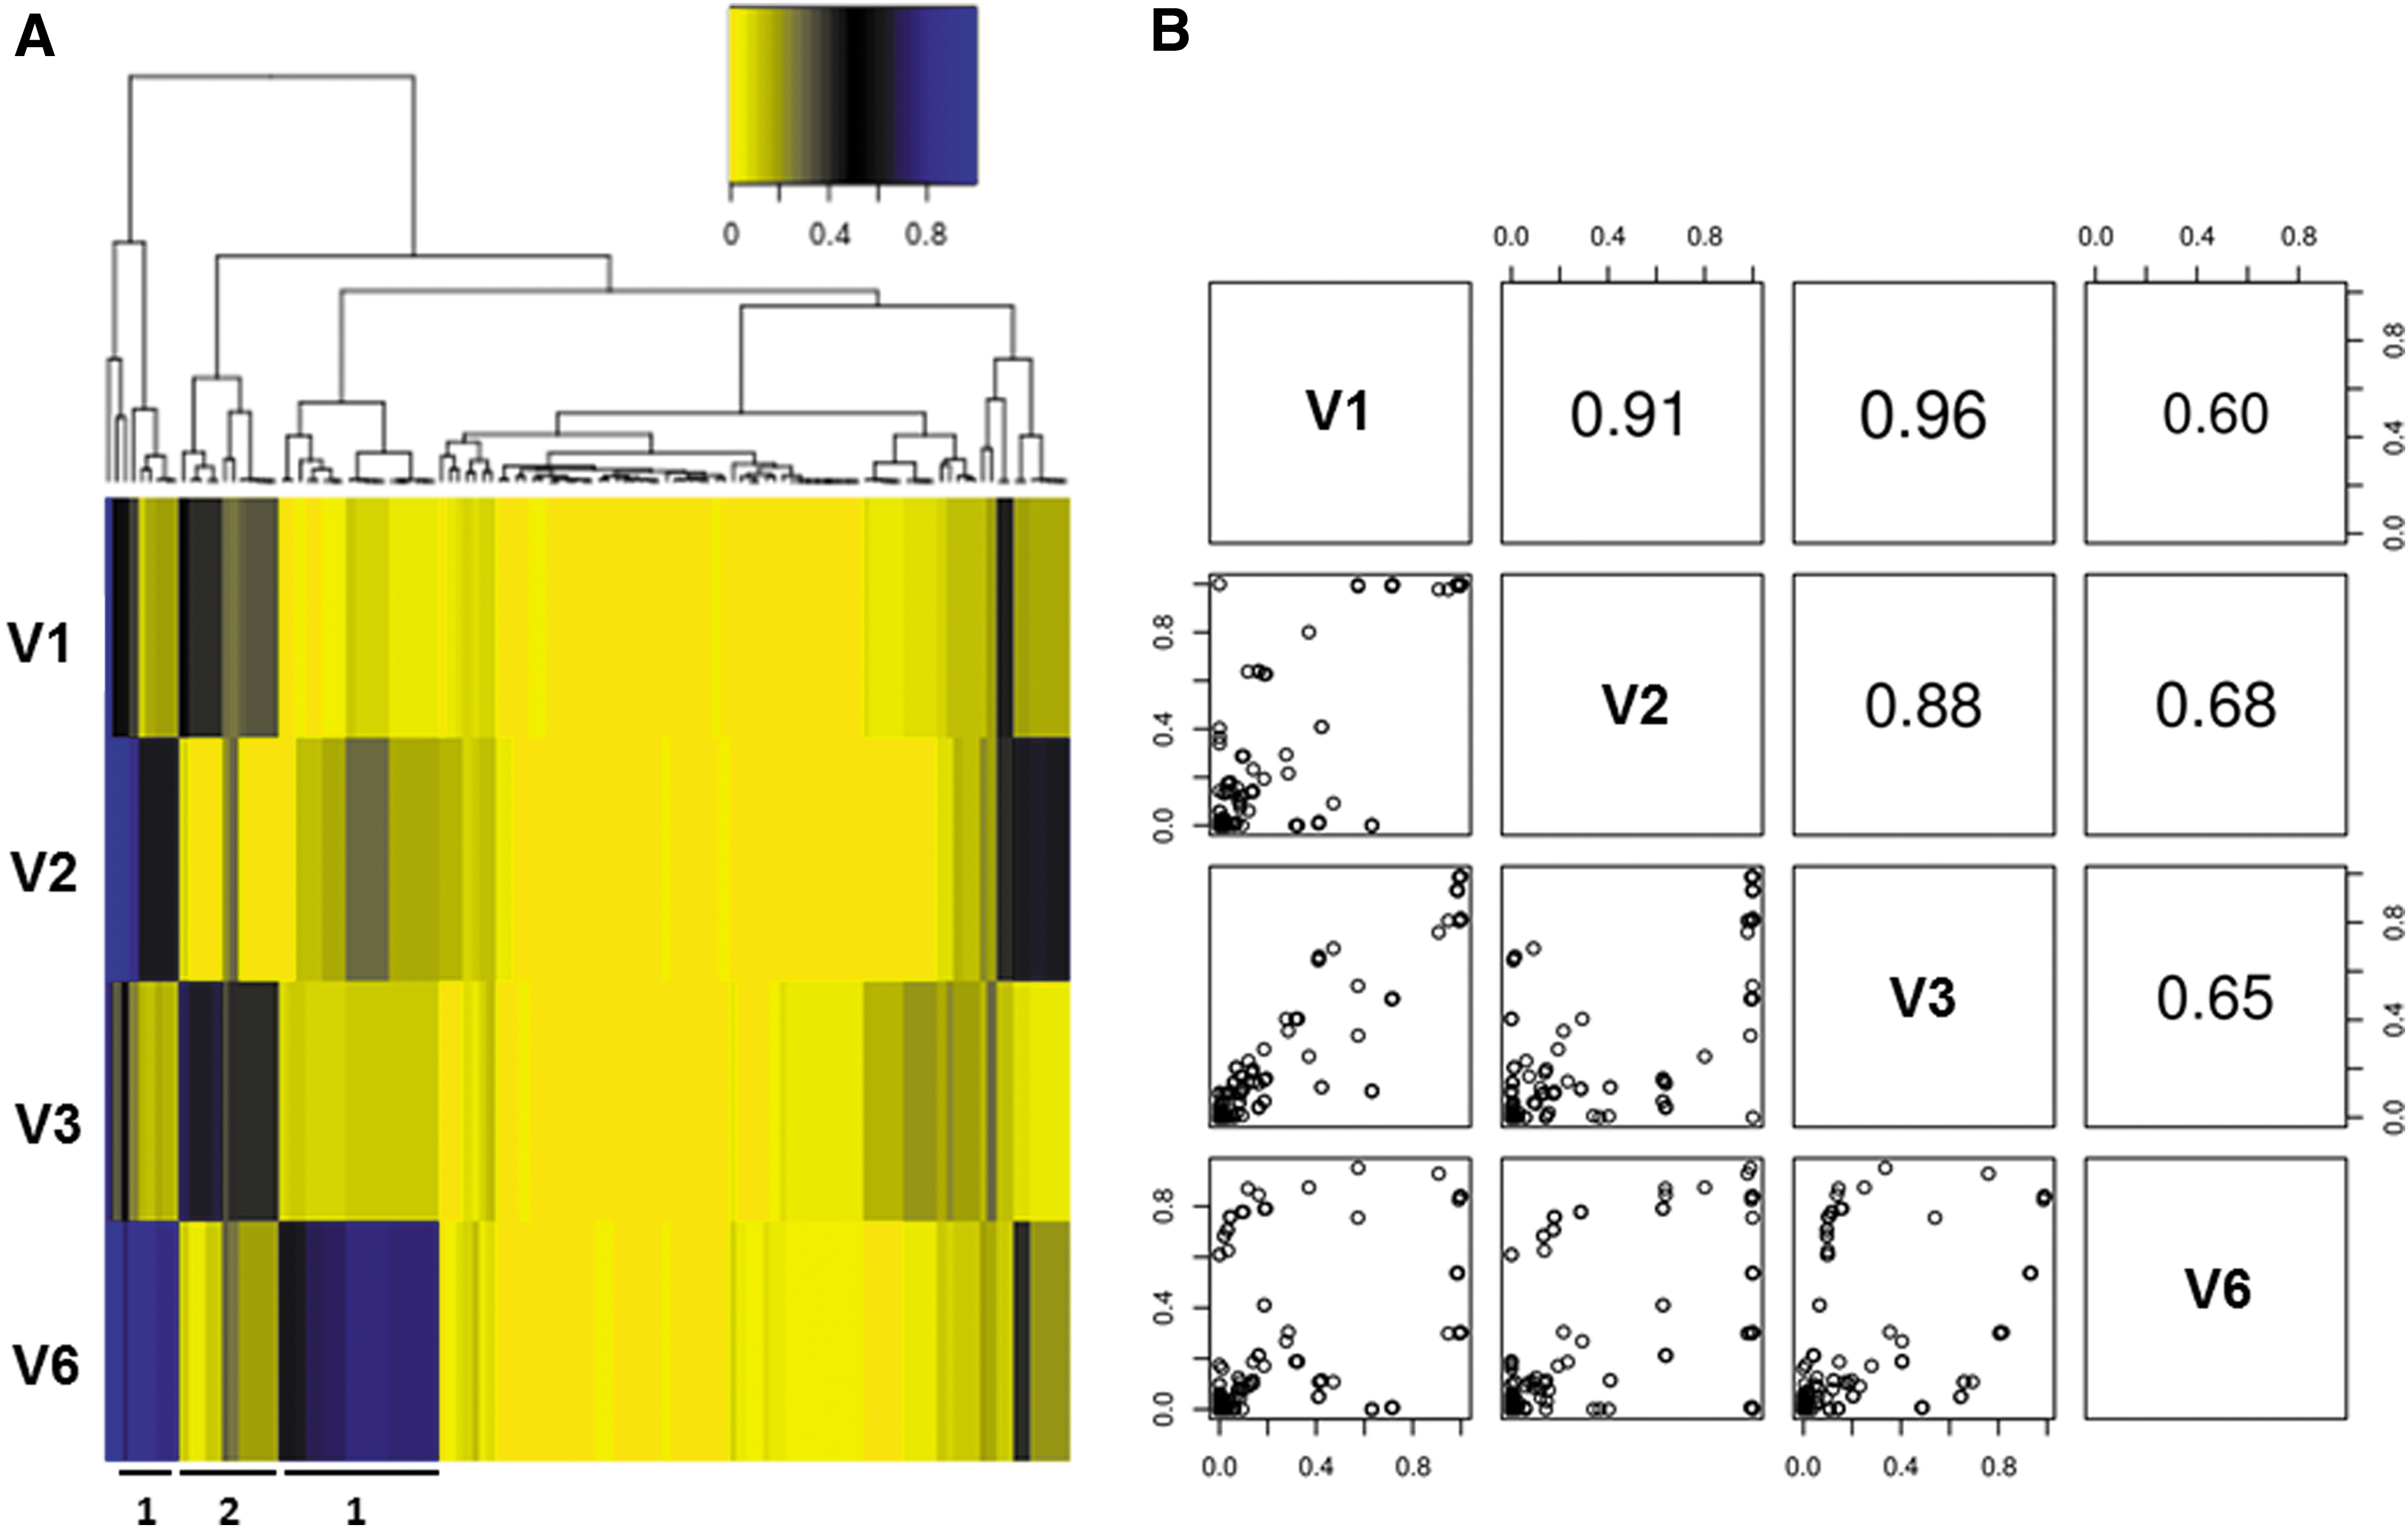
Quasispecies variation analysis shows two reciprocally dominant subpopulations depending on the time point during acute infection.
Sequences of Targeted CD8+ T Lymphocyte Epitope
By standard gamma interferon (IFN-γ) enzyme-linked immunosorbent spot assays (ELISpot) using overlapping 15-mer HIV-1 subtype B consensus sequence peptides (NIH AIDS Research and Reference Reagent Program) as previously described, 25 –27 this individual had a CD8+ T lymphocyte response against Gag residues 117–131 (Fig. 4A). Notably, this peptide contained two previously described overlapping epitopes matched to the HLA type of this subject, AQ9 (AADTGNSSQ) and NP10 (NSSQVSQNYP), Gag 119–127 and 124–133, respectively. In agreement with a prior study of escape mutation in these epitopes during acute HIV-1 infection in a study by Jones et al., 28 there were numerous substitution mutations in these epitopes. At all time points, the N124S variant, described as an escape mutation by Jones et al., was dominant, comprising 85–92% of the total population, suggesting it was the sequence within the founder virus or that it was an early escape variant that reached fixation before V1. The remaining 8–15% of the total population was composed of variants with other substitutions at position 124, including C, G, I, N, and R. Other variants observed by Jones et al. were also observed. S125N, D123E, and H126N (both positions have dominant residues that deviate from the subtype B consensus of G123 and S126) all appeared to fluctuate with viremia levels, observed at 13–14% and 18% at V1–V2, peaking at 18% and 28% in V3, and dropping to 10% and 17% in V6 for D123E and S125N, and H126N, respectively.
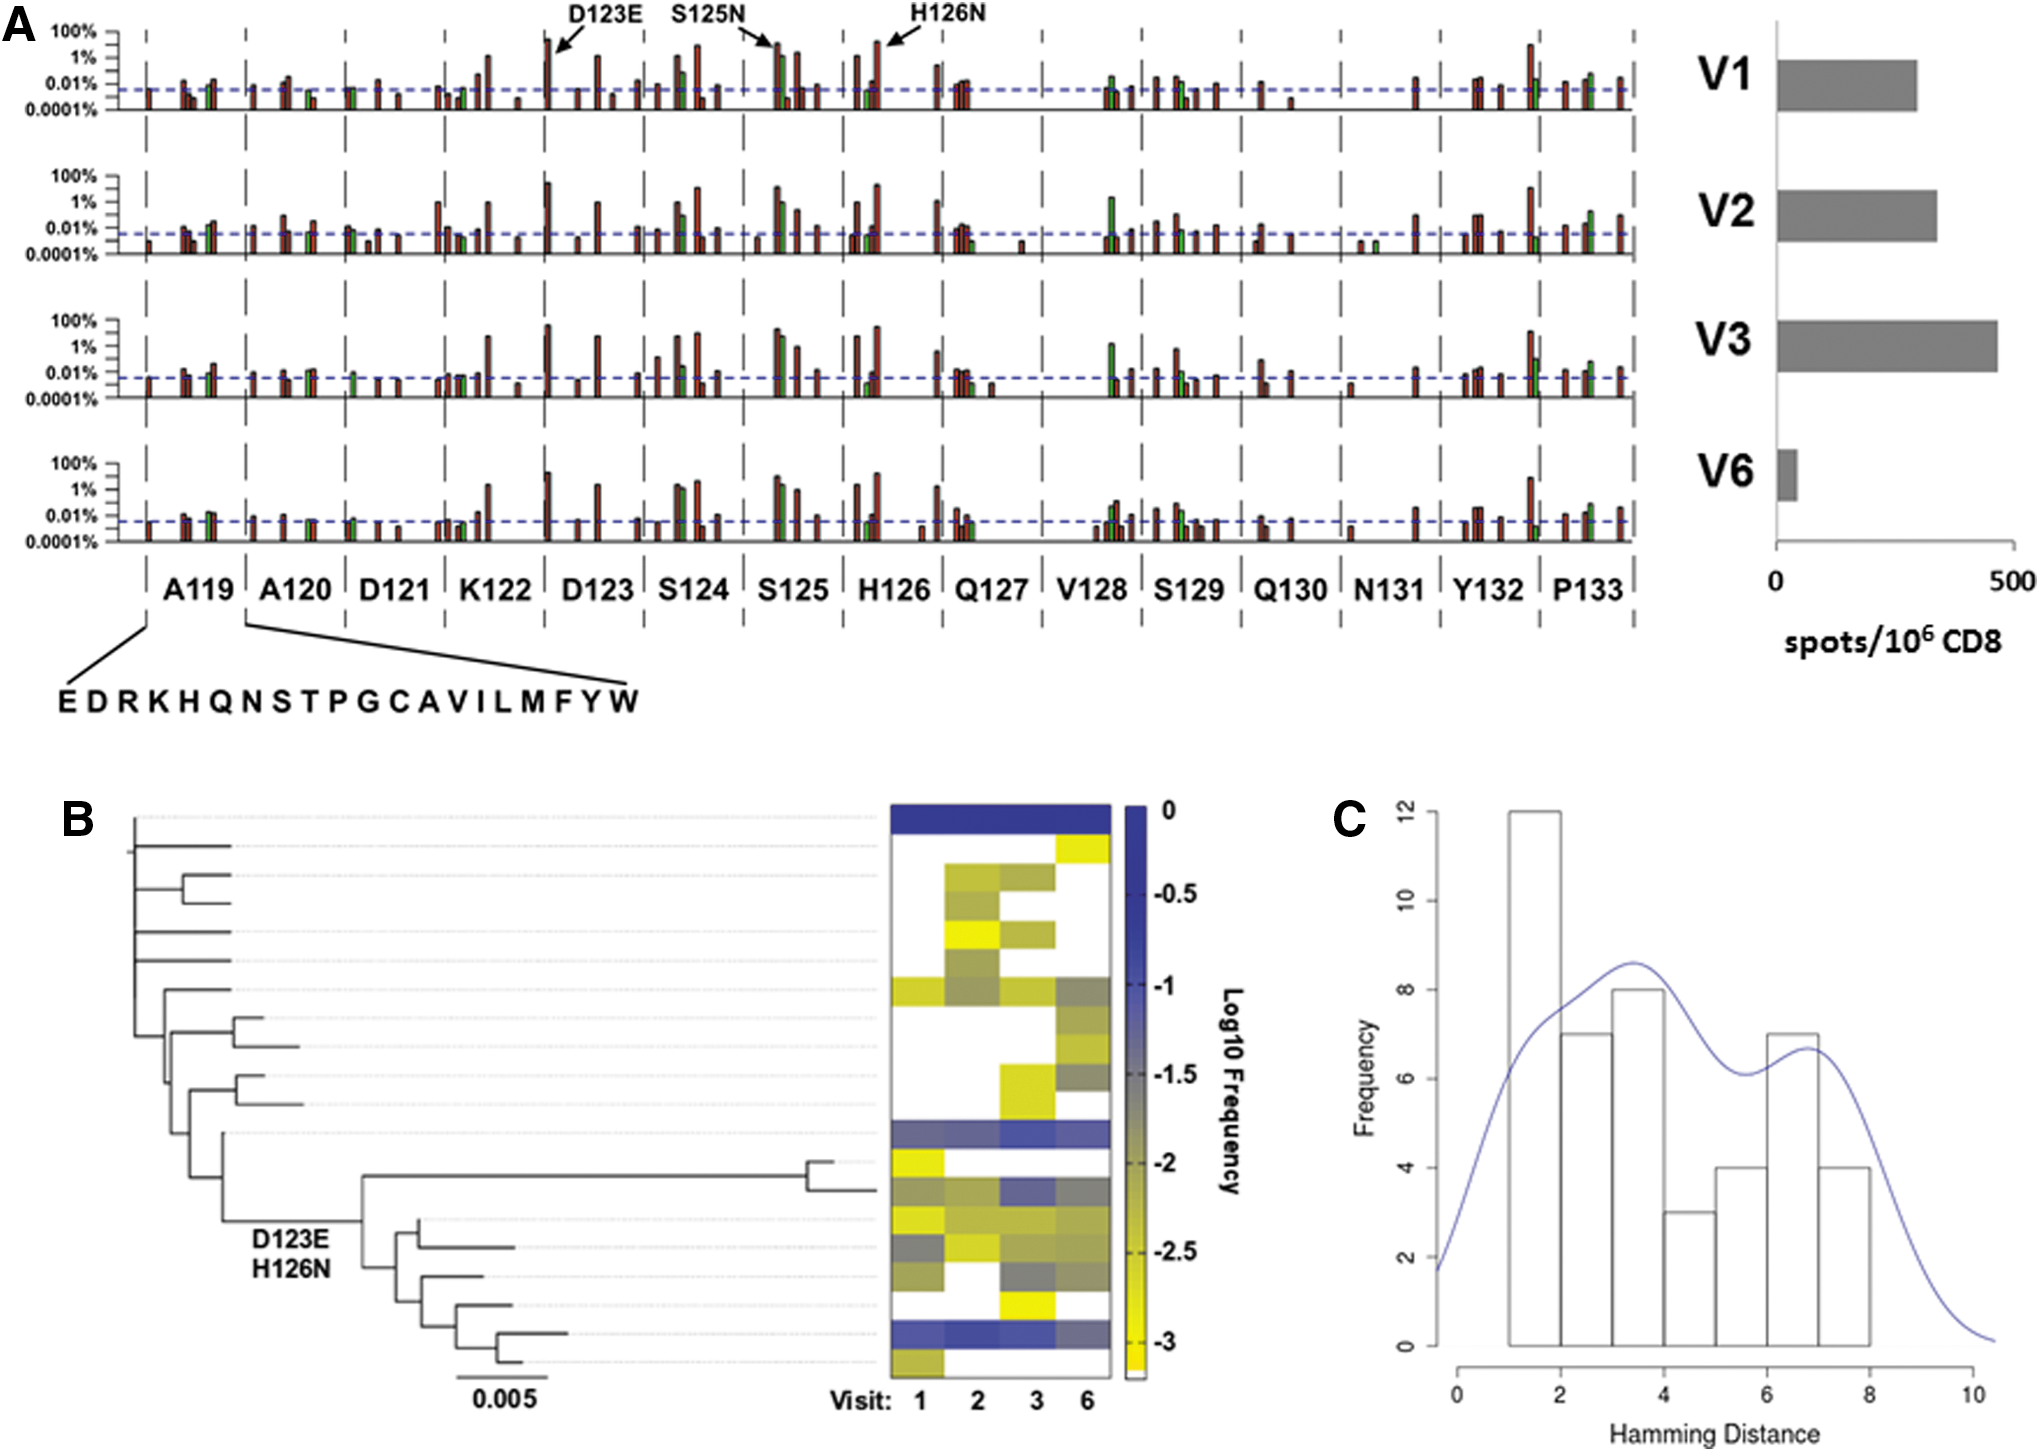
AQ9/NP10 epitope focus reveals active CTL selection and insight into population-level genetic dynamics.
The frequency change of mutation group D123E, S125N, and H126N showed statistical significance using a paired t-test from V2–V3 and V3–V6, with p=0.04897 and 0.009519, respectively, but no statistical significance for the frequency change from V1–V2 (p=0.2258). Rare variants included A119E/T, D121G, S125G, Q127K, and V128A, which were present as minor species (each at ≤2.5% of the total population) throughout acute infection. The entire Gag amino acid substitution profile from 119 to 133 for each visit is shown in Fig. 4A. These data suggested ongoing CD8+ T lymphocyte-mediated selective pressure maintaining significant subpopulations within the total quasispecies patient pool.
As AQ9/NP10 is contained within a single amplicon (#4), this permitted interrogation of its haplotype linkage. A neighbor-joining tree was constructed using all 20 haplotypes that had a maximum occurrence frequency of >0.1% (Fig. 4B). The 20 haplotypes formed two distinct clusters on the phylogenetic tree, which could be distinguished by the two key variants, D123E and H126N. Viral subpopulations that carried D123E and H126N represented a minor fraction of the entire population, with an accumulating occurrence frequency of 13.5% in V1, 13.6% in V2, 18.1% in V3, and 10.0% in V6. We also examined the frequency distribution of all pairwise Hamming distances for the haplotypes detected in V1 (Fig. 4C), an analysis that provides insight into the origination of distinct viral subpopulations. 10 This revealed a bimodal distribution, which does not conform to the Poisson distribution model predicted of a single ancestral virus. Together, our results suggest that two or more founder viruses were required to generate the distinct phylogenetic viral clusters observed, or a minor subpopulation was derived from a single founder virus by acquiring two substitutions, D123E and H126N, prior to V1 sample collection during the very early phases of acute infection.
Here we utilized a high-resolution deep sequencing approach targeting HIV-1 gag to uncover aspects of viral genetic dynamics and diversification during acute infection. Multiple studies have applied the 454 next-generation pyrosequencing approach to investigate viral dynamics and immune escape during HIV-1 acute infection, 9,20,29 highlighting the importance of minor variants to early immune pressure and dramatic subpopulation shifts also observed here using the Illumina platform. The 454 pyrosequencing approach affords longer sequence reads, but has a higher error rate with lower sequence depth and sensitivity to detect rare variants versus Illumina. 30 The shorter sequence reads from Illumina make haplotype reconstruction a major challenge—an issue we have recently overcome. 31 In conclusion, our data suggested very early immune pressure with two quasispecies subpopulations reciprocally shifting in dominance. This deep sequencing approach can be applied to reveal insights about viral adaption to immune or drug pressure, including other viruses that exist as quasispecies swarms in vivo.
Footnotes
Acknowledgments
We thank our study subject for their participation. This work was supported by NIH R01 AI043203 (O.O.Y.), the UCLA Center for AIDS Research (CFAR) NIH/NIAID AI028697 (O.O.Y. and R.S.), NIH R21 AI110261 (R.S.), UCLA Jonsson Comprehensive Cancer Center (JCCC) NIH/NCA P30 CA016042 (R.S.), and the California HIV/AIDS Research Program (CHRP) Innovative, Development, Exploratory Award (IDEA) (R.S.).
Author Disclosure Statement
No competing financial interests exist.
References
Supplementary Material
Please find the following supplemental material available below.
For Open Access articles published under a Creative Commons License, all supplemental material carries the same license as the article it is associated with.
For non-Open Access articles published, all supplemental material carries a non-exclusive license, and permission requests for re-use of supplemental material or any part of supplemental material shall be sent directly to the copyright owner as specified in the copyright notice associated with the article.