
Abstract
Laboratory assays for determining recent HIV-1 infection are of great public health importance for aiding in the estimation of HIV incidence. Concerns have been raised about the potential for misclassification with serology-based assays due to fluctuations in the antibody response, particularly following progression to AIDS. We characterized longitudinal antibody responses to HIV using a cohort of men who have sex with men (MSM) sampled for up to 17 years, in which 57% of the 65 study subjects included in the current analyses progressed to AIDS during the study period. Envelope-specific total IgG antibody levels, avidity, and p24-specific IgG3 levels were evaluated using a multiplexed Bio-Plex assay. For the majority of the analytes, no significant difference in IgG reactivity was observed between AIDS and non-AIDS specimens. Although a slight decline in gp120 reactivity was noted with decreasing CD4+ T cell count, the drop in assay values was relatively minimal and would likely not lead to an increase in the misclassification rate of the assay. A peak in HIV-1 p24 IgG3 levels was observed during early infection, as confirmed by testing 1,216 specimens from 342 recent seroconverters with the Bio-Plex assay. As expected, IgG3 reactivity declined with disease progression and decreasing CD4+ T cell count in the MSM cohort; however, 37% of the study subjects exhibited relatively high IgG3 levels late in the course of infection.
Introduction
HIV-1
Since Janssen et al. first described the use of a modified enzyme immunoassay (EIA) for the detection of recent HIV infection 6 ; several serology-based approaches have been evaluated. Current assay approaches include the measurement of total HIV-specific IgG levels in plasma or IgG binding in the presence of a dissociative agent, as a measure of avidity. 4,7,8,10,12,15 IgG1 makes up the majority of total IgG directed against HIV. 1,16,17 An alternative approach, first described by Wilson et al. 18 relies on differential reactivity of IgG3 during recent and chronic infection. IgG3, the second most predominant IgG subclass involved in the antibody response to HIV, 19 differs from IgG1 in that levels peak early postinfection, followed by a decline to low or undetectable levels. 18,20 Several studies have indicated that HIV-specific IgG3 is infrequently seen in chronic infection, 16,17 21 suggesting the potential for a reliable marker of early infection.
Previously, we described the development of an HIV-1 multiplex assay for determining recent infection, based on the Bio-Plex platform (Bio-Rad Laboratories, Hercules, CA). 12 The multiplex approach is advantageous since it allows for the measurement of up to 100 analytes (Bio-Plex 200 system) in a single sample, using minimal sample volume. Recent studies have supported the use of a recent infection testing algorithm (RITA) or multiassay algorithm (MAA) for incidence estimation given that algorithms based on multiple tests for recent infection (TRIs), in conjunction with clinical data, have shown improved performance and reduced false-recent rates as compared to each individual test. 15,22 –24 Similarly, improved HIV incidence estimates using multianalyte algorithms have been demonstrated based on three or more HIV-1 Bio-Plex assay measures. 25
The performance of most TRIs has been shown to be affected by antiretroviral therapy (ART) and progression to AIDS, leading to increased misclassification rates. 5,7,26 –28 The impact of the evolving antibody response to HIV on TRIs is difficult to assess given that longitudinal cohorts consisting of samples collected greater than 1–2 years postinfection are not readily available due to cost, patient compliance, and the decreasing pool of long-term, drug-naive HIV-infected individuals in the United States. In the absence of confounding factors such as early-initiated drug therapy and subtype diversity, we evaluated the robustness of the HIV-1 Bio-Plex assay by characterizing the longitudinal antibody response to HIV-1 using a cohort of patients, sampled for up to 17 years post-initial sample collection. HIV-1 envelope (Env)-specific IgG levels and avidity were evaluated, along with p24-specific IgG3 responses. Immune perturbations, as a result of disease progression, were determined by evaluating possible correlations between antibody reactivity and CD4+ T cell counts. Additionally, longitudinal specimens from recent seroconverters were evaluated to characterize the peak in IgG3 reactivity during early infection and to estimate a cutoff for recent/long-term infection for further evaluation of the men who have sex with men (MSM) cohort.
Materials and Methods
Long-term longitudinal MSM cohort
Longitudinal plasma specimens were obtained from a prospective study involving subtype B HIV-1 infected MSM diagnosed with unexplained, generalized lymphadenopathy syndrome. 29 –31 Study participants were enrolled between 1982 and 1983 in Atlanta, Georgia and monitored at 3- to 6-month intervals for clinical and immunological evaluation of progression to AIDS, including CD4+ T cell count determination. HIV-1 antibody positivity was confirmed for all study participants when serologic testing became routinely available. In the present study, 784 plasma specimens from 65 subjects were tested by the HIV-1 Bio-Plex assay. Thirty-seven (57%) of the study subjects progressed to AIDS during the study period, as defined by a CD4+ T cell count <200 cells/μl. Since seroconversion dates are unknown for these subjects, samples were excluded from statistical analyses if collected <1 year from study entry or initial sample collection. A total of 111 samples were excluded based on these criteria. Eight additional samples were excluded based on lack of available CD4+ T cell counts. Therefore, a total of 665 specimens (65 subjects) were further analyzed for correlation and statistical tests.
Seroconversion specimens
To establish a baseline of IgG3 reactivity and to estimate a cutoff for recent/long-term infection for the Bio-Plex assay, 1,216 plasma samples from 342 subjects with known last negative and first positive HIV antibody test dates were obtained from various sources: 12 subtype B HIV-1 seroconversion panels, consisting of 60 samples, were obtained commercially (Zeptometrix Corp., Buffalo, NY); 352 samples from 105 subtype B′/E seroconverters were from a phase I/II trial carried out in Thailand, involving the AIDSVAX B/E (VAX003) candidate vaccine 32 ; 206 samples from 43 subtype B seroconverters were from a phase III trial carried out in North America and the Netherlands, involving the AIDSVAX B/B (VAX004) candidate vaccine 33,34 ; 393 samples from 93 subtype B seroconverters were obtained from the HIV Network for Prevention Trials (HIVNET) Vaccine Preparedness Study (VPS), which recruited high-risk MSM, injection drug users (IDU), and heterosexual women from eight U.S. cities (Boston, Chicago, Denver, New York, Philadelphia, Providence, San Francisco, and Seattle) 35,36 ; and 205 samples from 89 subtype G/AG seroconverters and long-term individuals were obtained from the Recruiting Acute Cases of HIV (REACH) study conducted in Nigeria in collaboration with the Nigerian Federal Ministry of Health. 37 All testing in this study was determined not to be human subjects research by the Centers for Disease Control and Prevention.
HIV-1-specific microspheres
The HIV-1-specific microsphere panel was created as previously described. 12,25,38 Briefly, HIV-1 subtype B recombinant proteins, p24, gp120, gp160, and gp41, were obtained commercially from Immunodiagnostics, Inc. (Woburn, MA). All proteins were reported to have a purity >95%. Recombinant proteins were conjugated to magnetic Bio-Plex COOH microspheres (Bio-Rad Laboratories, Hercules, CA) using a Bio-Plex Amine coupling kit (Bio-Rad Laboratories) according to the kit protocol. Each coupling reaction contained 1.25×10⁶ microspheres and 10 μg of recombinant protein or control protein. For sample addition and nonspecific binding controls, coupling reactions were also performed using goat antihuman IgG (Invitrogen, Carlsbad, CA) and bovine serum albumin (BSA) (Sigma-Aldrich, St. Louis, MO), respectively.
HIV-1 Bio-Plex assay
Antibody reactivity to HIV-1 envelope was measured, as IgG antibodies directed against gp120, gp160, and gp41 provide the greatest distinction between recent and long-term specimens when evaluated using the Bio-Plex format. 12,25 The HIV-1-specific Bio-Plex assay was performed as previously described. 12 To control for run-to-run variation, a normalized mean fluorescent intensity (MFI) value (n) was calculated for each sample, along with avidity index (a), as described. 12 Briefly, the MFI values of the test samples were normalized relative to the MFI of the assay calibrator.
For IgG3 detection, 2 μg/ ml phycoerythrin (PE)-labeled, mouse antihuman IgG3 (SouthernBiotech, Birmingham, AL) was used as the detection antibody. Anti-p24-specific antibody levels were measured since the IgG3 antibody response to HIV-1 is directed primarily against gag-derived proteins. 18,19 Avidity indexes were not considered for p24 IgG3 since these antibodies typically exhibit low or no avidity (data not shown). For the purposes of the current study, a recent/long-term cutoff of 0.2 (normalized MFI value) was selected based on visual distinction in reactivity between the peak of the response (0–50 days postseroconversion) versus the decline or plateau phase (>200 days postseroconversion), observed in longitudinal seroconverters. Antibody subclasses IgG2 and IgG4 were not evaluated here, because reactivity has been found to be relatively low and inconsistent during HIV infection, providing little discriminatory value for assays to detect recent infection. 1,19
Statistical analyses
The relationship between HIV-specific IgG or IgG3 antibody reactivity and CD4+ T cell count was determined using Spearman's rank correlation coefficient. Differences in antibody reactivity between samples with CD4+ T cell counts >200 cells/μl versus <200 cells/μl were determined using the Wilcoxon rank sum test.
Results
HIV-1 Env-specific antibody response
Figure 1 illustrates antibody reactivity of the MSM cohort from the time of study entry until sample collection ceased, due to patient withdrawal or mortality. Total follow-up time for the study population ranged from 572 to 6,439 days (median=2,484.5 days). For all antibodies evaluated, antibody levels (Fig. 1A) and avidity (Fig. 1B) remained relatively stable throughout the course of the study.

HIV-specific total IgG antibody levels
To determine the relationship between antibody reactivity and disease progression, Env-specific antibody levels and avidity indexes were compared to CD4+ T cell counts for each sample. Overall, CD4+ T cell counts declined steadily over the study period, with a notable increase in the rate of decline approximately 5–6 years post-initial sample collection (Fig. 1). No correlation was found between CD4+ T cell count and gp160-n, gp120-a, gp160-a, and gp41-a antibody responses (p>0.05; Table 1). A significant correlation was found for gp41-n and CD4+ T cell count (p=0.005); however, these data demonstrated an inverse correlation or an increase in gp41 antibody levels with a decline in CD4+ T cell count. A significant positive correlation of 0.103 (r) was found for gp120-n (p=0.008) and CD4+ T cell count, demonstrating a decrease in gp120-n levels with decreasing CD4+ T cell counts.
Indicates statistical significance (Spearman's rank correlation coefficient).
Fluctuations in antibody reactivity with progression to AIDS were further examined by comparing antibody levels and avidity indexes of samples collected when CD4+ T cell counts were >200 cells/μl versus <200 cells/μl (Table 2). A significant difference between groups was found for gp120-n (p<0.001) and gp120-a (p=0.050). The median normalized value for gp120 was 12.6 for non-AIDS samples, as defined by CD4+ T cell count, versus 10.9 for AIDS samples. The median avidity index for gp120 was 50.0% for non-AIDS samples versus 47.9% for AIDS samples.
Indicates statistical significance (Wilcoxin rank sum test).
Median antibody reactivity (25%, 75% quartiles).
Comparison of median antibody reactivity between specimens with CD4+ T cells counts ≥200 cells/μl vs. <200 cells/ μl.
IgG3 p24 antibody levels
IgG3 anti-p24 levels from longitudinal seroconverter samples were evaluated in relation to days since estimated seroconversion (Fig. 2). Anti-p24 antibody levels peaked within 50 days postseroconversion, followed by a decline to low or undetectable levels at >200 days postseroconversion.
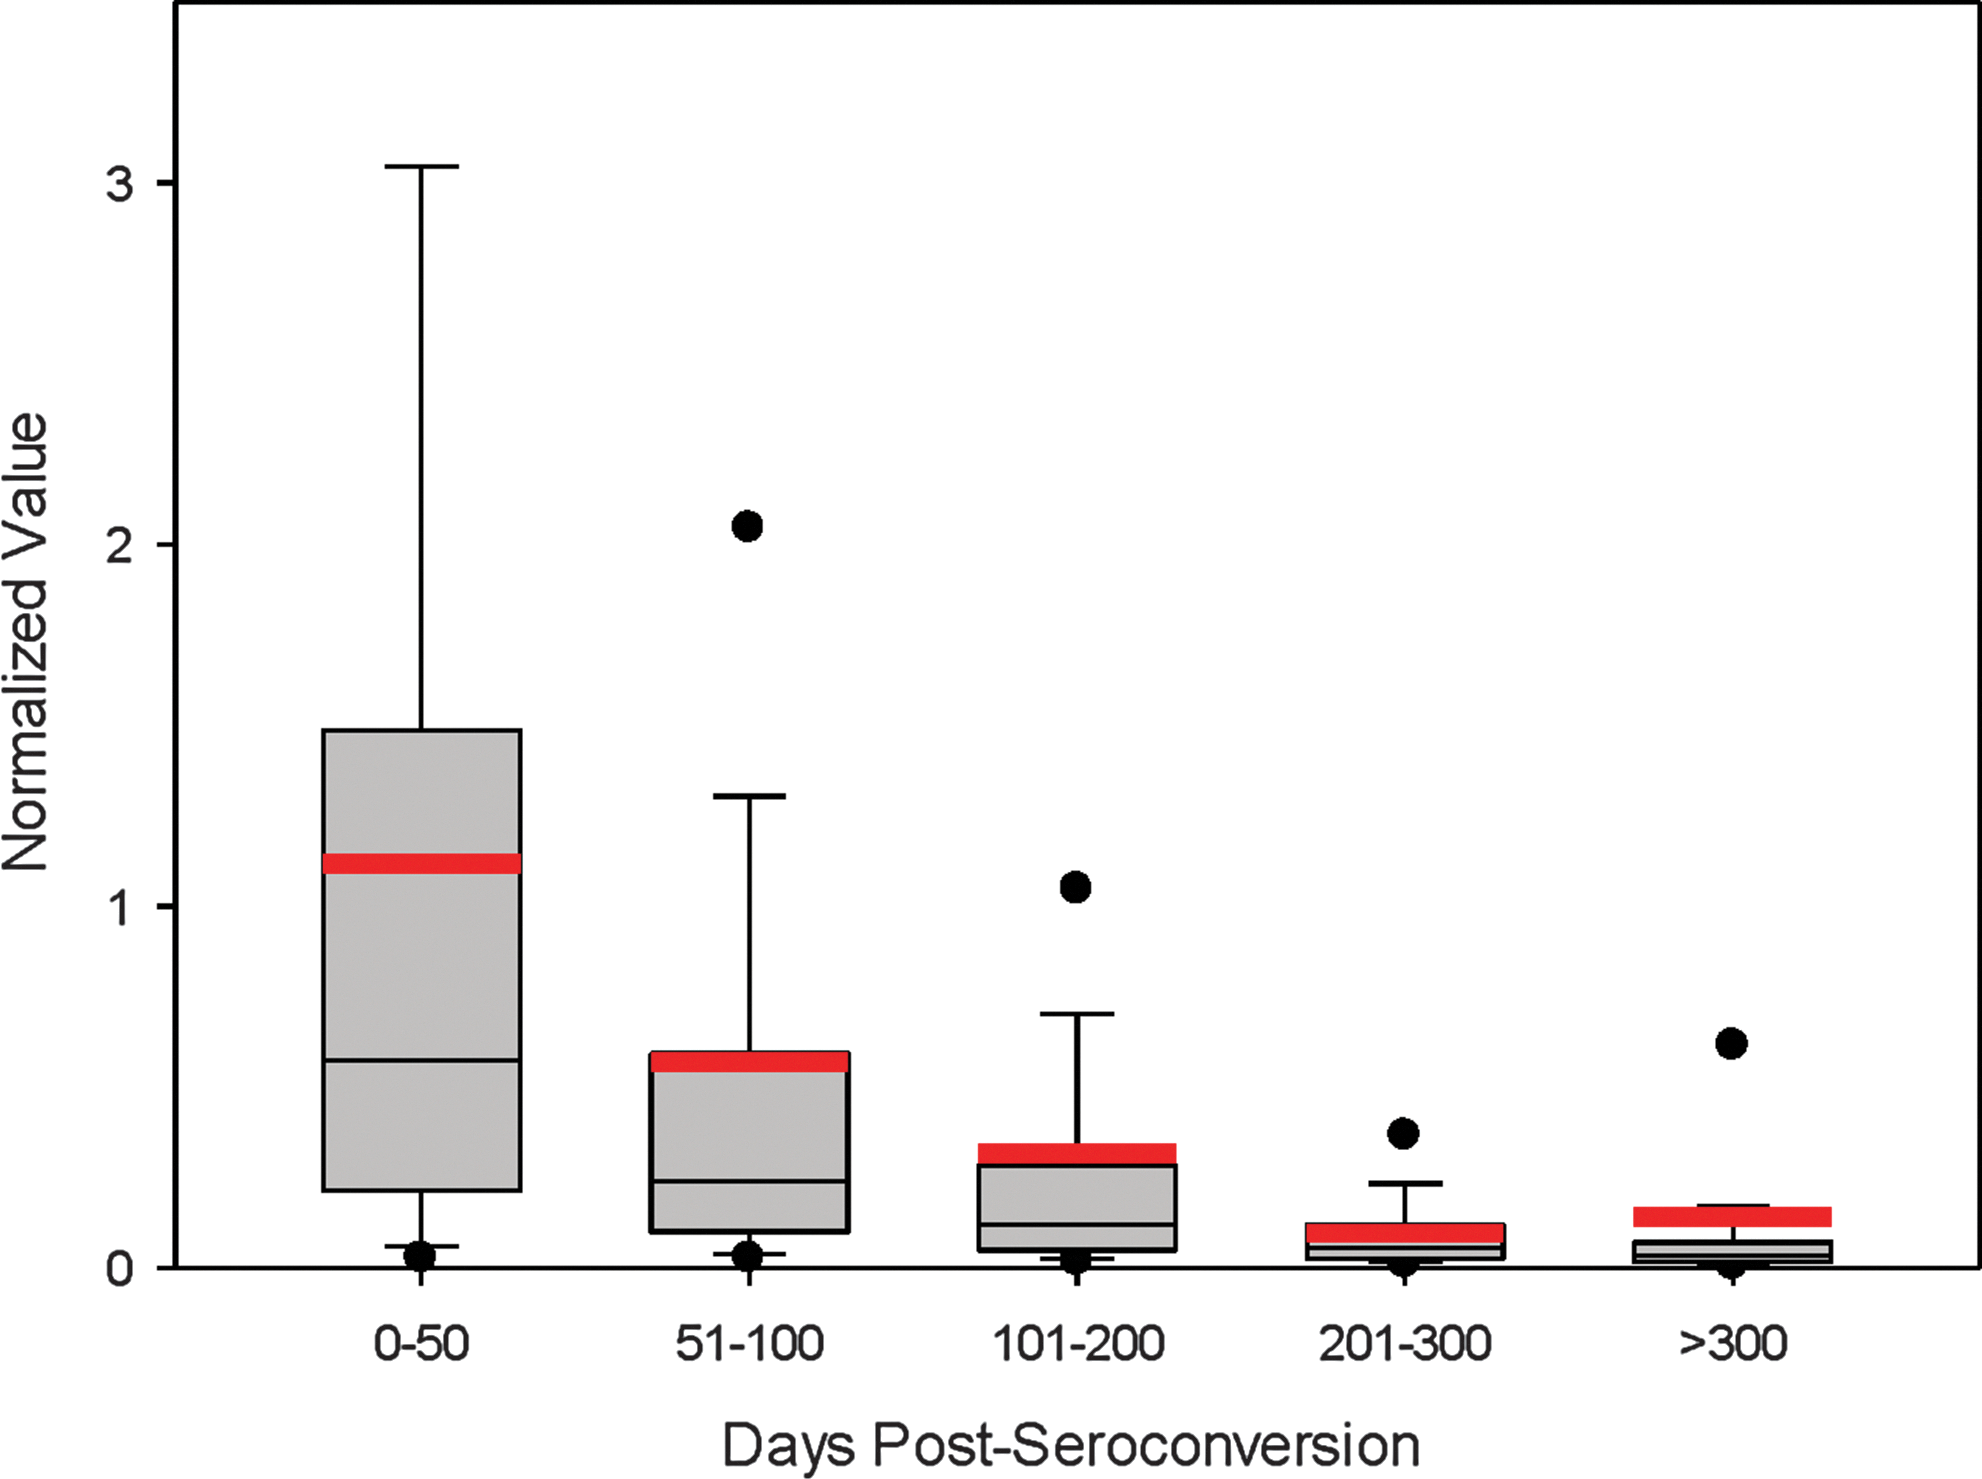
p24-specific IgG3 reactivity in longitudinal panels from recent seroconverters. The box plots represent the 25–75% percentile of reactivity for each category. Normalized IgG3 anti-p24 MFI values are categorized based on estimated days since seroconversion. Red lines represent the average normalized value for each category.
For the MSM cohort with long-term follow-up, IgG3 responses were evaluated in relation to CD4+ T cell counts to determine the correlation with disease progression (Fig. 3). A significant positive correlation of 0.163 (r) was found, indicating a decrease in IgG3 levels with a decline in CD4 + T cell count (p<0.001; Table 1). Although high levels of IgG3 reactivity were observed, the overall trend of reactivity was a decline in antibody response as CD4+ T cell counts decreased. Furthermore, a significant difference was found in IgG3 levels between samples with CD4+ T cell counts >200 cells/μl versus <200 cells/μl (p<0.001; Table 2). The median normalized value for p24 IgG3 was 0.06 for non-AIDS samples versus 0.03 for AIDS samples.
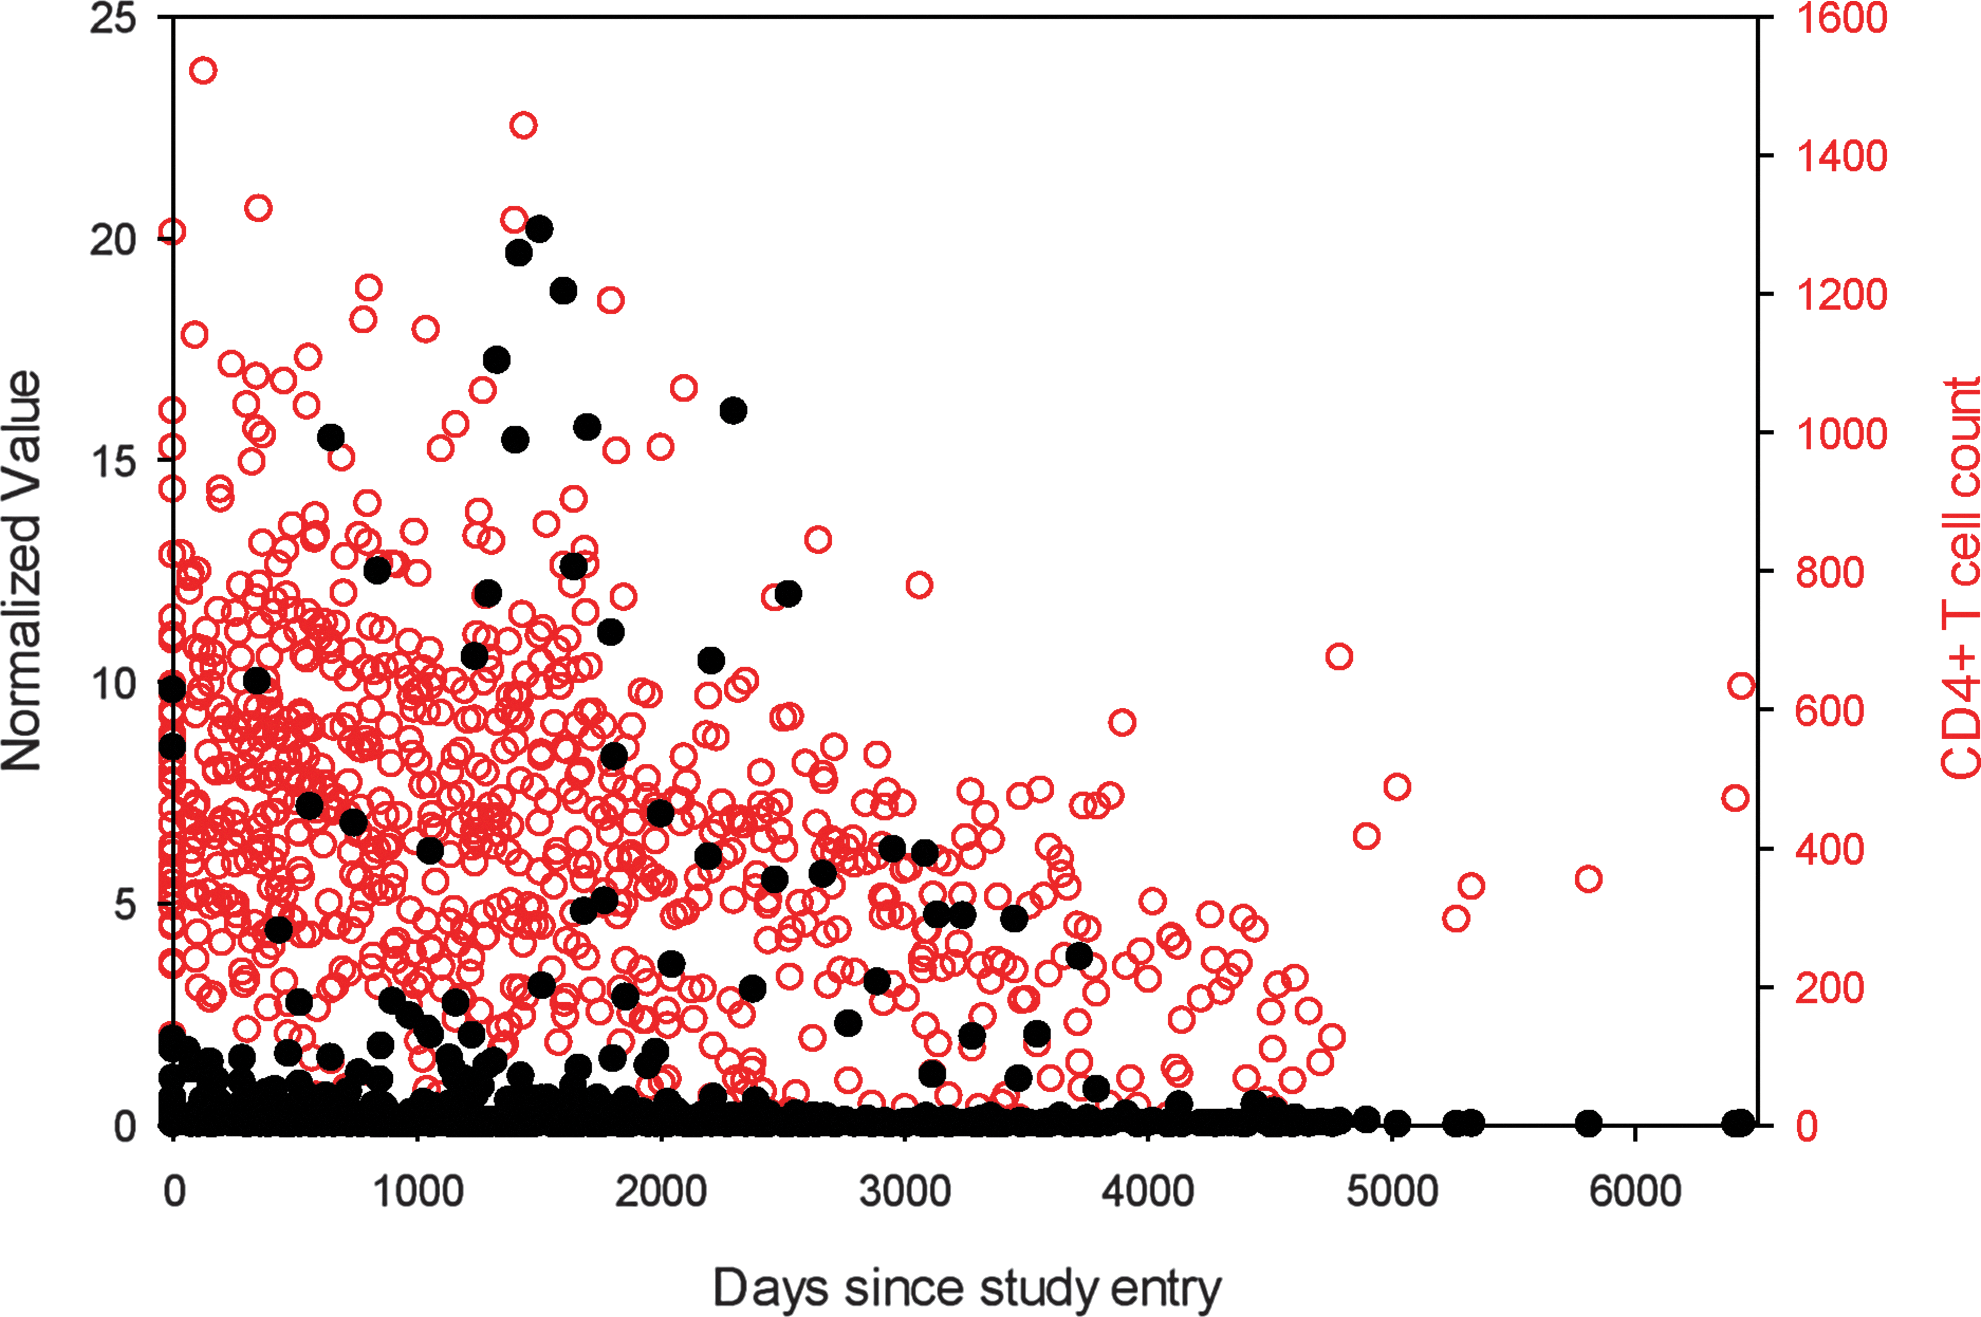
HIV-specific IgG3 antibody levels in the CDC men who have sex with men (MSM) cohort over days since study entry or CD4+ T cell count. Black closed circles represent the normalized IgG3 anit-p24 MFI values and red open circles represent the CD4+ T cell count for each specimen in the MSM cohort (n=784).
The median IgG3 normalized MFI value for all specimens was 0.05. Out of the 65 subjects evaluated in the study, 24 exhibited p24 IgG3 levels above the defined recent/long-term cutoff of 0.2 for two or more time points. Figure 4 illustrates the longitudinal reactivity for five representative subjects that exhibited high p24 IgG3 levels for multiple time points. All five subjects exhibited a drop in CD4+ T cell counts during the sample collection period, which was concurrent with a peak or increase in IgG3 levels.

Longitudinal p24-IgG3 reactivity. Black closed circles represent the normalized MFI values and red open circles represent the CD4+ T cell count at each time point. Participant IDs are listed in the upper right corner of each graph.
Discussion
In this study we characterized the longitudinal antibody response to HIV using a cohort of HIV-1-infected MSM with long-term follow-up, to evaluate the impact of HIV disease progression on the performance of the HIV-1 Bio-Plex assay. The cohort is unique in that sample collection began prior to the discovery of the etiologic agent responsible for AIDS and, therefore, ART was not readily available until late in the course of infection for most of the study subjects. Given the versatility of the Bio-Plex platform, we evaluated HIV-specific total IgG levels and avidity, in addition to p24-specific IgG3 levels, as a representation of antibody approaches that have previously demonstrated promise for HIV incidence estimation. 20,25 We found that HIV-specific IgG antibody levels and avidity remained relatively stable throughout the course of chronic infection and progression to AIDS, particularly for gp160 and gp41. Antibody reactivity to gp120 was lower in AIDS versus non-AIDS samples; however, the median value for gp120-n and gp120-a remained in the range of reactivity for long-term specimens. 12,25 The differences in reactivity between disease states may be reflective of the ongoing evolution of the HIV envelope that occurs throughout the course of infection. 39 The slight reduction in antibody levels and avidity, however, would likely not result in misclassification of these samples.
The discrepancy of these results with previous studies may be due to differences in the sensitivity of the Bio-Plex assay and other formats or different antigen composition of the various assays. More importantly, the cohort described herein allowed for the observation of longitudinal, subject-specific trends in reactivity prior to and, for some, through the progression to AIDS, rather than making assumptions based on single time point measures from multiple individuals. Furthermore, immune maturation could be observed in the absence of antiretroviral therapy-induced virus suppression since the MSM study enrolled participants at a time prior to advent of antiretroviral therapy. Although some study participants received ART after antiretroviral drugs became available, drug treatment occurred late in the course of infection and was not as effective as current highly active antiretroviral therapy (HAART) regimens. 29
Unlike total IgG, IgG3 antibody levels peak early in infection, but remain low or undetectable during chronic infection. 16,18 Wilson et al. observed a range of detection for anti-p24 IgG3 antibody within 1 to 4 months postseroconversion. 18 Using the Bio-Plex assay to evaluate longitudinal seroconverters, we found a similar peak of reactivity within the first 50 days postseroconversion. Given that HIV-specific IgG3 antibody levels are relatively short lived, the distinction in reactivity between acute and chronic infection makes the antibody subclass an attractive biomarker for identifying recent infection. Very few studies, however, have described IgG3 responses to HIV during chronic infection or progression to AIDS. Most available data suggest that anti-HIV IgG3 responses are nonexistent or rare in late infection. 16,17,21
In the MSM cohort evaluated in this study, a decline in the IgG3 response was associated with progression to AIDS for the overall study population; however, a considerable number of subjects (24 out of 65; data not shown) exhibited high levels of p24-specific IgG3 antibody at two or more time points during the sample collection period. In a similar cohort, Broliden et al. observed IgG3 responses directed against HIV-1 p17 and p24 during chronic infection and in individuals diagnosed with AIDS. 19 Though it is unclear why HIV-specific IgG3 levels may reappear or persist in some chronically infected individuals, it has been suggested that increases in IgG3 antibody during late-stage infection may reflect reactivations of the virus. 19 In support of this conclusion, IgG3 antibody levels appear to peak shortly after CD4+ T cell counts begin to decline (Fig. 4) in the highlighted subjects. Further investigation may be warranted to determine whether persistent or reemerging IgG3 responses are unique to this cohort or whether a small proportion of all chronically infected individuals will exhibit relatively high HIV-specific IgG3 levels. Preliminary studies have indicated similar findings in a longitudinal seroconversion cohort, 35,36 as high levels of p24 IgG3 were observed in select individuals with long-term HIV-1 infection (data not shown).
The HIV-1 Bio-Plex measurements for HIV-specific total IgG are encouraging, as the longitudinal antibody response to HIV-1 appears to be stable, even as the individual progresses to AIDS. IgG3 reactivity is a promising biomarker of recent infection; however, the biomarker has a relatively short window of detection during early infection and may be subject to some degree of misclassification due to individuals who exhibit a reemergence of IgG3 levels in late-stage infection. Alternatively, the IgG3 response may be a valuable predictor of recent infection when used as a component of a multianalyte algorithm, as described. 25 Though not addressed in this study, the impact of antiretroviral therapy on HIV-specific immune responses should also be considered in correlation with the Bio-Plex format.
Indicators of active virus replication are currently being evaluated for incorporation in the HIV-1 Bio-Plex assay to alleviate the need for additional tests or clinical data in developing an algorithm for incidence estimation.
In summary, HIV-specific IgG antibody levels and avidity remain relatively constant throughout the course of HIV infection, as measured by the HIV-1 Bio-Plex assay, which has positive implications for the reliability of the platform as a test for recent HIV infection. Future studies will include large-scale evaluation of prototype commercial kits to establish assay parameters, such as optimal analyte cutoff values, mean duration of recency, and multianalyte algorithms for determining recent infection.
Footnotes
Acknowledgments
The authors would like to thank Kevin Delaney at the Centers for Disease Control and Prevention, Dr. Man Charurat of the Institute of Human Virology at the University of Maryland School of Medicine, and Dr. Abdulsalami Nasidi of the Nigerian Federal Ministry of Health in Abuja, Nigeria for contributing the REACH cohort. We also acknowledge Dr. Thomas Spira at the Centers for Disease Control and Prevention for his tremendous involvement with the long-term MSM cohort.
The findings and conclusions in this report are those of the authors and do not necessarily represent the views of the Centers for Disease Control and Prevention.
Author Disclosure Statement
No competing financial interests exist.