




Abstract
Identifying and monitoring HIV clusters could be useful in tracking the leading edge of HIV transmission in epidemics. Currently, greater specificity in the definition of HIV clusters is needed to reduce confusion in the interpretation of HIV clustering results. We address sampling density as one of the key aspects of HIV cluster analysis. The proportion of viral sequences in clusters was estimated at sampling densities from 1.0% to 70%. A set of 1,248 HIV-1C env gp120 V1C5 sequences from a single community in Botswana was utilized in simulation studies. Matching numbers of HIV-1C V1C5 sequences from the LANL HIV Database were used as comparators. HIV clusters were identified by phylogenetic inference under bootstrapped maximum likelihood and pairwise distance cut-offs. Sampling density below 10% was associated with stochastic HIV clustering with broad confidence intervals. HIV clustering increased linearly at sampling density >10%, and was accompanied by narrowing confidence intervals. Patterns of HIV clustering were similar at bootstrap thresholds 0.7 to 1.0, but the extent of HIV clustering decreased with higher bootstrap thresholds. The origin of sampling (local concentrated vs. scattered global) had a substantial impact on HIV clustering at sampling densities ≥10%. Pairwise distances at 10% were estimated as a threshold for cluster analysis of HIV-1 V1C5 sequences. The node bootstrap support distribution provided additional evidence for 10% sampling density as the threshold for HIV cluster analysis. The detectability of HIV clusters is substantially affected by sampling density. A minimal genotyping density of 10% and sampling density of 50–70% are suggested for HIV-1 V1C5 cluster analysis.
Introduction
A
In this article we address how HIV clustering might be affected by sampling of viral sequences. Specifically, we focus on sampling density as one of the key aspects in HIV cluster analysis.
Studies with relatively high sampling density have provided important insights into the dynamics of HIV transmission networks, and have demonstrated the significant extent of HIV clustering. 3,5,7,11 –15,20 While HIV clustering patterns have been well characterized among men who have sex with men (MSM), 7 –11,13 –22 the structure and dynamics of heterosexual HIV transmission networks in sub-Saharan Africa are understudied. 12,23 –27 High sampling density in local communities has been associated with a higher extent of HIV clustering. 23 Studies with low sampling density showed minimal HIV clustering. 28
It is not likely that viral sequence data from HIV prevention studies can ever completely represent the population of interest. In a recent study we focused on adjusting for missing data obtained through a household survey in Mochudi, Botswana (described below). This subset of HIV-1C V1C5 sequences represented 24.4% sampling density and used the pairwise distances threshold for HIV cluster definition. 29 We investigated the linkage rate across groups defined by viral load (low/high) and antiretroviral treatment (ART) status, and estimated the probability that a sequence from one group links to at least one sequence from another group. We demonstrated that the extent of linkage decreases as the sample proportions decrease and proposed a method for adjusting for missing data that, in simulation studies, greatly reduced the bias resulting from having incomplete observations. 29
In this study we focused on relationships between the extent of HIV clustering and sampling density, used a larger set of HIV-1C V1C5 sequences that represents 70% sampling density, and used a nonparametric bootstrap support under the maximum likelihood (ML) method for HIV cluster definition. We estimated the proportion of viral sequences in clusters across the range of sampling coverage, from 1.0% to 70%, in a series of simulation studies. In addition to the set of HIV-1 subtype C env gp120 V1C5 sequences sampled from a single community in Botswana, we used a matching number of HIV-1C V1C5 sequences retrieved from the LANL HIV Database (
While the interpretation of bootstrap support in a phylogenetic tree might depend on multiple factors, most experts agree that bootstrap proportions can be used as a rough statistical estimate for a node, given the data. 30 –38 In this study we used the bootstrap support of splits as a technique to test the relative stability of groups within a phylogenetic tree 39 and to estimate the statistical support of monophyletic clades (subtrees, viral lineages, clusters) in phylogenetic trees inferred by the ML method.
Materials and Methods
Definition of sampling density
Sampling density was estimated as the proportion of genotyped viral sequences in the estimated number of HIV-infected individuals residing in a given geographic area. The HIV prevalence rate and the total number of residents of the targeted community were used to estimate the number of HIV-infected individuals.
HIV-1C sequences from Mochudi, Botswana
In this study we utilized HIV-1C env gp120 V1C5 sequences obtained from residents of the northeast sector (NES) of Mochudi, a periurban village in Botswana. The total population of the NES of Mochudi is 15,000 based on 2011 Botswana census data, 40 with 8,700 estimated to be 16 to 64 years old. The total number of HIV-infected individuals in this age range in the NES of Mochudi was estimated at 1,731 based on the 19.9% prevalence rate of HIV-1 infection estimated during the recent Mochudi Prevention Project. 23 The total number of HIV-1C genotypes that originated from the NES of Mochudi was 1,248, which corresponds to a genotyping coverage, or sampling density, of 72.1% (95% CI 69.9% to 74.2%). The accession numbers of the 813 Mochudi sequences are AF443076–AF443078, AF443087, KF373801, KF373812–KF373815, KF373823, KF373824, KF373826, KF373830, KF373836, KF373841, KF373843, KF373850, KF373851, KF373858–KF373861, KF373863–KF373865, KF373872, KF373877, KF373880, KF373883, KF373887, KF373890, KF373891, KF373893, KF373894–KF374041, KF374043–KF374217, KF374219–KF374265, KF374267–KF374314, KF374316–KF374615, and KF374617–KF374678. The accession numbers of the 435 new Mochudi sequences are KM190236–KM190670.
HIV-1C sequences from the LANL HIV database
A total of 2,442 HIV-1C env gp120 V1C5 sequences were retrieved from the LANL HIV Database. The criteria for sequence selection included HIV-1 subtype C, single sequence per subject, and a length ≥1,000 bp within the targeted V1C5 region, HXB2 nt positions 6,570 to 7,757. After removing duplicates, infant sequences from mother–infant pairs, and known sequences from Mochudi, the LANL set of HIV-1C V1C5 sequences comprised 1,407 sequences used in the simulation studies. The 1,407 HIV-1C V1C5 sequences used in this study included 778 sequences from South Africa, 168 from Malawi, 98 from Zambia, 86 from India, 63 from Botswana, 54 from Tanzania, 33 from China, 22 from Zimbabwe, 14 from Cyprus, and fewer than 10 sequences from 30 other countries. A list of HIV-1C V1C5 sequences from the LANL HIV Database used in this study is presented in Supplementary Table S1 (Supplementary Data are available online at
Phylogenetic inference
The phylogenetic relatedness among HIV-1C env gp120 V1C5 sequences was estimated by bootstrapped ML analysis 41 implemented in MEGA6. 42 The GTR+Γ+Ι, the general time-reversible substitution model with a gamma distribution of among-sites rate variation (α-shape parameter at 0.60) and invariant sites (pinv at 0.05), was determined by MEGA6 42 as the best-fit model of nucleotide substitution for the analyzed V1C5 region. The bootstrap support of splits, which is known to be an effective technique to test the relative stability of groups within a phylogenetic tree, 39 was used as statistical support of monophyletic clades (subtrees, viral lineages, clusters). The number of replicates in each run was 100. Four bootstrap values, ≥0.7, ≥0.8, ≥0.9, and 1.0, were used as thresholds for identification of distinct viral lineages. The proportion of V1C5 sequences in clusters was analyzed by ClusterPicker 43 using matching MLGTR+Γ+Ι trees at bootstrap support of ≥0.80 over the range of pairwise distance thresholds for cluster identification from 1% to 15%.
Simulation studies
Potential associations between sampling density and proportion of clustered HIV-1C env gp120 V1C5 sequences were assessed in simulation studies. Randomly selected sequences represented sampling densities from 1% to 70%. Multiple replicates were used for sampling density from 1% to 50%, while single subsets represented sampling densities at 60% and 70%. Supplementary Table S2 outlines 16 subsets of V1C5 sequences with the number of sequences, percent sampling density, and number of replicates per each subset. The proportion of viral sequences in clusters was estimated for each subset using bootstrapped ML inference, as described above. The percent of sampling density was applied only to the Mochudi set of 1,248 sequences as the total number of HIV-infected individuals in this community was estimated based on HIV prevalence 23 and 2011 Botswana census data. 40 It was not possible to apply sampling density to the set of 1,407 non-Mochudi sequences retrieved from the LANL HIV Database, as the total number of HIV-infected individuals in the regions sampled remained unknown.
Statistical analysis
All confidence intervals of estimated proportions are asymptotic 95% binomial confidence intervals (95% CI). p-values less than 0.05 were considered statistically significant and all hypothesis tests were two-sided. Statistical analysis was performed using R version 3.0.1, and plots and histograms were produced in R. All figures were finalized in Adobe Illustrator CS6.
Results
To address whether the extent of HIV clustering depends on sampling density, the proportion of HIV sequences in clusters was estimated using random sets of sequences originating from a single community. The replicated sets of V1C5 sequences were randomly selected from the total of 1,248 V1C5 sequences originating from Mochudi, Botswana. The size of each sequence set corresponded to the following 16 sampling densities: 1.0%, 1.5%, 2.0%, 3.0%, 4.0%, 5.0%, 7.5%, 10%, 15%, 20%, 25%, 30%, 40%, 50%, 60%, and 70% (Supplementary Table S2). There were 20 replicates for each sampling density for the two smallest subsets (1.0% and 1.5%) and 10 replicates for each of the next 12 sampling densities (from 2.0% to 50%). The largest sampling densities of 60% and 70% were represented by single subsets. The proportion of HIV sequences in clusters was estimated within each subset by the bootstrapped ML analysis 41 using MEGA6 42 and 100 replicates. Four bootstrap thresholds, ≥0.7, 0.8, ≥0.9, and 1.0, were used for identification of sequences in clusters.
HIV clustering depends on sampling density and bootstrap support
The extent of HIV clustering positively correlated with sampling density. Figure 1 shows how HIV clustering changes with the increase of sampling density. We note the difference in the shape of the curves for sampling densities below 7.5% compared to those of 10% and above. HIV clustering at low sampling density below 7.5% is quite variable, with broad confidence intervals of clustering rates. The confidence intervals of HIV clustering narrow as sampling density increases. Starting at 10% sampling density, HIV clustering demonstrates steady linear increase up to 70% sampling density.
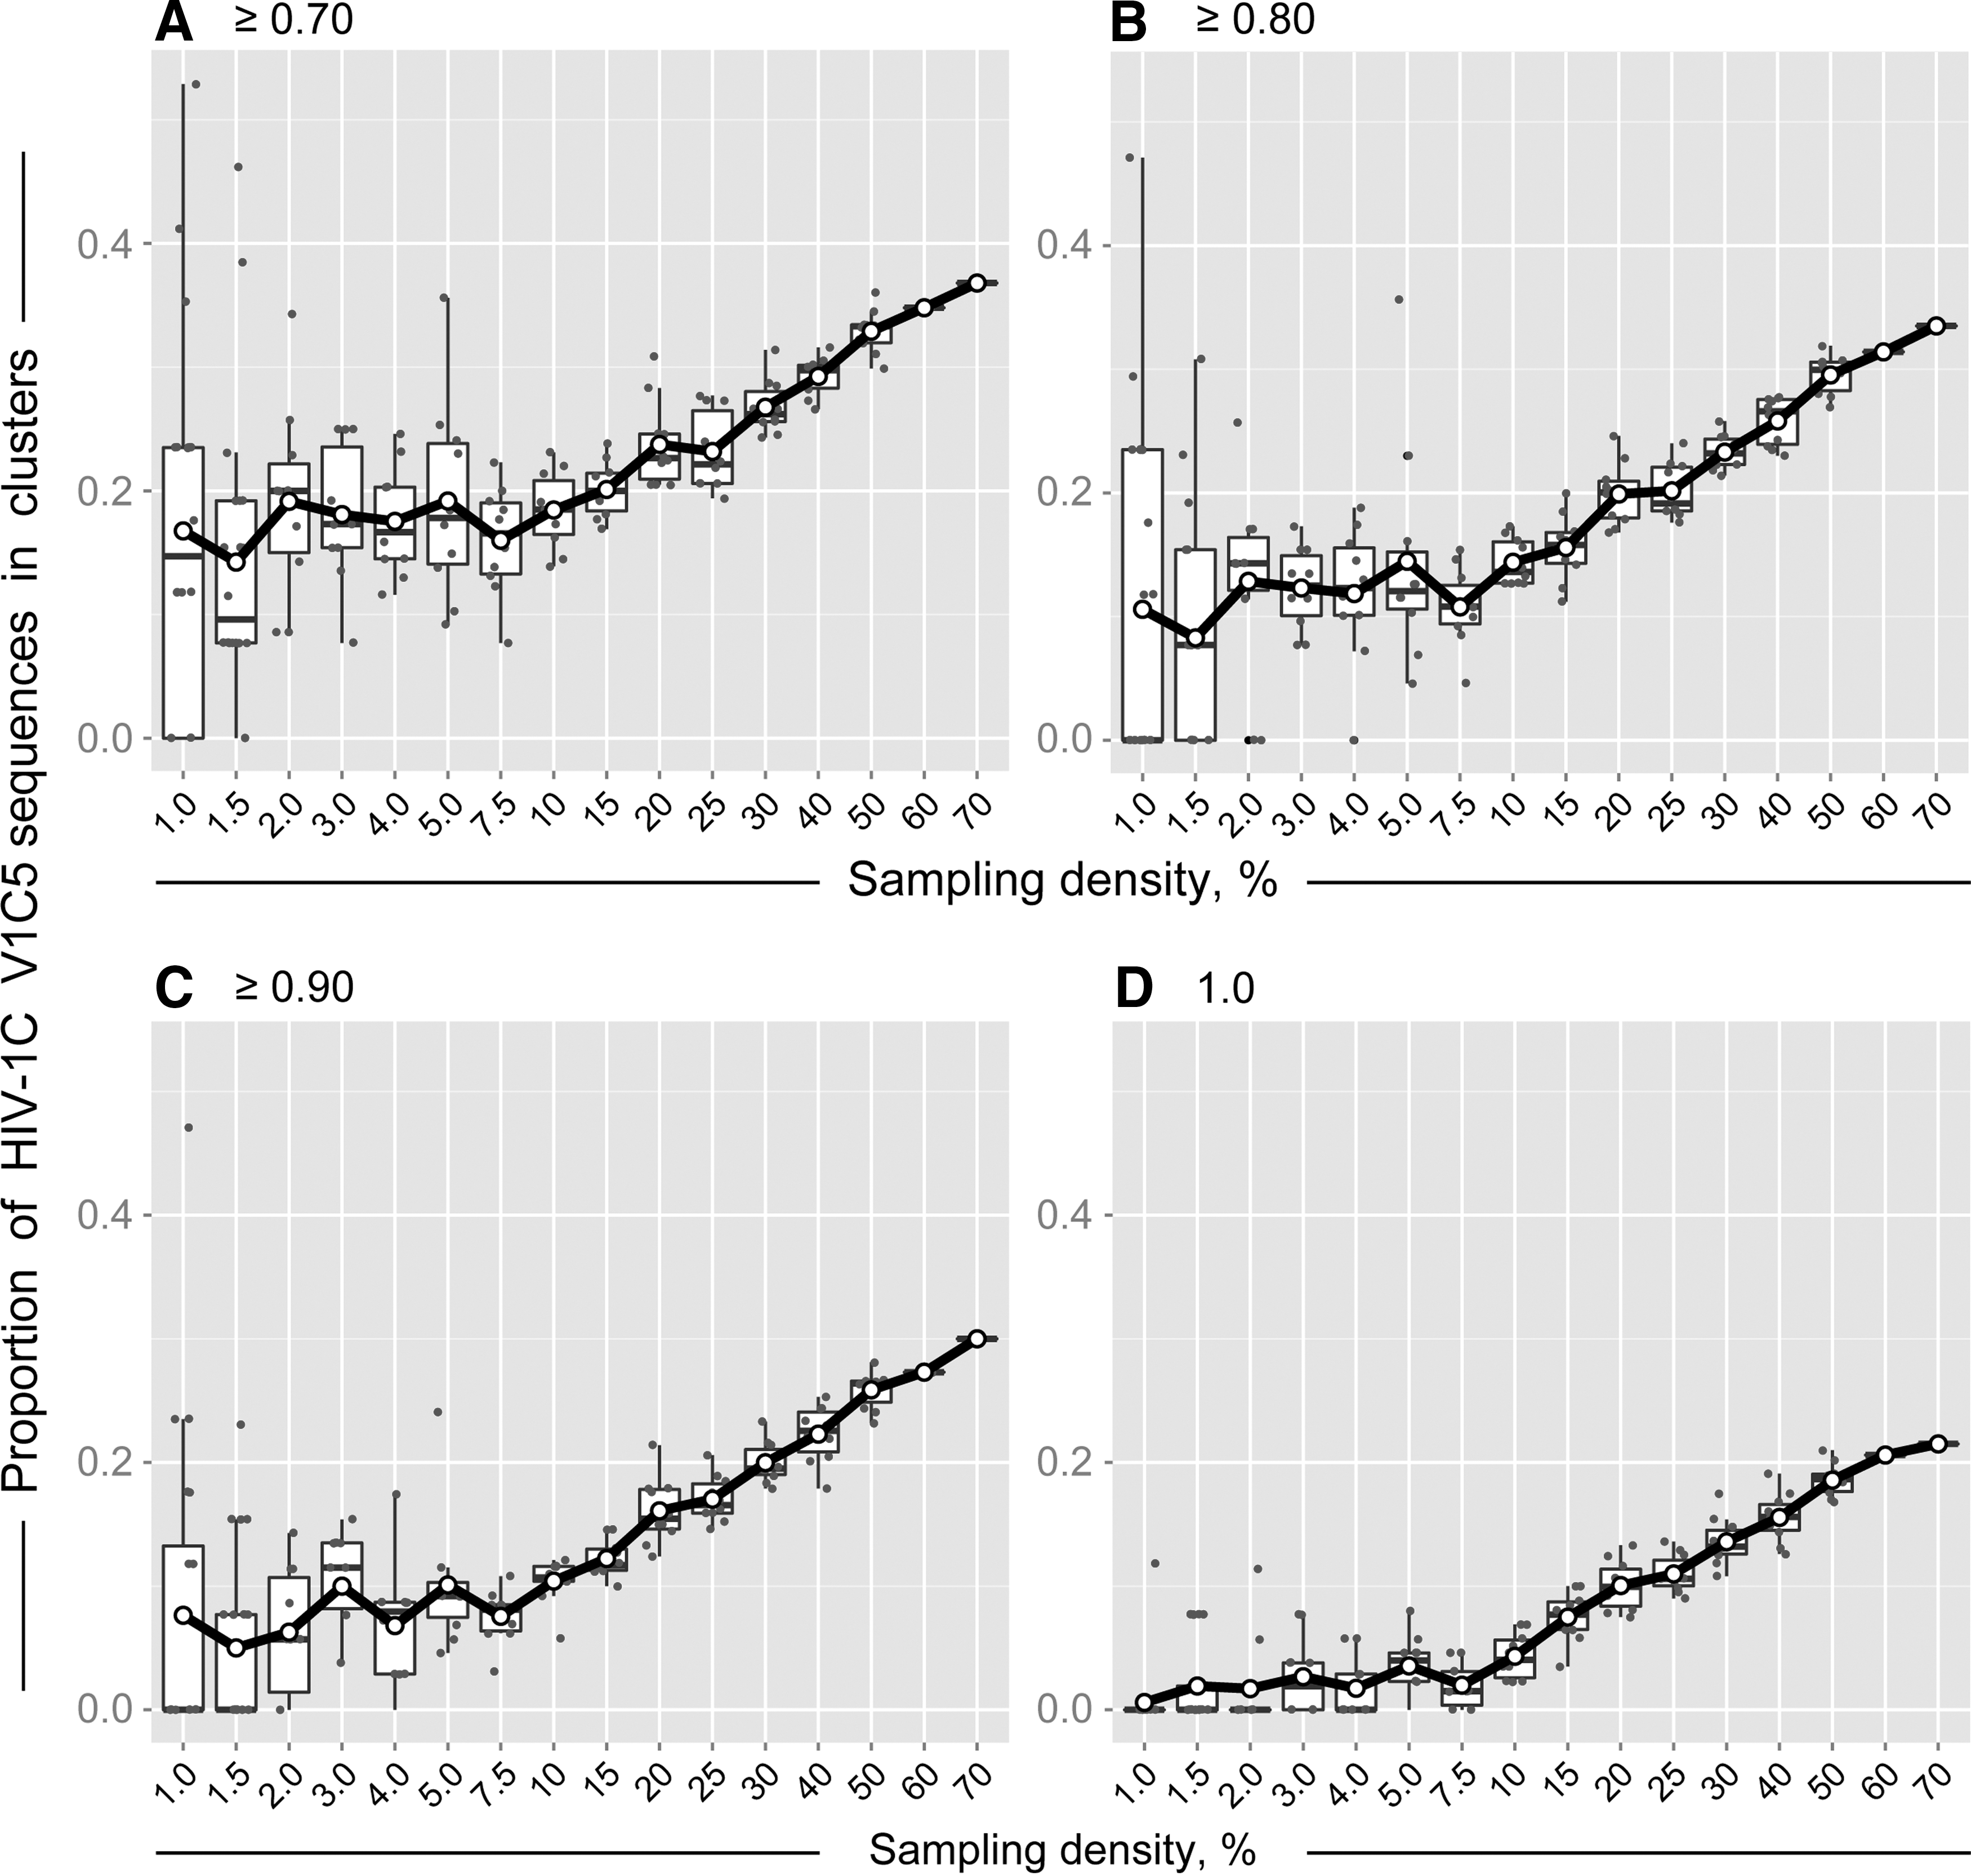
Sampling density and HIV clustering of HIV-1 V1C5 sequences from Mochudi, Botswana. Simulation analysis was based on bootstrapped MLGTR+Γ+Ι with 100 replicates. Axis y shows the proportion of HIV-1C V1C5 sequences in clusters. Axis x shows the sampling density from 1% to 70%. Subsets of V1C5 sequences corresponding to the specified sampling densities were randomly selected from a total of 1,248 HIV-1C V1C5 sequences from Mochudi (estimated sampling coverage of 72.1%). There were 20 replicates for the sampling densities 1% and 1.5%, 10 replicates for each of the sampling densities from 2% to 50%, and single sets for sampling densities 60% and 70%. Each graph corresponds to the specified bootstrap threshold for cluster definition:
At the bootstrap threshold of ≥0.7, 18.4% (95% CI 16.5% to 20.4%) of V1C5 sequences were found in clusters at sampling density 10%. At the same bootstrap support of ≥0.7, the proportion of clustered V1C5 sequences increased to 32.9% (95% CI 31.8% to 34.0%) at sampling density 50% and reached 36.8% at sampling density 70%. At the bootstrap threshold of ≥0.8, the proportion of HIV-1C sequences in clusters increased from 14.4% (95% CI 13.2% to 15.6%) at 10% sampling density to 29.5% (95% CI 28.6% to 30.5%) at 50% sampling density and to 33.5% at 70% sampling density.
The patterns of HIV clustering were similar at bootstrap thresholds from ≥0.7 to 1.0 in Fig. 1A–D. As expected, the extent of HIV clustering decreased with tighter bootstrap thresholds. The study was not able to address patterns of HIV clustering above 70% sampling density as the number of available HIV-1C env gp120 V1C5 sequences was 1,248, which corresponded to an estimated 72.1% of sampling coverage in Mochudi.
Impact of sampling origin on HIV clustering
To evaluate the impact of sampling origin on HIV clustering, a concentrated sampling from a local epidemic was compared with scattered sampling from a global epidemic. Specifically, the proportions of viral sequences in clusters were assessed and compared between two sets of HIV-1C env gp120 V1C5 sequences representing concentrated local and scattered global sampling. The first set of 1,248 HIV-1C V1C5 sequences originating from a single community, Mochudi, represented local concentrated sampling (the Mochudi set). The second set of 1,407 V1C5 sequences retrieved from the HIV LANL Database represented scattered sampling from the HIV-1C epidemic (the LANL set). The LANL set was filtered for Mochudi sequences as well as duplicates and known mother-infant pairs. The Mochudi set of V1C5 sequences covered sampling density from 1.0% to 70% (see the previous section). The randomly selected V1C5 sequences in the LANL set matched the number of sequences in the Mochudi set and the number of replicates per set.
The simulation studies demonstrate that origin of sampling has a substantial impact on HIV clustering (Fig. 2). Little to no difference in HIV clustering was observed between concentrated and scattered sampling for small subsets of V1C5 sequences corresponding to local sampling density below 7.5%. This observation is not surprising due to lack of trend in rates of clustering at sampling rates below 7.5%. However, after reaching the threshold of about 10% sampling density (of local sampling), the proportion of V1C5 sequences in clusters linearly increased in sets of V1C5 sequences representing local sampling but remained low for all matching sets of V1C5 sequences originating from scattered global sampling. The difference in the proportion of V1C5 sequences in clusters between concentrated local and scattered global sampling increased gradually with expanding sampling density. Thus, the same number of V1C5 sequences can be associated with different degrees of HIV clustering depending on whether viral sequence sampling originates from a single community or represents scattered sampling from a global epidemic.
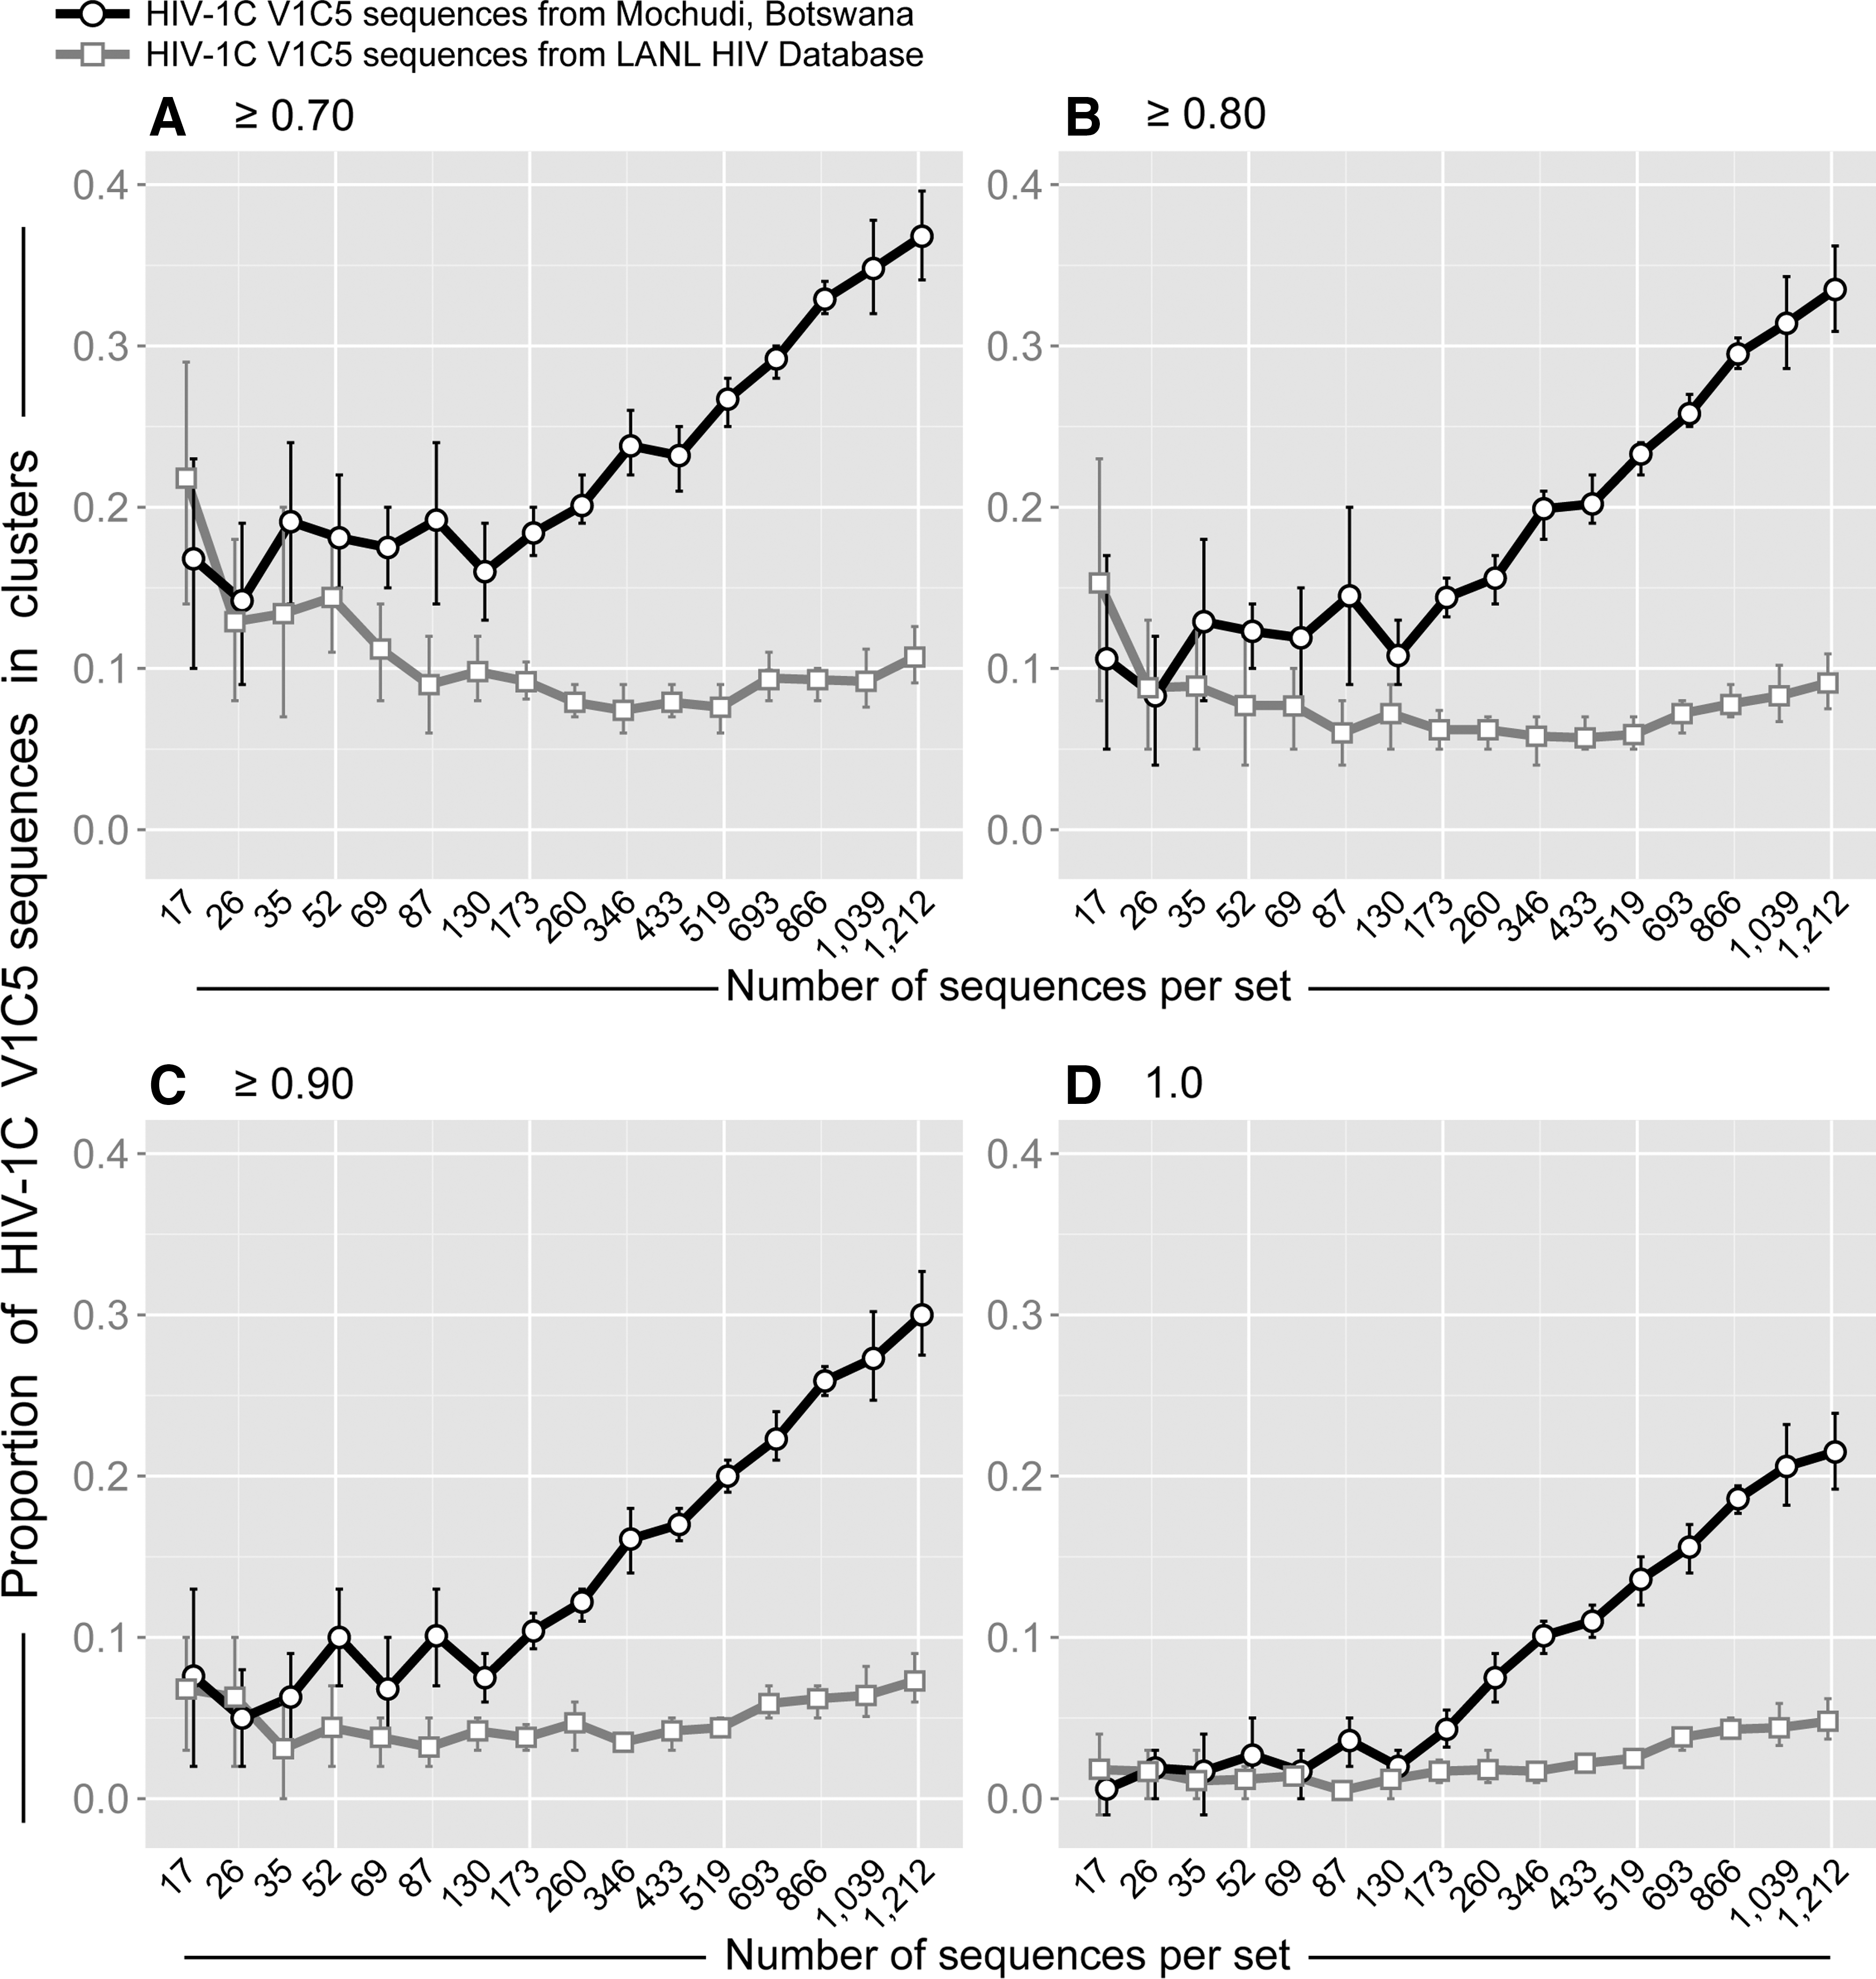
Origin of sampling and HIV clustering. Simulation analysis based on 1,248 HIV-1C V1C5 sequences from Mochudi and 1,407 HIV-1C V1C5 non-Mochudi sequences from the LANL HIV Database. Axis y shows the proportion of HIV-1C V1C5 sequences in clusters. Axis x shows the number of V1C5 sequences per set, which corresponds to sampling densities from 1% to 70% in the Mochudi set (please note that the number of 1,212 sequences corresponds to 70% sampling density in Mochudi). The number of V1C5 sequences and the number of replicates (as described in Fig. 1 and in Supplementary Table S2) in the simulation analysis were matched between Mochudi and non-Mochudi sets of V1C5 sequences. Each graph corresponds to the specified bootstrap threshold for cluster definition:
HIV clustering is associated with pairwise distance threshold
Patterns of HIV clustering at different sampling densities were analyzed in the context of pairwise distances used for identification of clusters. Specifically, we addressed how the interaction between level of sampling density and the threshold of pairwise distance affects the proportion of V1C5 sequences in clusters. The subsets of randomly generated V1C5 sequences originating in Mochudi were analyzed by ClusterPicker 43 using matching MLGTR+Γ+Ι trees. The sampling densities spanned a range from 1% to 70%. The proportion of V1C5 sequences in clusters was estimated at bootstrap support of ≥0.80. The pairwise distance thresholds ranged from 1% to 15%.
The proportion of V1C5 sequences in clusters depended on the threshold of pairwise distances (Fig. 3). At low levels of sampling density (below 3%) HIV clustering was highly uncertain, the confidence intervals for clustering were broad, and the effect of pairwise distance threshold was unclear. An increase of sampling density in the range between 3% and 10% resulted in narrowing confidence intervals of HIV clustering and the appearance of a sigmoid, or S-shaped curve, indicating a potential association between pairwise distance threshold and HIV clustering. Finally, at sampling densities of 10% and above, the association between pairwise distances and HIV clustering became more clearly defined and formed a well-shaped S-curve reflecting substantially reduced confidence intervals of HIV clustering.
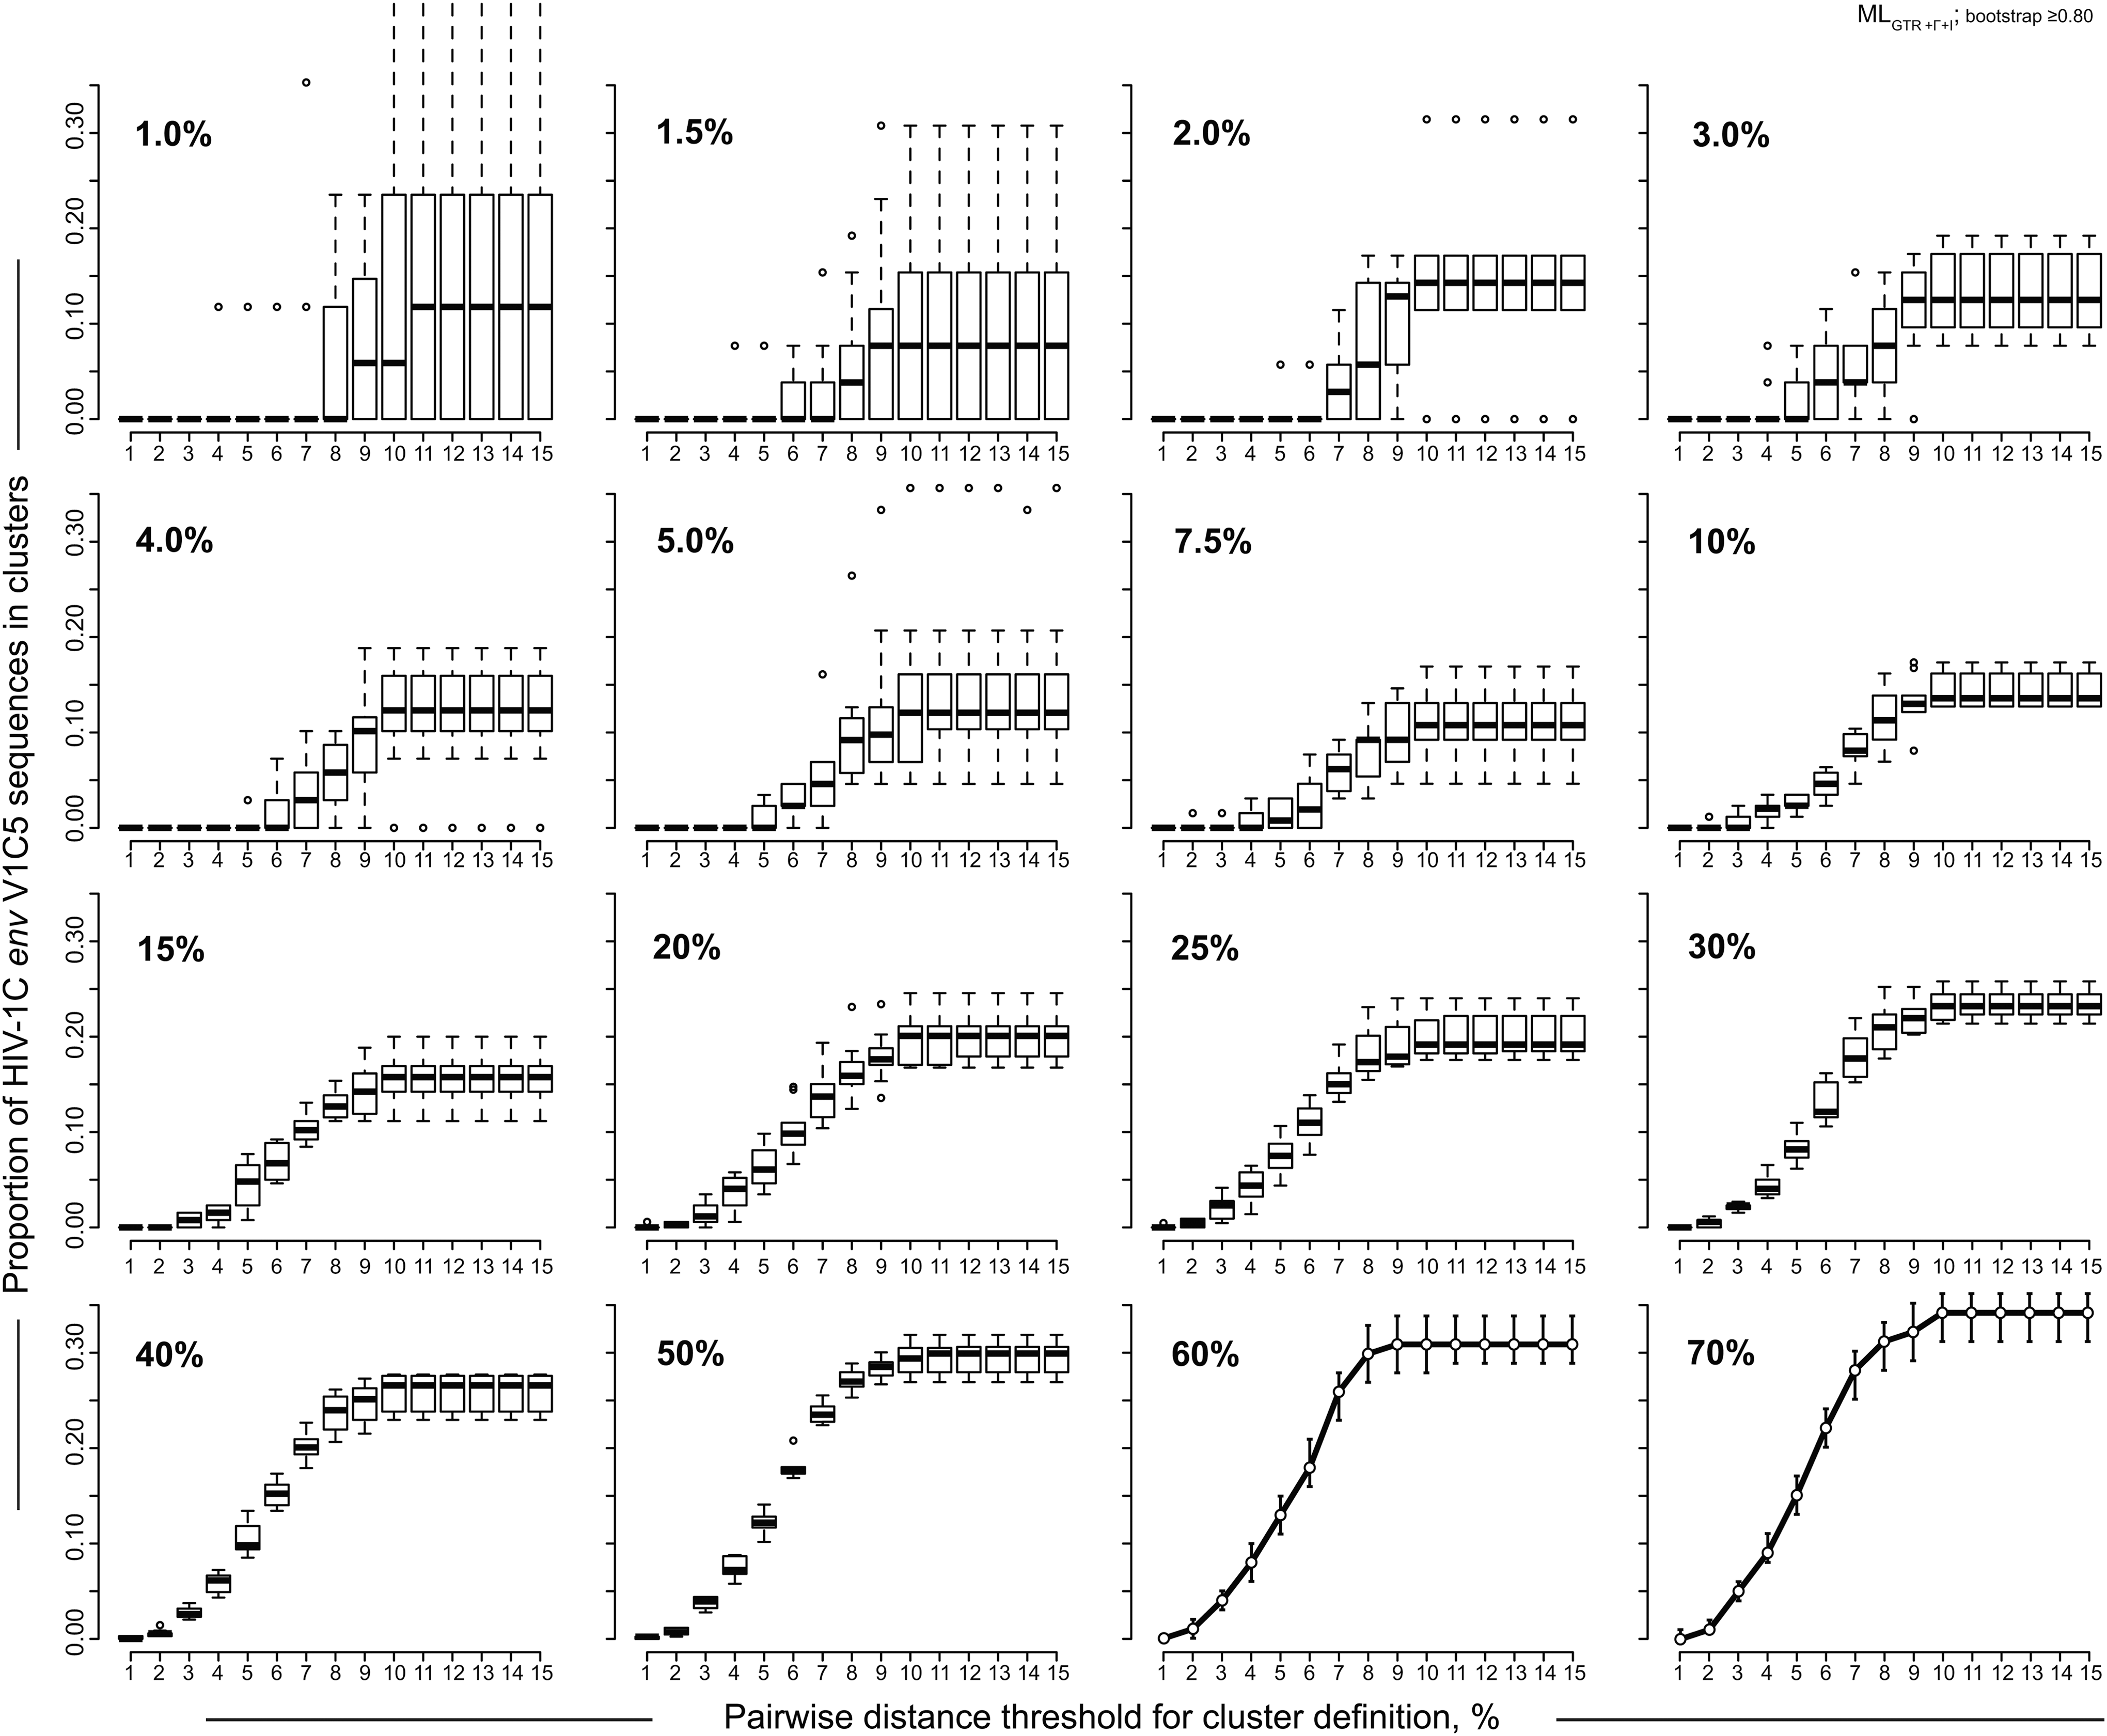
Pairwise distances and HIV clustering. Results of the simulation analysis based on bootstrapped MLGTR+Γ+Ι with 100 replicates and bootstrap threshold of ≥0.80 using 1,248 HIV-1C V1C5 sequences from Mochudi are presented. Clusters were identified and enumerated by ClusterPicker. 43 Axis y shows the proportion of HIV-1C V1C5 sequences in clusters. Axis x shows the pairwise distance thresholds for cluster identification from 1% to 15%. Sampling densities from 1% to 70% are shown in the upper left corner of each graph. For sampling densities 1% to 50%, boxplots summarize the estimated proportions of V1C5 sequences in clusters at different thresholds of pairwise distances using 10 to 20 replicates of randomly selected sequences. For sampling densities 60% and 70% points show mean values and error bars correspond to 95% CI for each pairwise distance threshold.
The proportion of V1C5 sequences in clusters gradually increased between the 2% and 10% thresholds of pairwise distances and reached a plateau at the 10% threshold of pairwise distances. Thus, in our settings 10% may be considered a reasonable threshold of pairwise distances for cluster analysis using the HIV-1 env gp120 V1C5 region.
The observed patterns of HIV clustering and dynamics of confidence intervals provide additional evidence that the threshold of sampling density at 10% might be necessary (if not sufficient) for reliable HIV cluster analysis and suggest that higher sampling density might be associated with a more accurate estimation of HIV sequences in clusters.
Sampling density affects node bootstrap support distribution
The distribution of node bootstrap support could enable a better understanding of patterns of HIV clustering. We addressed whether sampling density is associated with node bootstrap support distribution and focused on bootstrap values between 0.7 and 1.0 as the most informative fragment of node bootstrap support distribution (Fig. 4). At low sampling density, below 10%, the node bootstrap support distribution was scattered, varied between replicates, and did not show any clear pattern. In contrast, the proportion of nodes with the extreme bootstrap support of 1.0 gradually increased over sampling densities of 10% and above.
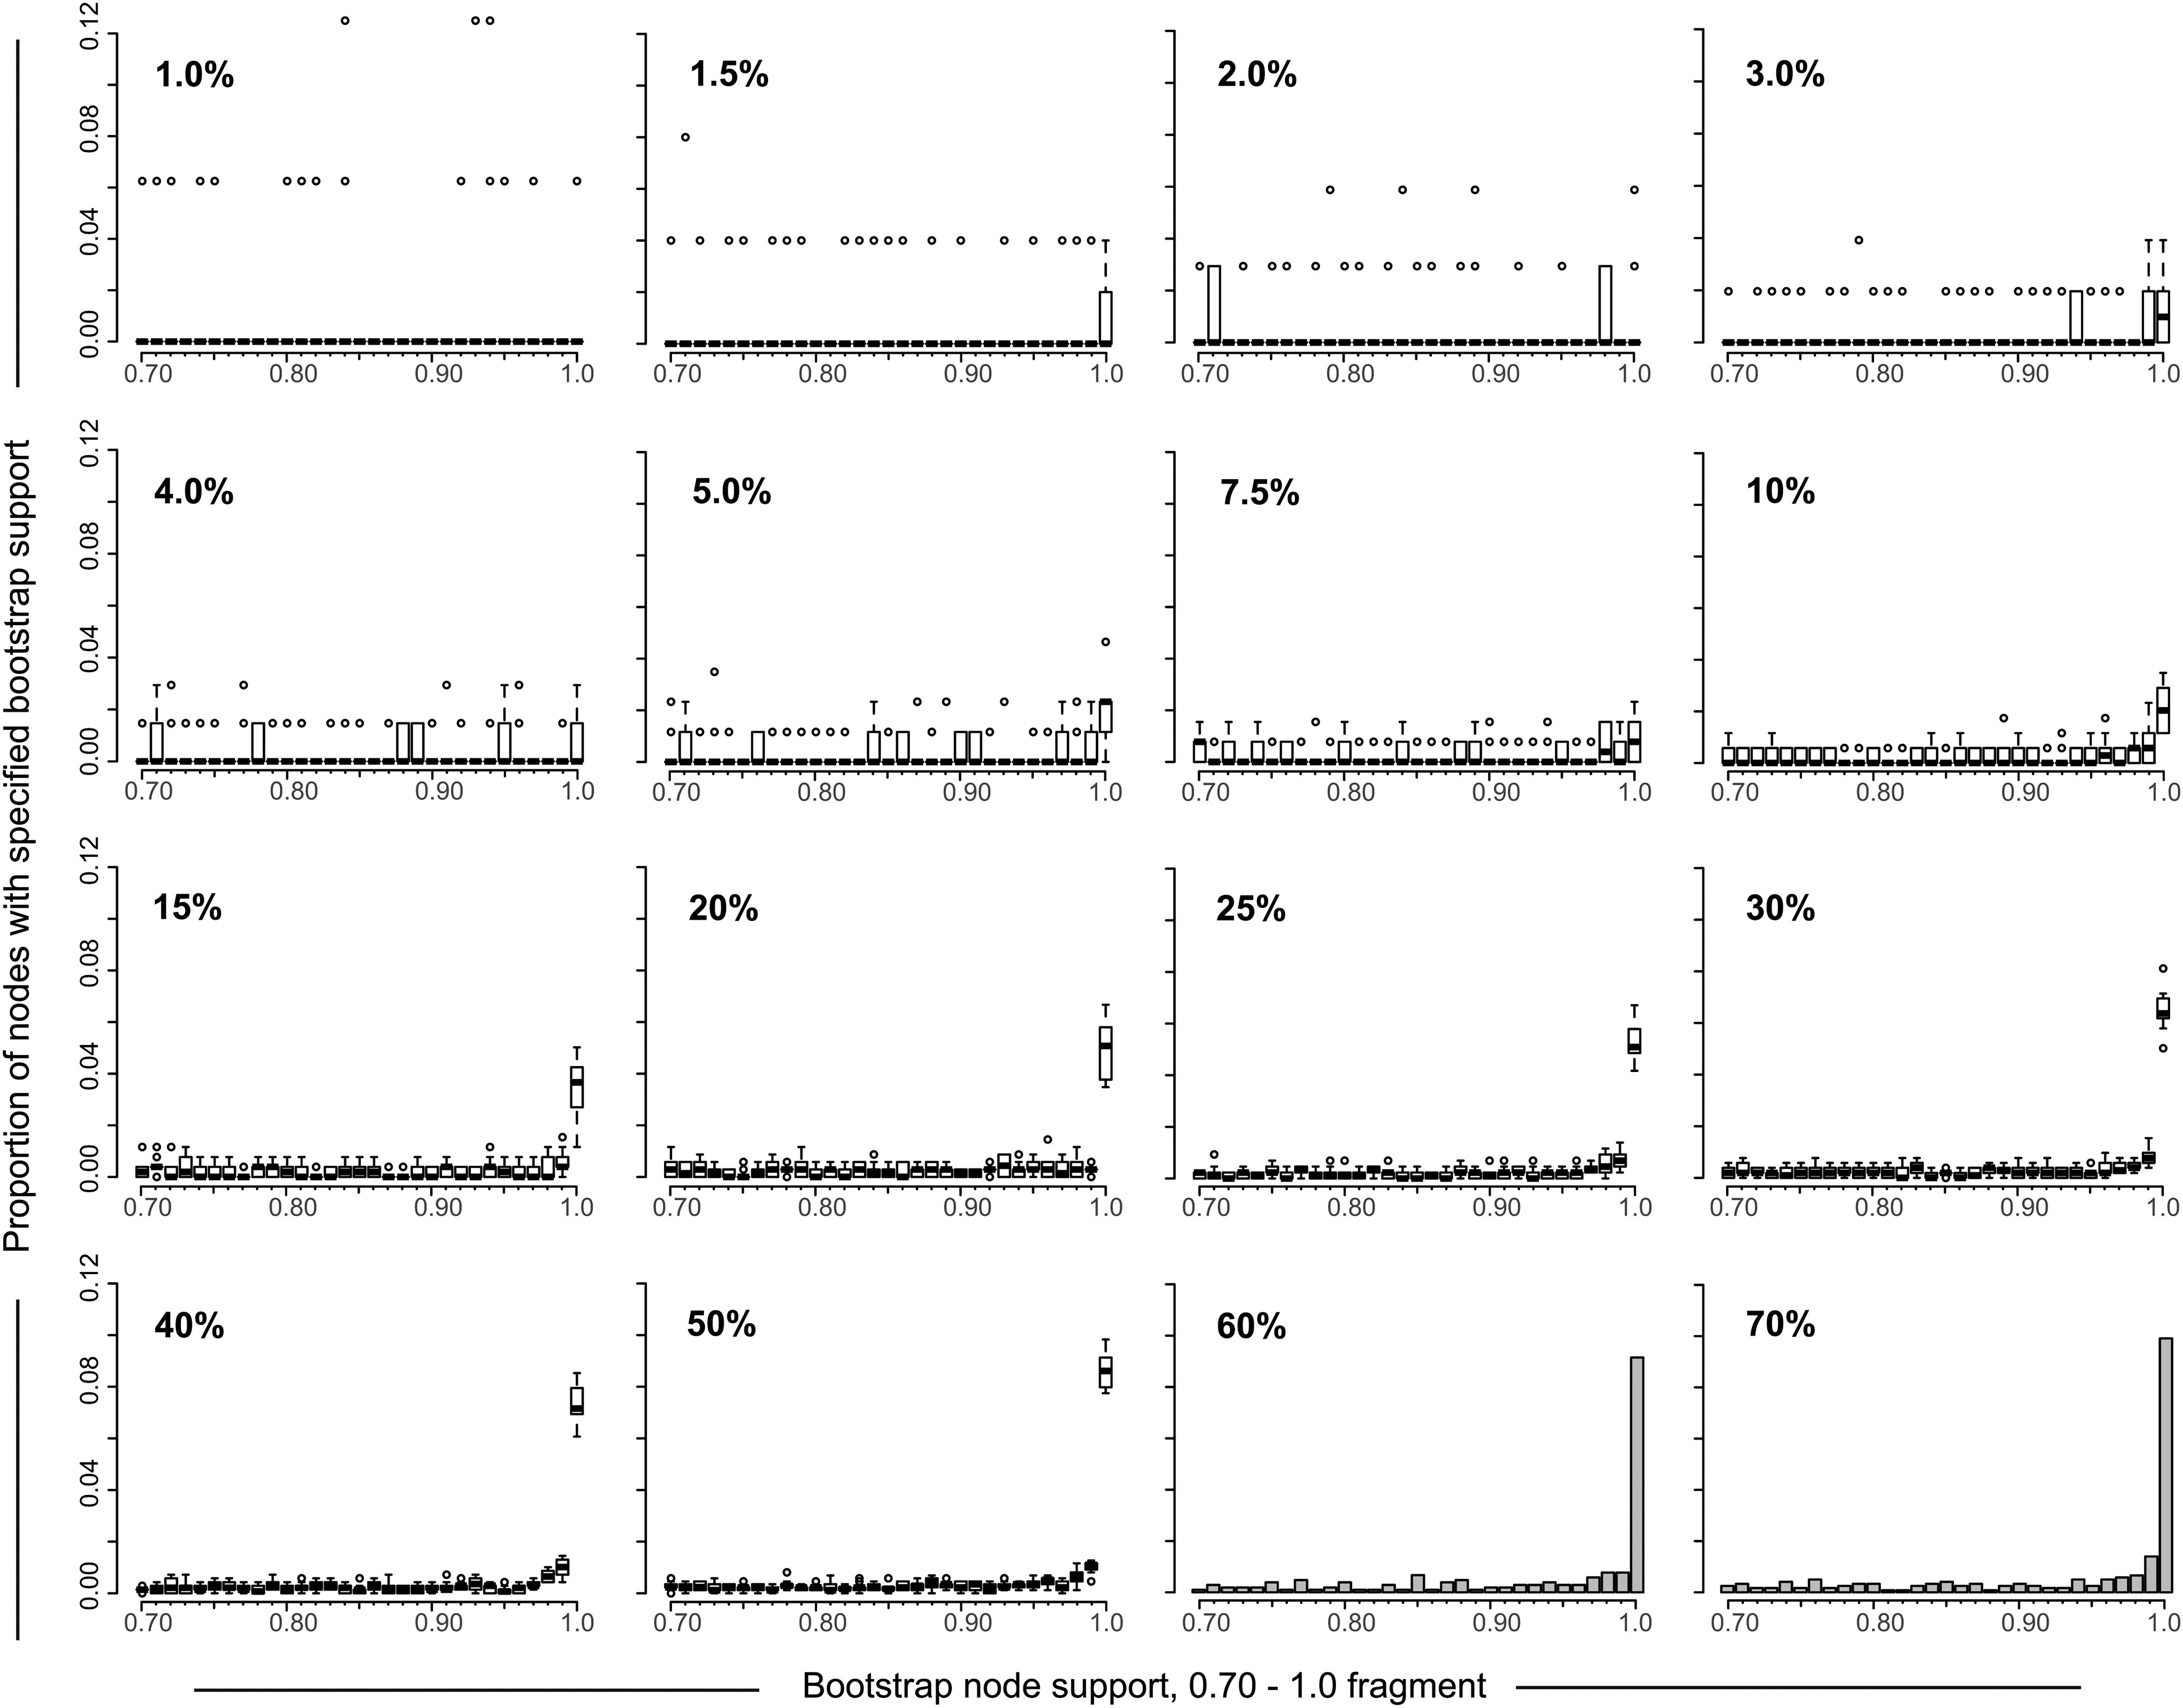
Node bootstrap support distribution. The 16 graphs depict the distribution of nodes bootstrap support values for sampling densities from 1% to 70% (shown in the upper left corner of each graph). The distribution of bootstrap node support is shown only for the 0.7 to 1.0 part of distribution for clarity (axis x). Axis y shows the proportion of nodes with specified bootstrap support. For sampling densities 1% to 50%, boxplots (one boxplot per bootstrap value from 0.7 to 1.0) summarize the estimated proportions of nodes with specified bootstrap support using 10 to 20 replicates of randomly selected sequences. For sampling densities 60% and 70% histograms show the distribution of nodes bootstrap support.
Analysis of node bootstrap support distribution provides additional evidence for considering 10% sampling density to be a reasonable threshold for HIV cluster analysis and suggests clearer patterns of HIV clustering at sampling densities of 50% to 70%.
Discussion
Sampling density is a critical component in epidemiological and molecular epidemiological studies addressing HIV transmission dynamics. While there is general agreement about the need for high sampling density in HIV transmission studies, there is no consensus on the required level of sampling density, as aims and goals vary between studies. The level of sampling, the way in which sampling is actually performed (e.g., population based, by convenience), and the presence of unintended missing data (e.g., samples that cannot be genotyped) are serious concerns, as sampling density never reaches 100%.
Monitoring of virus spread in local HIV transmission networks could inform HIV preventive interventions and facilitate the design of targeted prevention strategies. Knowledge of patterns of HIV spread within and across communities could help in optimizing and balancing HIV preventive strategies, such as Treatment-as-Prevention and Pre-Exposure Prophylaxis.
In this study we address the relationships between sampling density and HIV clustering, a topic closely related to analysis of HIV transmission networks. We utilized two sets of HIV-1C env gp120 V1C5 sequences, samples originating from a single southern African community and sequences retrieved from the LANL HIV Database. Through a series of simulations, we demonstrated the way in which sampling density impacts the extent of HIV clustering and, in one context, found a minimal level of sampling density necessary for assessment of HIV-1C V1C5 clustering.
Sampling density below 10% was associated with quite variable HIV-1 V1C5 clustering accompanied by broad confidence intervals indicating high variance among replicates. At a level of sampling density around 1%, the proportion of HIV-1C V1C5 sequences in clusters fluctuated from 0% to more than 50%, suggesting a substantial impact of chance (of sample selection) on HIV clustering. Obviously, the results of HIV clustering at low sampling density are not reliable. This finding suggests that studies using sampling densities below 10% in contexts similar to ours do not provide adequate power to assess HIV-1C V1C5 clustering and could produce misleading results.
Increasing sampling densities at values over 10% were associated with increasing proportions of HIV-1C V1C5 sequences in clusters. The association appeared to be fairly linear up to the analyzed level of 70% sampling density. Higher sampling densities are associated with narrower confidence intervals and apparently more accurate clustering results, reflecting the increasing amount of information available for such analyses. This observation provides a rationale for targeting high sampling density in HIV transmission studies and favoring fewer communities with high sampling density over a larger number of communities with low sampling density—recognizing that such a design does not permit generalization to other communities.
The current analysis is based on genotyping of the HIV-1C env gp120 V1C5 region. However, it is likely that HIV clustering might be affected by the targeted HIV-1 gene(s) and/or the length of viral sequences used for genotyping, which warrants further studies.
The origin of sampling was closely associated with sampling density and has a similar impact on the extent of HIV clustering. A concentrated sampling from a local epidemic produces different patterns of HIV clustering than scattered sampling across a global epidemic. This is not surprising as even the thousands of HIV-1C V1C5 sequences used in simulation analysis in this study correspond to a very low sampling density in the global HIV-1C epidemic. For example, the largest country-specific set retrieved from the LANL HIV Database was 778 HIV-1C V1C5 sequences from South Africa, which corresponds to 0.013% sampling density based on UNAIDS estimates of 6,100,000 HIV infections in South Africa. 44,45 However averaging across the country estimates might make little sense because viral sequences deposited to the LANL HIV Database are likely sampled by a limited number of studies within selected geographic areas, and it might not be possible to infer accurate sampling density for deposited sequences retrospectively.
Time of sampling seems to be another critical factor affecting the detectability of HIV clusters. Due to the intrahost evolution of HIV-1, a short time of sampling might be considered ideal. However, the sampling time in most molecular epidemiological studies with cross-sectional sampling remains unknown because the time of HIV infection is rarely available. Development of methods for the estimation and adjustment for sampling time could improve HIV cluster analysis in future studies.
Thresholds of pairwise distances and bootstrap support of nodes have similarly predictable impacts on the extent of HIV-1 V1C5 clustering. Many previous studies utilized available viral sequences of pol generated as a part of routine clinical care and monitoring of HIV-associated drug resistance. Due to low diversity in HIV-1 pol, the thresholds for HIV cluster analysis were established in the range between 1% and 4.5%. 1,5,7 –9,13,14,46 –48 However, the V1C5 region used in this study is substantially more diverse than pol. Thus, it seemed important to estimate the reasonable threshold of the V1C5 region for HIV cluster analysis. Results of our simulation studies suggest that for the V1C5 region, a 10% cut-off of pairwise distances might be a useful threshold for analysis of HIV clustering. Tightening this threshold results in a fast elimination of viral sequences from clusters due to high diversity of the HIV-1 env gene, particularly the V1C5 region. It is likely that the V1C5 threshold is associated with stages of HIV infection, and if so, it needs to be estimated for recent infections in future studies with appropriate sampling.
The node support distribution suggests that the bootstrap support increases with expanding sampling density. The profiles of node bootstrap distribution across different sampling densities provided additional evidence that 10% sampling density is the minimal threshold for analysis of HIV-1 V1C5 clustering. The most upright boxplots (or histogram bins for sampling densities 60% and 70%) in Fig. 4 highlight bootstrap support of 1.0. The gradual steady increase of the strongest bootstrap support along increased sampling density might explain the higher extent of HIV clustering at increased sampling densities.
In summary, sampling density has a direct and substantial impact on HIV-1C V1C5 clustering. The results of simulation studies in this study suggest that the minimal level of sampling density for HIV-1C V1C5 clusters analysis should be above 10%, although this threshold could differ by sampling origin and/or targeted region of HIV-1 genome. The extent of sampling density may help in choosing an optimal method of HIV cluster analysis. Thus, a local sampling with density ≥10% should allow HIV-1C V1C5 cluster analysis using phylogenetic inference. In contrast, using pairwise distance thresholds might be more appropriate for global scattered sampling with low sampling density.
Footnotes
Acknowledgments
We are grateful to participants of the Mochudi Prevention Project in Botswana. We thank Lendsey Melton for excellent editorial assistance. The Mochudi Prevention Project in Botswana was supported and funded by NIH Grant R01 AI083036, An HIV Prevention Program for Mochudi, Botswana. VDG was supported in part by NIH grant R37 AI051164, Methods to Advance the HIV Prevention Research Agenda.
Author Disclosure Statement
No competing financial interests exist.
References
Supplementary Material
Please find the following supplemental material available below.
For Open Access articles published under a Creative Commons License, all supplemental material carries the same license as the article it is associated with.
For non-Open Access articles published, all supplemental material carries a non-exclusive license, and permission requests for re-use of supplemental material or any part of supplemental material shall be sent directly to the copyright owner as specified in the copyright notice associated with the article.
