
Abstract
To improve the methodology of HIV cluster analysis, we addressed how analysis of HIV clustering is associated with parameters that can affect the outcome of viral clustering. The extent of HIV clustering and tree certainty was compared between 401 HIV-1C near full-length genome sequences and subgenomic regions retrieved from the LANL HIV Database. Sliding window analysis was based on 99 windows of 1,000 bp and 45 windows of 2,000 bp. Potential associations between the extent of HIV clustering and sequence length and the number of variable and informative sites were evaluated. The near full-length genome HIV sequences showed the highest extent of HIV clustering and the highest tree certainty. At the bootstrap threshold of 0.80 in maximum likelihood (ML) analysis, 58.9% of near full-length HIV-1C sequences but only 15.5% of partial pol sequences (ViroSeq) were found in clusters. Among HIV-1 structural genes, pol showed the highest extent of clustering (38.9% at a bootstrap threshold of 0.80), although it was significantly lower than in the near full-length genome sequences. The extent of HIV clustering was significantly higher for sliding windows of 2,000 bp than 1,000 bp. We found a strong association between the sequence length and proportion of HIV sequences in clusters, and a moderate association between the number of variable and informative sites and the proportion of HIV sequences in clusters. In HIV cluster analysis, the extent of detectable HIV clustering is directly associated with the length of viral sequences used, as well as the number of variable and informative sites. Near full-length genome sequences could provide the most informative HIV cluster analysis. Selected subgenomic regions with a high extent of HIV clustering and high tree certainty could also be considered as a second choice.
Introduction
A
It seems likely that the size, complexity, and number of variable or informative sites in the multiple sequence alignment are important factors that impact the extent of HIV clustering. The nature of this effect could help inform the choice of design in studies employing HIV cluster analysis. It could also help in making choices regarding how subjects are sampled, requirements for laboratory facilities, duration of studies, and budget.
The contribution of different regions across the HIV-1 genome to the reconstruction of viral phylogeny has been addressed previously. Leitner et al. highlighted the importance of the choice of the HIV-1 gene fragment for reconstruction of true phylogeny, and showed that combining data on gag p17 and env V3 performed better than data on either p17 or V3 evaluated separately. 21 The HIV-1 pol gene has been used for phylogenetic reconstruction of transmission events 22 and for HIV cluster analysis over the past decade. 3 –7,9,11 –13,15,19,20,23 –32 Other HIV-1 genes have also been used for linkage analysis in discordant couples. 33,34 A weaker clustering of subgenomic regions, as compared with the near full-length genome sequences, was demonstrated for HIV-1C from Ethiopia, 35 although the set of viral sequences analyzed was relatively small.
The majority of studies cited above were performed in HIV-1 subtype B settings among men having sex with men (MSM). Most of the studies utilized partial HIV-1 pol sequences generated as a part of routine clinical care. However, little is known about clustering patterns of HIV-1 non-B subtypes in predominantly heterosexual epidemics, such as the HIV-1 subtype C epidemic in southern Africa.
In this study we address (1) the HIV clustering in structural viral genes, subgenomic regions, and near full-length genomes of HIV-1C; (2) the HIV clustering within sliding windows across the HIV-1C genome; and (3) potential associations between the extent of HIV clustering and sequence length. HIV clusters were identified by the bootstrapped maximum likelihood method at bootstrap thresholds from 0.7 to 1.0, as a statistical support for clustering.
Tree certainty, a novel measure for quantification of incongruence of phylogenetic signal, is defined as the sum of internode certainties. 36 The internode certainty measures the level of support for a given internode by considering its frequency in a given set of trees jointly with the most prevalent conflicting bipartition in the same set of trees. 36 Internode certainty values near zero indicate the presence of an almost equally supported bipartition that conflicts with the inferred internode, whereas values close to one indicate the absence of conflict. 36,37
Materials and Methods
HIV-1C near full-length genome sequences
A set of 401 HIV-1C nonrecombinant near full-length genome sequences spanning the region that corresponds to HXB2 nt positions 790 (the first codon of gag) to 9,611 (−21 nt at the end of the R region in 3′-LTR) was retrieved from the LANL HIV Database (
Analyzed subgenomic regions of the HIV-1C genome
The extent of HIV clustering using near full-length genome sequences was compared with the subgenomic regions spanning the three structural HIV-1C genes, gag, pol, and env, and several alternative subgenomic regions that have been used or proposed for HIV cluster analysis. These subgenomic regions included (1) a partial pol sequence spanning the region encoding HIV-1 protease and the first 335 amino acids of reverse transcriptase, which corresponds to the sequence produced by ViroSeq, 38 –41 nt positions 2,253–3,554; (2) partial env sequences spanning the region encoding the gp120 V1C5 region, 42 –44 nt positions 6,570–7,757; (3) “product 2” spanning the 3′-end of gag and almost the entire pol, 45 nt positions 1,486–5,058; and (4) “product 4” spanning vpu, env, nef, and TATA-box in the U3 region of 3′-LTR, 45 nt positions 5,967–9,517. In addition, combinations of the targeted subregions included gag+pol, gag+env, pol+env, gag+pol+env, and product 2+product 4. All but one of the multiple sequence alignments were trimmed from the LANL nt-based alignment. The V1C5 codon-based alignment was generated as described elsewhere 42 using muscle 46 in MEGA6. 47
Sliding window analysis
Sliding window analysis is a commonly used method for studying the properties of molecular sequences. 48 To estimate the extent of clustering across the HIV-1 genome, a sliding window analysis with windows advancing incrementally across the multiple sequence alignment (a window of a certain length slid along the sequence alignment) was employed. Two sizes of sliding window were used, 1,000 bp and 2,000 bp. Sliding steps were equal to 1/10 of the window size—100 bp for the 1,000-bp window, and 200 bp for the 2,000-bp window—and produced multiple sets of overlapping multiple sequence alignments. The sizes of the 1,000-bp and 2,000-bp sliding windows were chosen as a starting point to assess changes in HIV clustering patterns across the HIV-1 genome. Note that alternative sizes of sliding windows and/or sliding steps could also be used. A total of 99 alignment sets of 1,000 bp each, and 45 alignment sets of 2,000 bp each, were generated. The extent of HIV clustering was estimated for each window using the same phylogenetic inference (maximum likelihood) that was applied to the near full-length genome sequences and subgenomic regions.
Pairwise distances
Pairwise distances in multiple sequence alignments were computed using the Maximum Composite Likelihood model 49 in MEGA6. 47 To address the effects of gaps and missing data, two distance matrixes were generated: (1) with all positions containing gaps eliminated (complete deletion of gaps), and (2) with all ambiguous positions in each sequence pair removed (pairwise deletion of gaps).
Variable and informative sites
The numbers of variable and informative sites in each multiple sequence alignment were enumerated in MEGA6. 47 Sites with missing/ambiguous data and gaps were included in the analysis. The estimated numbers were used for comparison across HIV-1 regions and in association analysis.
Character state changes
The number of character states in the identified informative sites was computed, according to Wortley and Scotland, 50 as the minimum number of parsimony-informative character-state changes, Δmin. The Δmin parameter was calculated for each character across informative sites as one fewer than the number of states that are present in two or more taxa. 50 The estimated numbers of character states were used for comparison across HIV-1 regions.
Phylogenetic inference
The maximum likelihood tree inference was implemented in RAxML
51,52
under the GAMMA model of rate heterogeneity. The statistical support for each node was assessed by bootstrap analysis from 100 bootstrap replicates performed with the rapid bootstrap algorithm implemented in RAxML.
51
The RAxML runs were performed using RAxML ver.7.7.5 at the high-performance computing cluster Odyssey (
Estimation of tree certainty
Tree certainty quantifies the degree of conflict or incongruence in a set of phylogenetic trees. 36 The quantification of incongruence is based on Shannon's entropy. 53 The internode certainty was measured by quantifying the degree of certainty for each individual internode by considering the two most prevalent conflicting bipartitions and calculating the log magnitude of their difference. An internode certainty close to 1 indicates high certainty of the targeted tree node and a lack of conflict in the data, while values of internode certainty close to 0 show a high degree of incongruence. For example, if the most prevalent bipartition is supported by 95% of the data and the next most prevalent conflicting bipartition is supported by the remaining 5%, then the value of the internode certainty is approximately 0.71, whereas if the two most prevalent conflicting bipartitions have the same frequency of support, then the internode certainty is zero. 37 Tree certainty quantifies the degree of conflict for the whole tree, and is the sum of internode certainty over all internodes in a phylogeny. 37 Tree certainty scores were calculated in RAxML ver. 8.0.052 as described by Salichos et al. 37 Extended majority-rule consensus trees were computed using bootstrapped trees generated by RAxML for each set of HIV-1C sequences analyzed.
Statistical analysis
The HIV sequences in clusters were enumerated with PhyloPart v.2 54 using bootstrap thresholds 0.7, 0.8, 0.9, and 1.0. All confidence intervals (CI) of estimated proportions are asymptotic 95% binomial confidence intervals (95% CI) computed with the prop.test function in R version 3.0.1. 55 Comparison between proportions of viral sequences in clusters was performed by McNemar's test in R, and p-values less than 1.0E-04 were considered statistically significant. The association between paired samples was tested by estimating Pearson's product-moment correlation coefficient using the cor.test function in R. For association analysis between sequence length and proportion of HIV sequences in clusters, we used loess regression with the default stat_smooth parameters to smooth the curve. We note that the assumption of independence of observations that underlies these tests is not strictly met. However, the correlation among observations is expected to be low. 56 We validated this belief by comparing binomial and bootstrap confidence intervals in representative cases.
For association analysis between the number of variable and informative sites and the proportion of HIV sequences in clusters, we used linear regression without smoothing. The bootstrapped maximum likelihood analysis was performed using multiple sequence alignments of near full-length genome, gag, pol, and env sequences, and 100 replicates. Viral sequence replicates were generated by seqboot from the PHYLIP package ver. 3.695. 57,58 We found confidence intervals to be nearly identical. Sliding windows across the HIV-1C genome were generated in R using spider. 59 All plots were produced in R using ggplot2. 60 All figures were finalized in Adobe Illustrator CS6.
Results
Definition of HIV cluster
We define the HIV cluster as a viral lineage that gives rise to a monophyletic subtree of the overall phylogeny with strong statistical support. We use the bootstrapped maximum likelihood method 61 –63 to determine the statistical support of clusters. Four levels of bootstrap threshold for identification of HIV clusters were estimated in this study: ≥0.7, ≥0.8, ≥0.9, and 1.0. A viral lineage (group, subtree) with at least two viral sequences and strong statistical support is considered to be an HIV cluster. Clusters were identified using a depth-first algorithm, 54,64 a method for traversing or searching tree or graph data structures starting from the root. This approach allowed us to avoid double-counting of viral sequences and clusters in any cases in which clusters had internal structure with strong support.
Extent of HIV clustering across the HIV-1C genome
We addressed whether the extent of HIV clustering is associated with any particular HIV-1 gene or gene subregion. The proportion of clustered sequences was compared between near full-length genome HIV-1C sequences and subgenomic regions (Fig. 1). Three structural HIV-1C genes, gag, pol, and env, and two regions commonly used in HIV cluster analysis, gp120 V1C5 and partial pol spanning the region that encodes PR and the first 335 amino acids of RT (ViroSeq), were targeted. For the V1C5 region, two multiple sequence alignments, nt and codon based, were assessed. All sets of sequences included the same 401 HIV-1C sequences. The proportion of HIV sequences in clusters was estimated at the bootstrap thresholds for cluster definition from 0.7 to 1.0 under maximum likelihood inference.
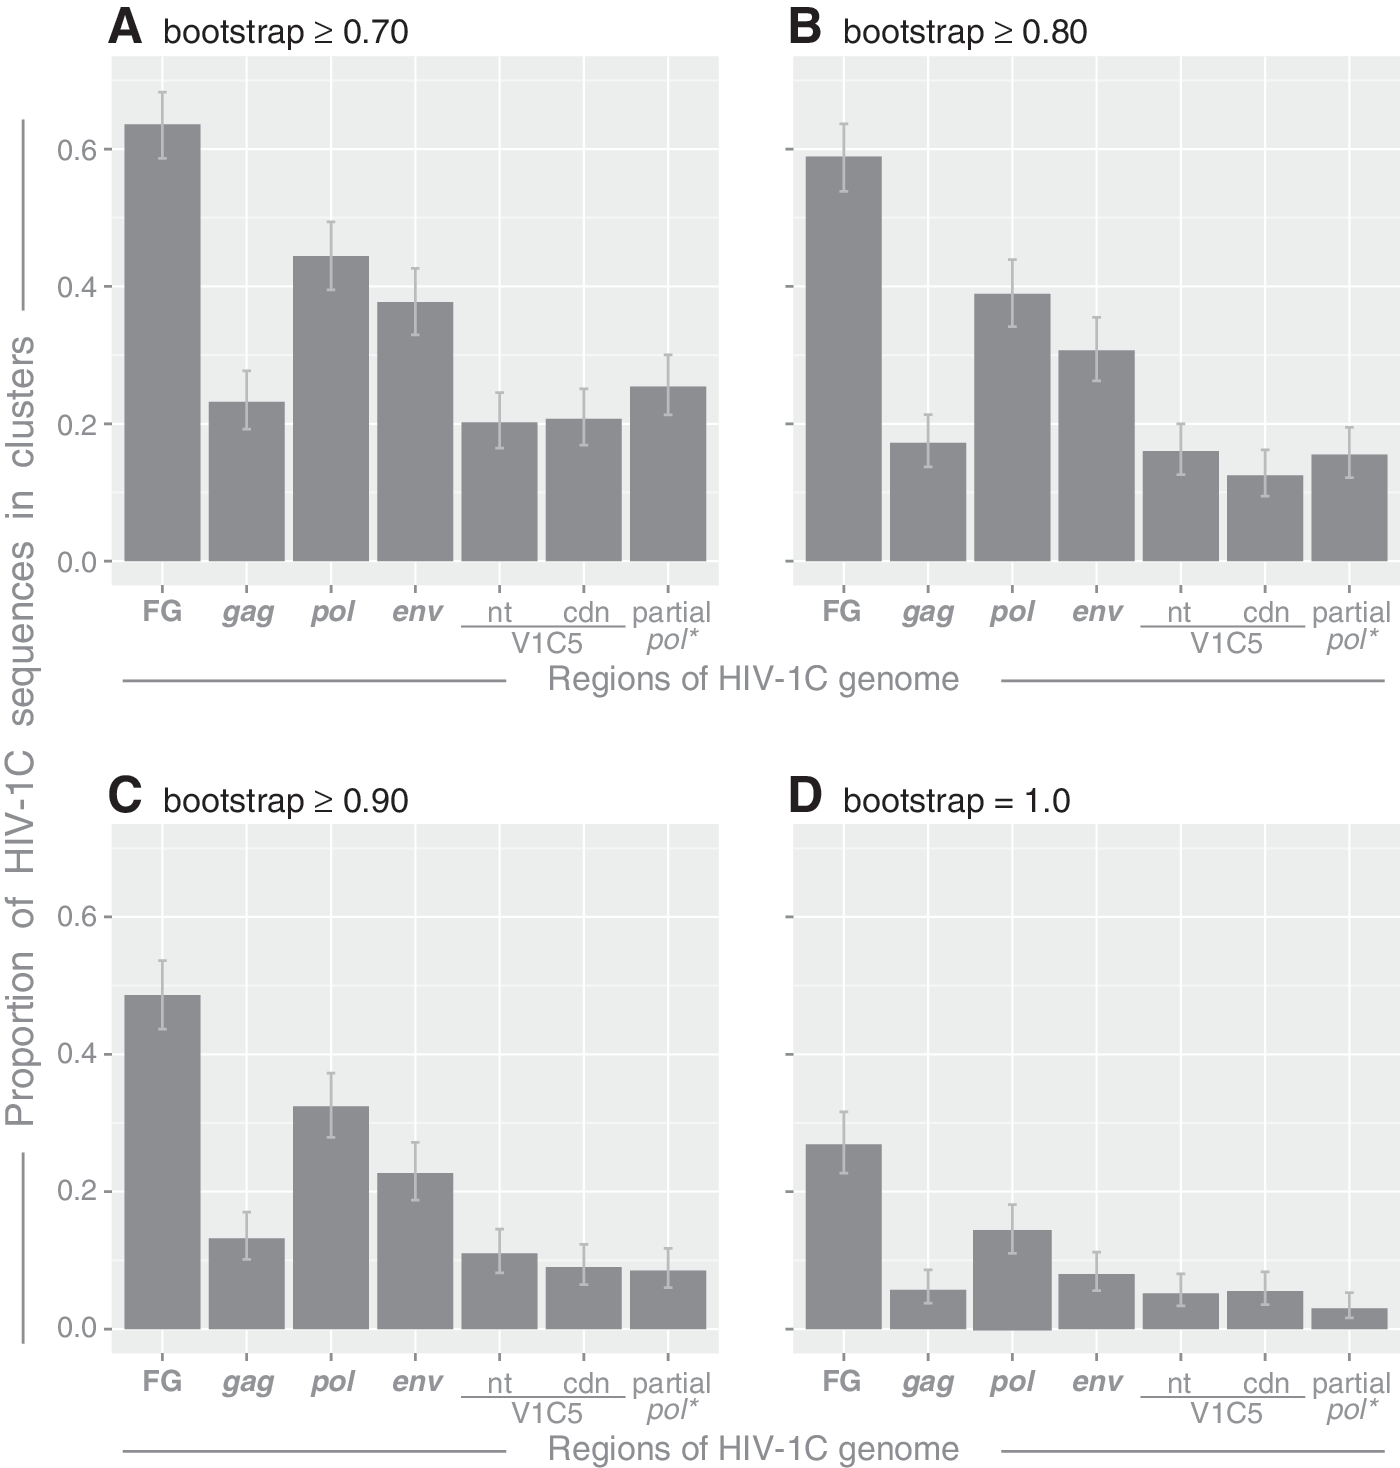
The extent of HIV clustering. The proportion of HIV-1C sequences in clusters was estimated in the bootstrapped maximum likelihood (ML) analysis implemented in RAxML with 100 replicates. Axis y shows the proportion of HIV-1C sequences in clusters. Axis x shows targeted regions across the HIV-1C genome: near full-length genome sequences (FG), gag sequences, pol sequences, env sequences, nt-based alignment of the V1C5 region, codon-based alignment of the V1C5 region, and partial pol sequences corresponding to the region targeted by the ViroSeq system.
The highest proportion of HIV sequences in clusters was observed for near full-length genome HIV-1C sequences. The proportion ranged from 26.9% (95% CI 22.7% to 31.6%) at the most stringent bootstrap threshold of 1.0 (Fig. 1D) to 63.6% (95% CI 58.6% to 68.3%) at the most relaxed bootstrap threshold of 0.7 (Fig. 1A). Among the three structural HIV-1C genes, the highest proportion of HIV sequences in clusters was found in pol following by env and gag. For example, at the bootstrap threshold of 0.80 (Fig. 1B), 38.9% of pol sequences, 30.7% of env sequences, and 17.2% of gag sequences were found in clusters, while the proportion of viral sequences in clusters in the set of near full-length genome HIV-1C sequences was 58.9% (95% CI 53.8% to 63.7%). The difference in proportions of clustered sequences between the set of near full-length HIV-1C sequences and any of the three structural genes was statistically significant at all targeted bootstrap thresholds (all p-values from <0.0001, McNemar's test).
The extent of HIV clustering was statistically higher in HIV-1C pol sequences than in gag sequences at any bootstrap threshold used (all p-values<0.0001, McNemar's test). The proportion of HIV-1C pol sequences in clusters was larger than env sequences at a bootstrap threshold 0.9 (p-value <0.0001; McNemar's test), but did not reach significance of 1.0E-04 at other bootstrap thresholds (p=0.003 at 0.7, p=0.00018 at 0.8, and p=0.00012 at 1.0 bootstrap threshold). A larger proportion of the HIV-1C env sequences than gag sequences was found in clusters at bootstrap thresholds from 0.7 to 0.9 (p-values<0.0001 McNemar's test), but the difference was not statistically significant at the threshold of 1.0 (p-value 0.095).
The proportions of HIV V1C5 and partial pol sequences (ViroSeq) in clusters were at the level of gag sequences. The differences between gag and either V1C5 or partial pol sequences were nonsignificant for all comparisons based on McNemar's test and a significance threshold of 1.0E-04. Similarly, no difference in the proportions of HIV sequences in clusters was found between V1C5 and partial pol sequences, or between nt- and codon-based alignments of V1C5 sequences.
To assess the stability of HIV clusters we investigated clustering of near full-length genome sequences (FG) and genomic subregions—gag, pol, env, V1C5 region (nt and codon aligned), and ViroSeq—at four bootstrap thresholds, 0.7, 0.8, 0.9, and 1.0 (Supplementary Fig. S1). The analyzed subset included 236 of 401 near full-length HIV-1C sequences that were found in clusters in maximum likelihood analysis with a bootstrap threshold of ≥0.70. The comparison revealed substantial heterogeneity in HIV clustering based on (1) bootstrap threshold, (2) targeted region of the HIV-1 genome, and (3) sampling. While some sequences were found in clusters across all analyzed regions (filled blocks), other sequences cluster in few or no subgenomic regions (blank blocks). For example, sequences from India formed clusters in FG, pol, and env, and at low bootstrap thresholds in ViroSeq regions, but did not cluster in gag or V1C5. Interestingly, a comparison of clustering profiles between FG and ViroSeq illustrates that a substantial number of viral sequences clustered in FG would be found outside of clusters based on analysis of the ViroSeq, a region widely used in analysis of HIV clusters.
Hierarchy of tree certainty
The degree of conflict or incongruence in the inferred trees was quantified by measuring tree certainty. 36,37 The comparative tree certainty is presented in Fig. 2A. Overall, the profile of tree certainty data resembled the hierarchy of HIV clustering in Fig. 1. The tree based on near full-length genome sequences showed the highest tree certainty. The pol tree had the highest certainty among three structural HIV-1 genes, while the gag-based tree had the lowest certainty. The partial pol tree and V1C5-based trees showed relatively low tree certainty at the levels comparable with the gag tree certainty. The partial pol tree certainty was a little higher than the V1C5 trees certainty.

Tree certainty, variable and informative sites, and character states. Axis x shows targeted regions across the HIV-1C genome.
Variable and informative sites and character state changes
The profiles of variable sites (Fig. 2B), informative sites (Fig. 2C), and character states (Fig. 2D) across analyzed regions of HIV-1C resembled the proportions of viral sequences in clusters presented in Fig. 1 and the profile of tree certainty in Fig. 2A. The near full-length genome sequences showed the highest levels of variable and informative sites, and the highest number of character state changes.
Cluster size distribution
The sizes of identified clusters varied from 2 to 20 sequences per cluster. The majority of viral sequences were within small clusters. The number of clusters with 10+members was small, and decreased gradually with increasing stringency of the bootstrap threshold from 0.7 to 1.0. The cluster size distribution was similar between full-length genome HIV-1C sequences and analyzed subgenomic regions (Fig. 3). As was shown previously, 7,19,42 the degree distribution inferred from cluster size data can be approximated by a power law. 65 As shown in Fig. 3 (numbers in the upper right corner of each graph), the number of identified clusters and the number of viral sequences in clusters decreased gradually with tightening bootstrap support from 0.7 to 1.0.
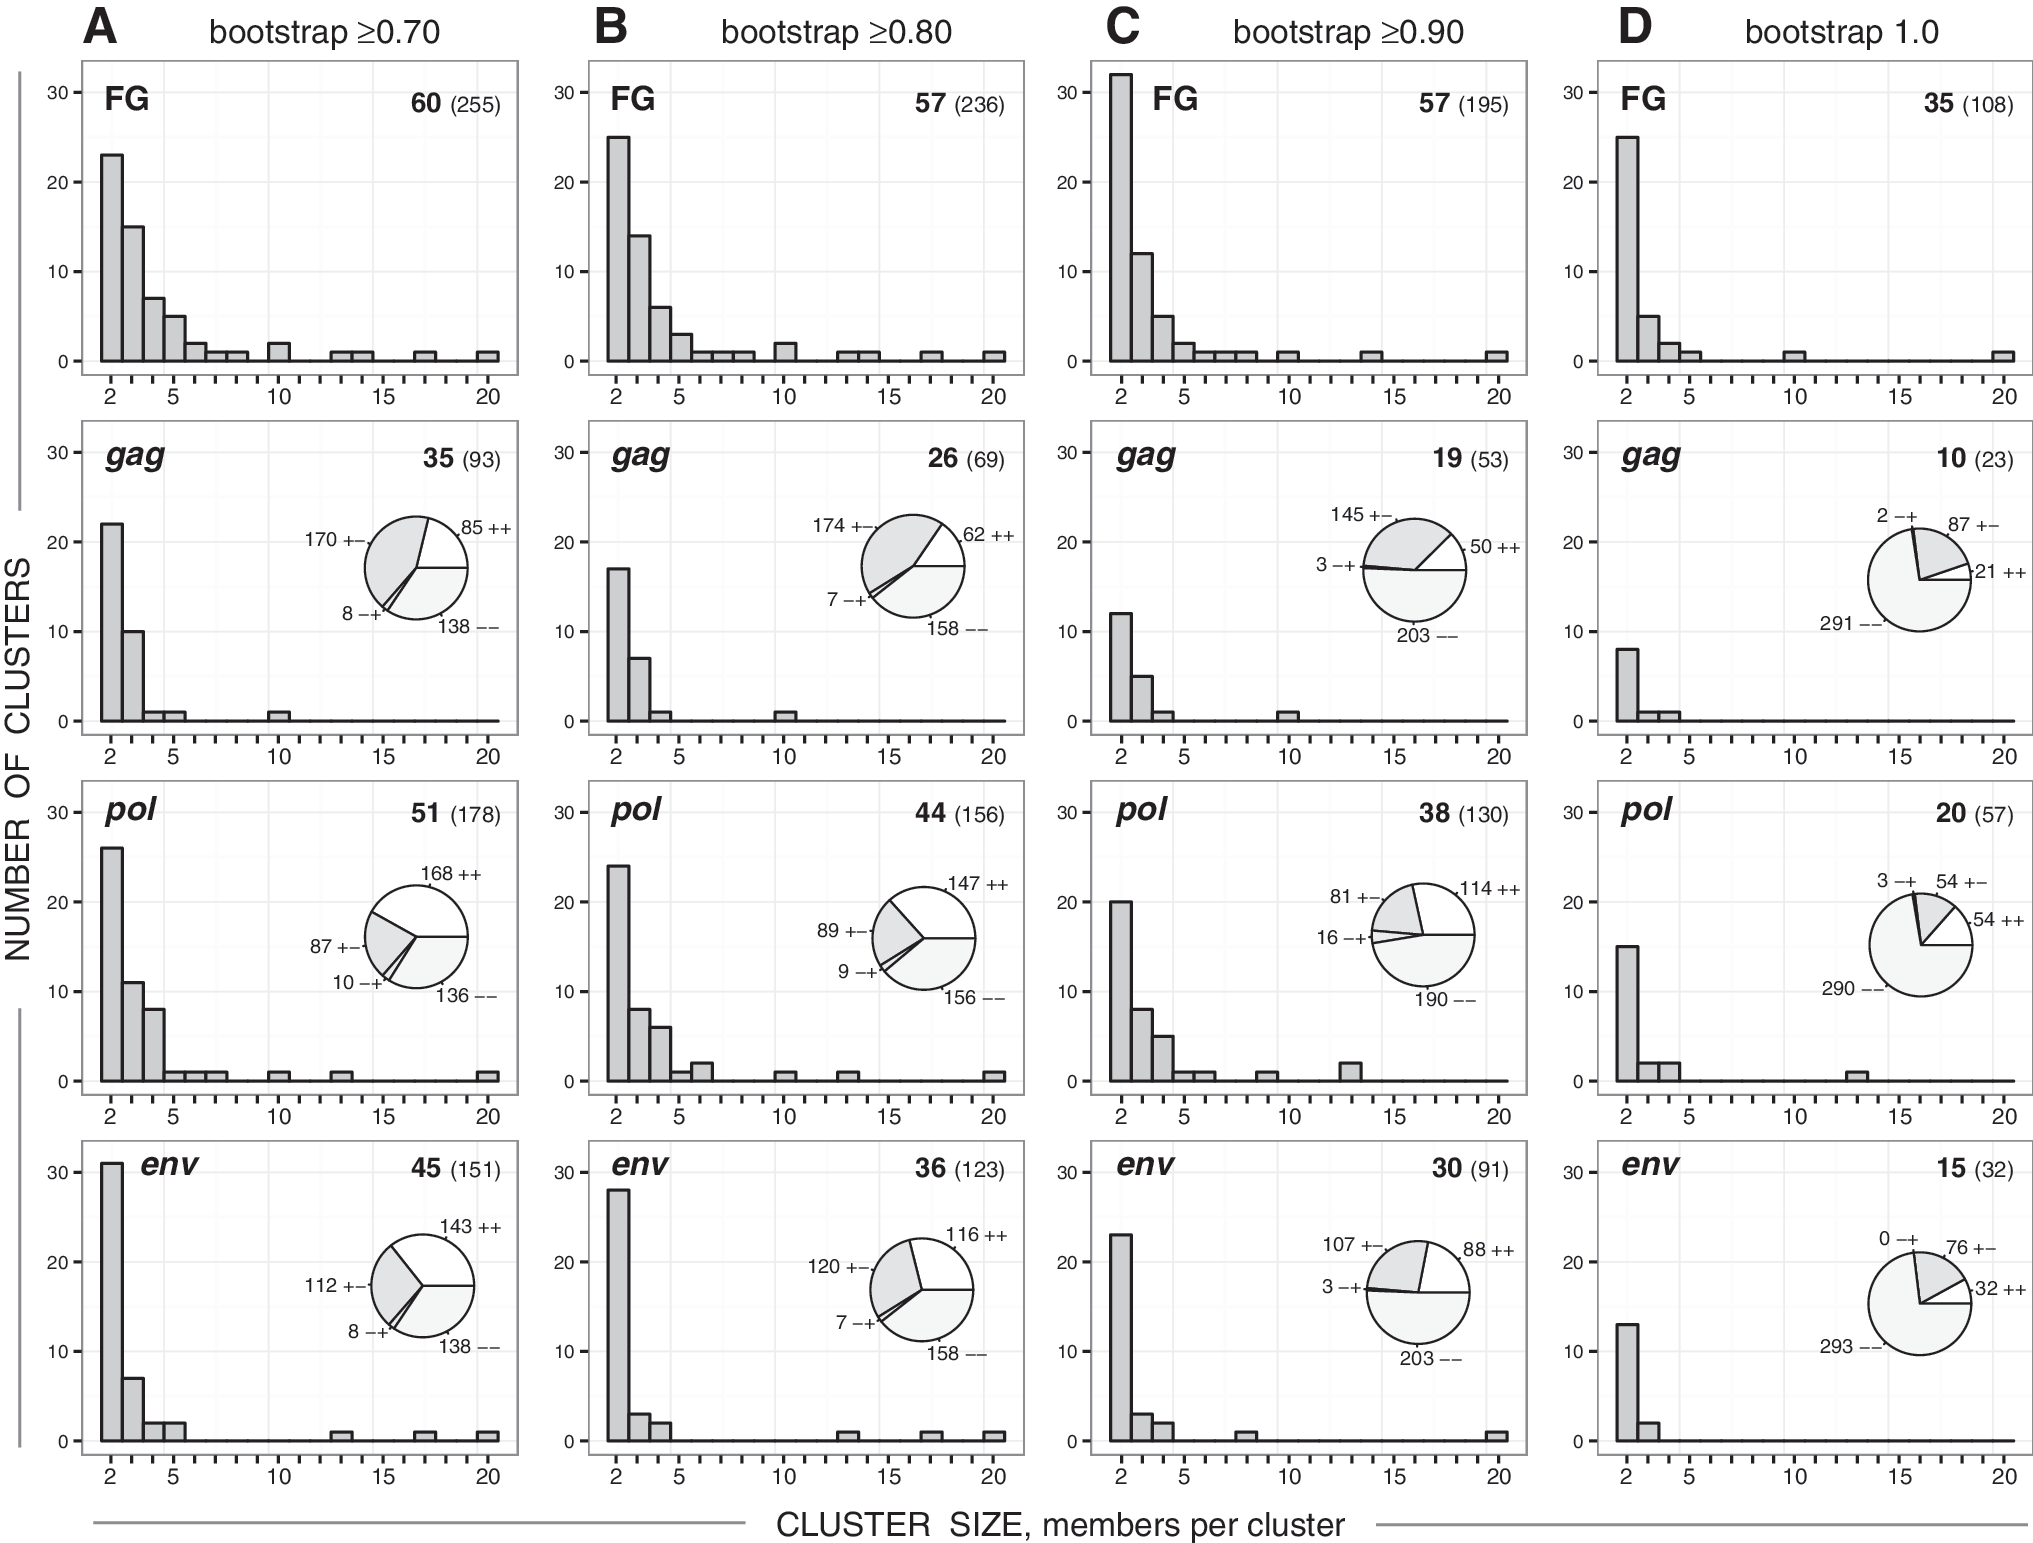
Cluster size distribution in the near full-length HIV-1C genome sequences (FG), gag, pol, and env. Histograms in each graph show the number of clusters (axis y) of specified cluster size (axis x). Numbers in the upper right corner of each graph indicate the number of identified clusters (shown in bold) and the number of viral sequences in clusters (shown in brackets). Pie charts within gag, pol, and env graphs show concordant (++ and −−) or discordant (+− and −+) clustering between near full-length genome (FG) clustering and the corresponding subgenomic region. Column
To investigate the stability of clusters, we compared whether sequences that clustered in the near full-length genome analysis also clustered in the subgenomic regions. The pie charts within the gag, pol, and env graphs in Fig. 3 show the number of viral sequences that (1) clustered in both the full-length genome and the subgenomic region (++ ), (2) clustered in the full-length genome but not in the subgenomic region (+−), (3) did not cluster in the full-length genome but did cluster in the subgenomic region (−+), and (4) clustered in neither the full-length genome nor the subgenomic region (−−). Concordant clustering (++ or −−) was more pronounced for pol and env, while discordant clustering (+− or −+) was more common for gag.
Sliding widow analysis
To assess the extent of HIV clustering across the HIV-1 genome, sliding window analysis was performed with window size of 1,000 bp and 2,000 bp, and sliding steps of 100 bp and 200 bp, respectively. This analysis allowed us to investigate how patterns of HIV clustering change across the HIV-1 genome.
The profile of HIV clustering across the HIV-1 genome was “wave shaped” (Fig. 4) suggesting a differential contribution of regions across the HIV genome to clustering. The highest extent of HIV clustering was associated with the region encoding the HIV-1 reverse transcriptase. Intermediate extents of HIV clustering were observed for regions encoding HIV-1 protease, integrase, vif/vpr/first exon of tat/first exon of rev/vpu, and gp41/nef. HIV-1C gag and gp120 showed the lowest extent of HIV clustering.
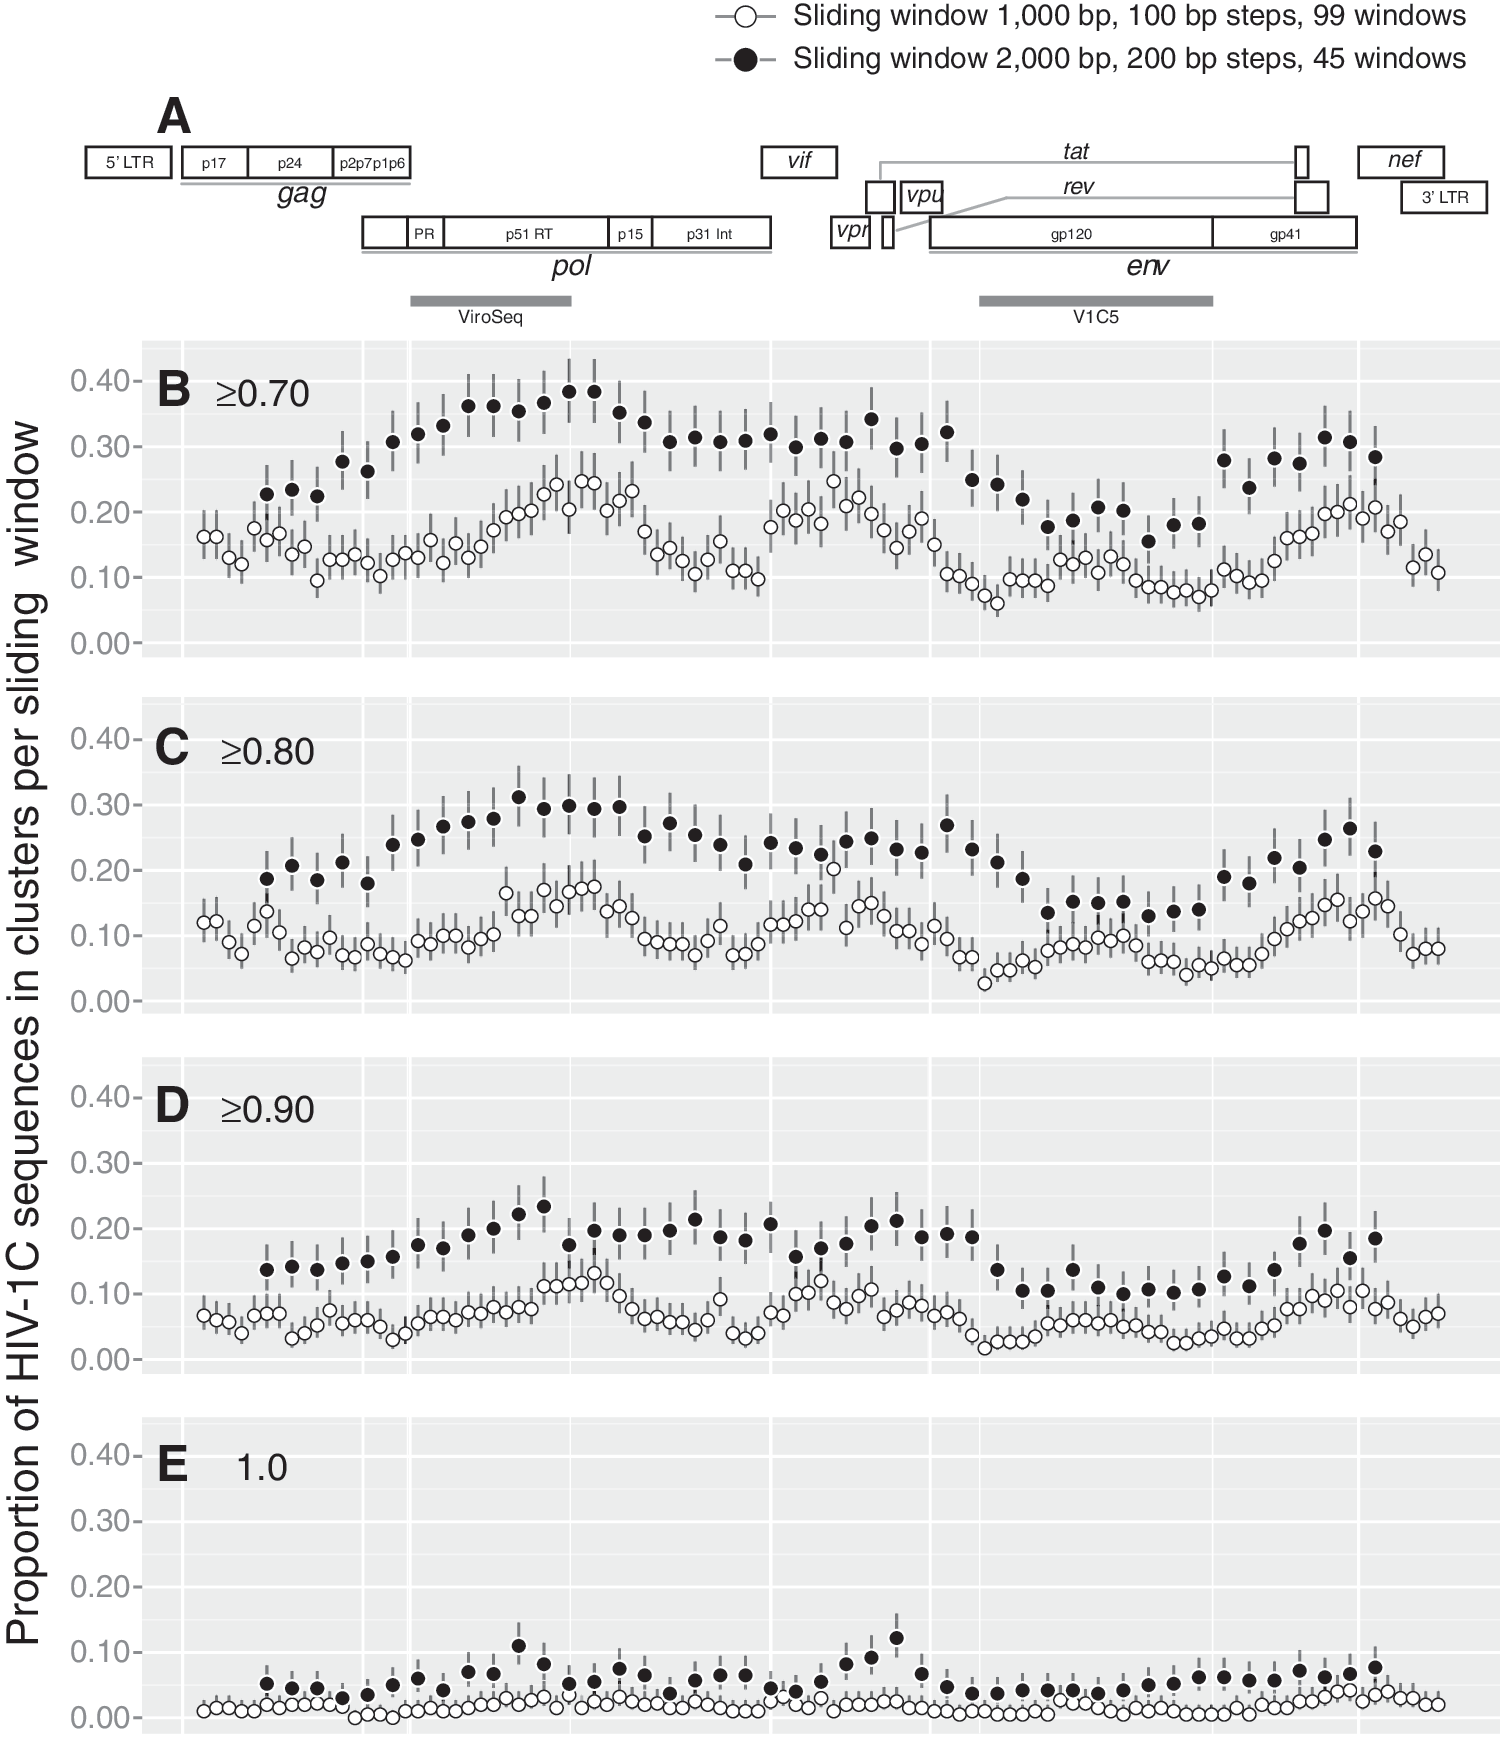
Sliding window analysis across the HIV-1C genome.
The size of the sliding window has a substantial effect on the extent of HIV clustering. Longer viral sequences with window size 2,000 bp were associated with higher extents of HIV clustering than sequences with window size 1,000 bp across the entire HIV genome (Fig. 4). The ups and downs in the profiles of HIV clustering were similar between longer and shorter HIV windows.
As expected, the bootstrap thresholds for cluster definition affected the extent of HIV clustering across the entire HIV genome, as shown in Fig. 4B (bootstrap threshold of ≥0.7) through 4E (bootstrap threshold of 1.0). The difference of HIV clustering between longer and shorter sequences gradually decreased with tightening of the bootstrap threshold.
To address the composition stability of HIV clusters, we analyzed the consistency of clustering across 1,000-bp (Supplementary Fig. S2) and 2,000-bp (Supplementary Fig. S3) sliding windows at a bootstrap threshold of ≥0.80. Only a subset of 236 HIV-1C sequences found in clusters in maximum likelihood analysis with bootstrap support of ≥0.70 were included in this analysis. A side-by-side comparison of Supplementary Figs S2 and S3 highlights the point that HIV clustering is more intense with the larger sliding window of 2,000 bp. A deeper look into sliding windows across the viral genome reveals substantial heterogeneity in HIV clustering based on the subgenomic region and sampling. For example, two sequences from Spain (located between ET/IL and CN sequences) clustered within all sliding windows across the entire viral genome. Note that these sequences were obtained from a 53-year-old man and a 62-year-old woman from Spain, 66,67 and have 98.7% similarity between their pairwise distances in near full-length HIV-1C genome analysis.
In contrast, some other sequences were outside of clusters across all sliding windows. A subset of Indian sequences showed sporadic clustering across 1,000-bp windows, but demonstrated more consistent clustering in 2,000-bp windows over pol, vif, vpr, the first exon of tat, and the C1 region of gp120 followed by an abrupt stop of clustering across most of env. Analysis of potential reasons for such a differential clustering across the viral genome—such as searching for specific signatures associated with clustering—warrants dedicated future studies, and should be taken in the context of sampling.
Potential associations
The observed difference in the extent of HIV clustering between the two sliding windows, 1,000 bp and 2,000 bp, provided a rationale for taking a closer look at potential associations between the size of HIV sequences and the extent of HIV clustering. To assess these associations, we used viral sequences spanning subgenomic regions across HIV-1C genome, as described above in Materials and Methods, subsection “Analyzed subgenomic regions of HIV-1C genome”: gag, pol, env, partial pol (ViroSeq), V1C5, product 2 (3,573 bp; spans partial gag at the 3′-end and the entire pol; HXB2 nt positions 1,486–5,058), 45 product 4 (3,558 bp; spans vpu, env, nef, and TATA-box in the U3 region of 3′-LTR; HXB2 nt positions 5,967–9,517), 45 and combination of these subregions (a combination of products 2 and 4 spans about 80% of the unique full length HIV-1 genome sequence).
We found a strong positive association between the sequence length and the extent of HIV clustering (Fig. 5). Correlation coefficients above 0.9 for all tested bootstrap thresholds were accompanied by statistically significant p-values from 2.3E-07 to 9.6E-06. The estimated 95% CIs for correlation coefficients were relatively tight across all bootstrap thresholds used in this analysis. Similarly positive associations were found between the extent of HIV clustering and parameters related to the sequence length, such as the number of variable sites (correlation coefficients from 0.90 to 0.93) and the number of informative sites (correlation coefficients from 0.89 to 0.93).

Sequence size and HIV clustering. Results of correlation analysis between the extent of HIV clustering and sequence length are shown. Axis y shows the proportion of HIV-1C sequences in clusters. Axis x shows the sequence length.
We addressed whether parameters related to sequence length, such as the number of variable and informative sites, are associated with the proportion of HIV sequences in clusters. We computed the number of variable and informative sites in 99 alignments (401 HIV-1C sequences and 1,000 bp each alignment) that were generated in sliding window analysis. We found a moderate positive correlation between the number of variable (Fig. 6A–D) and informative (Fig. 6E–H) sites and the proportion of HIV sequences in clusters. Correlation coefficients between 0.40 and 0.43 for the number of variable sites, and between 0.27 and 0.39 for informative sites, were accompanied by statistically significant p-values below 0.01 for all analyzed bootstrap thresholds. However, 95% CIs for correlation coefficients were relatively broad, which was more evident at less stringent bootstrap thresholds.

The number of variable and informative sites and HIV clustering. Results of correlation analysis between the extent of HIV clustering and the number of variable and informative sites are presented. Axis y shows the proportion of HIV-1C sequences in clusters.
The distribution of gaps in the multiple sequence alignment was not uniform. Therefore, to address whether gaps affect the observed extent of HIV clustering, we used two types of gaps deletion, pairwise and complete deletion. Under the pairwise deletion of gaps, distances were computed for each pair of sequences, ignoring only gaps that were involved in this comparison. Under the complete deletion of gaps, all sites with gaps were excluded from the multiple sequence alignment. We found no significant associations between the observed extent of HIV clustering and pairwise distances within the analyzed subgenomic regions across the HIV-1C genome (Supplementary Fig. S4). Results of analysis with pairwise deletion of gaps (Supplementary Fig. S4A–D) were similar to results of analysis with complete deletion of gaps (Supplementary Fig. S4E–H), suggesting that gaps have little to no effect on the association (or lack of association) between the observed extent of HIV clustering and pairwise distances.
Discussion
The dynamics of HIV transmission networks can be investigated through comprehensive HIV cluster analysis. HIV cluster analysis can provide insights into the dynamics of HIV spread, and the results of HIV cluster analysis can help inform public health prevention interventions, such as an optimal balance of Treatment-as-Prevention and Pre-Exposure Prophylaxis strategies. The higher the extent of HIV clustering, the more informative HIV cluster analysis could be.
In this study we investigated whether the extent of HIV clustering is associated with the size/length of targeted HIV sequences, or the number of variable and informative sites, or with a particular subgenomic region across the HIV-1 genome. The extent of HIV clustering was compared between the near full-length genome and subgenomic regions.
The near full-length genome HIV sequences were associated with the highest extent of HIV clustering. For example, 58.9% of near full-length HIV-1C sequences were found in clusters at the bootstrap threshold of 0.80 in maximum likelihood analysis. For comparison, only 15.5% of partial pol sequences (ViroSeq) were in clusters at the same running conditions. As expected, the bootstrap threshold affected the extent of HIV clustering. However, a higher extent of HIV clustering of near full-length genome sequences compared to subgenomic regions associated with HIV-1 structural genes was evident at any analyzed bootstrap threshold; the level of clustering dropped from 63.6% at a bootstrap threshold of 0.7 to 26.9% at a bootstrap threshold of 1.0. Among HIV-1 structural genes, pol showed the highest extent of clustering.
The estimated tree certainty, a novel metric for degree of conflict or incongruence, in the inferred phylogenetic tree was also the highest in the set of near full-length genome sequences, followed by pol. Combined with the extent of HIV clustering, the tree certainty estimates provide additional evidence that near full-length genome HIV sequences are the most informative choice for HIV cluster analysis.
The sequence size, or length, used in HIV cluster analysis appeared to have a dramatic effect on the extent of HIV clustering. This was evident from the comparison of HIV clustering between two sliding windows, 1,000 bp and 2,000 bp long, which were run across the entire HIV-1 genome with 100 bp and 200 bp steps, respectively. Despite fluctuations across the HIV-1 genome, the extent of HIV clustering was significantly higher for larger sliding windows spanning similar regions in the HIV-1 genome. The sliding window analysis allowed us to identify regions across the HIV-1 genome with higher propensities for HIV clustering.
To assess potential associations between the extent of HIV clustering and sequence length, we employed concatenated sets of HIV-1C genes and subgenomic regions, and included several previously described regions 45 that can be used in HIV cluster analysis. We found strong associations between the sequence length and the proportion of HIV sequences in clusters, which was evident from high correlation coefficients between 0.92 and 0.96. The strong association pattern was replicated at different bootstrap thresholds for cluster definition, and with parameters related to sequence length, such as the number of variable sites, and the number of parsimony-informative sites in the multiple sequence alignment. Interestingly, the loess regression curve plateaued for the sequence length between about 3,000 bp and 6,000 bp for the bootstrap thresholds 0.7 to 0.9, but above 7,000 bp length for the 1.0 threshold (Fig. 5).
We also found a direct correlation between the number of variable and informative sites and the proportion of HIV sequences in clusters. This association was less pronounced than the association between sequence length and clustering, which was evident from correlation coefficients from 0.40 to 0.43 for variable sites and from 0.27 to 0.39 for informative sites (Fig. 6).
All 401 near full-length sequences used in this study were nonrecombinant HIV-1C, as this was the selection criterion from the LANL HIV Database. However, intrasubtype recombination in the analyzed sequences could not be ruled out without a special dedicated analysis, which warrants further studies. It has been suggested that intrasubtype recombination in HIV-1C could be extensive. 68 While we reported frequent intrasubtype recombination in intrapatient viral quasispecies, 69 reliable identification of recombination between patients infected with the same HIV-1 subtype is still challenging due to a lack of a straightforward and unambiguous methodology. Assuming that intrasubtype recombinants are identified with improved technology in future studies, the specifics and nature of intrasubtype recombination could either complicate or assist in the analysis of HIV clustering. For example, the analysis could be complicated due to overestimation of evolutionary rates and a skewed molecular clock. 70 –72 At the same time, if intrasubtype recombinants are involved in chains of viral transmission, the recombination footprints could be used as transmission signatures, and could help identify and trace the transmitting HIV lineages.
The results of the study are limited to the available set of 401 near full-length genome HIV-1C sequences retrieved from the LANL HIV Database. The sample size was relatively small; demographic and socioeconomic data, as well as stage of HIV infection at the time of sampling, were unavailable for most sequences, and representation of geographic areas was skewed toward one country, South Africa. Comparison with other HIV-1 subtypes is not currently feasible since, in the public domain, only HIV-1 subtypes B and C, and CRF01_AE, have decent representation of near full-length genomes, at least at the moment.
The current analysis is based on HIV-1C sequences collected from areas with a predominantly heterosexual mode of transmission. It is possible that patterns of HIV clustering might differ between modes of viral transmission and HIV-1 subtypes associated with particular modes of transmission. As we demonstrated recently, 73 sampling density is another critical factor affecting the extent of HIV clustering.
In summary, the results of this study provide evidence that the extent of HIV clustering is directly associated with the length of viral sequences used in cluster analysis. Thus, near full-length genome sequences could be considered the top choice for the most informative HIV cluster analysis. An alternative approach to HIV cluster analysis could be based on selected subgenomic regions with an elevated extent of HIV clustering and high tree certainty.
Footnotes
Acknowledgments
We are grateful to the LANL HIV Database for the collection of near full-length genome HIV-1 sequences and multiple sequence alignment. V.D.G. was supported in part by AI R37-51164 from the NIH. We thank Lendsey Melton for excellent editorial assistance. We thank the editor of AIDS Research and Human Retroviruses, Dr. Brian Foley, for thoughtful comments and suggestions.
Author Disclosure Statement
No competing financial interests exist.
References
Supplementary Material
Please find the following supplemental material available below.
For Open Access articles published under a Creative Commons License, all supplemental material carries the same license as the article it is associated with.
For non-Open Access articles published, all supplemental material carries a non-exclusive license, and permission requests for re-use of supplemental material or any part of supplemental material shall be sent directly to the copyright owner as specified in the copyright notice associated with the article.