




Abstract
Characterizing the impact of HIV transmission routes on viral genetic diversity can improve the understanding of the mechanisms of virus evolution and adaptation. HIV vertical transmission can occur in utero, during delivery, or while breastfeeding. The present study investigated the phylodynamics of the HIV-1 env gene in mother-to-child transmission by analyzing one chronically infected pair from Brazil and three acutely infected pairs from Zambia, with three to five time points. Sequences from 25 clones from each sample were obtained and aligned using Clustal X. ML trees were constructed in PhyML using the best evolutionary model. Bayesian analyses testing the relaxed and strict molecular clock were performed using BEAST and a Bayesian Skyline Plot (BSP) was construed. The genetic variability of previously described epitopes was investigated and compared between each individual time point and between mother and child sequences. The relaxed molecular clock was the best-fitted model for all datasets. The tree topologies did not show differentiation in the evolutionary dynamics of the virus circulating in the mother from the viral population in the child. In the BSP, the effective population size was more constant in time in the chronically infected patients while in the acute patients it was possible to detect bottlenecks. The genetic variability within viral epitopes recognized by the human immune system was considerably higher among the chronically infected pair in comparison with acutely infected pairs. These results contribute to a better understanding of HIV-1 evolutionary dynamics in mother-to-child transmission.
I
Studies in HIV evolutionary dynamics can contribute to an understanding of the mechanisms of viral fitness. Phylogenetic reconstructions can reveal the dynamics of the HIV evolutionary intrahost and interhost. The interhost analyses make it possible to infer the movement of HIV lineages between locations, to determine the course of transmission, and to estimate changes in the viral effective population size over time. The selective pressure of the immune response as well as viral replication rates influence the viral adaptation and dynamic, and can be evaluated by within-host analyses. 4,5 In this context, evolutionary pressure from the host immune response selects for HIV-1 mutations resulting in amino acid changes that allow the virus to evade cellular and humoral immune responses. Variable regions of the envelope (env) gene are the target of humoral and cellular immune responses and those patients with the strongest response will be able to control the viral infection for a longer period of time. The major consequence of this HIV escape mechanism is the great amount of nonsynonymous substitutions compared to synonymous substitutions (positive selective pressure) in the env gene, contributing to the great diversity of this region at different time points within a host. 6
Considering that the time and mechanism of transmission are known, it is possible to infer the HIV-1 evolutionary dynamics. In this study, we evaluated differences in the evolutionary dynamics of the HIV-1 env gene in vertical transmission by a comparative analysis of HIV-1 subtype B and subtype C sequences isolated from mother and child pairs, obtained from three to five time points, in different phases of infection. The subjects studied included one mother and child pair assisted at the Sexually Transmitted Disease Reference Centre in Feira de Santana, Bahia, Brazil, whose samples were collected from three different time points, with an interval of, approximately, 6 months each, and three pairs from Zambia, Africa, whose env sequences were downloaded from GenBank. Similarly, as obtained for the first pair, each individual had viral sequences from three to five different time points with an interval of, approximately, 6 months from one sample to the other. In the case of the mother–child pair from Brazil, the samples were collected after signature of an informed consent letter. The Bahiana School of Medicine and Public Heath Ethics Committee approved this study.
Peripheral blood mononuclear cells (PBMCs) from the Brazilian pair were isolated from 10 ml of total blood using the Ficoll-Hypaque method. DNA was extracted from the PBMCs using the QIAGEN kit (QIAamp DNA Blood Kit). Nested polymerase chain reaction (PCR), using specific primers, was performed in order to obtain an HIV-1 env (1476 pb—from HXB2 position 6822 to 8298) gene fragment. The PCR product was purified using the QIAquick PCR Purification kit (QIAGEN) and then cloned using the TOPO TA Cloning kit. From each time point sample approximately 25 clones were selected and sequenced at the Genome Sequence Service Laboratory, University of Florida, Gainesville, FL.
The sequences generated from all time points, for each patient, were aligned using Clustal X 7 and manually edited. For the Zambia pairs we also aligned the child sequences with the first time point sequences of the respective mother. The Hudson test was performed to check if sequences from each different time point represent different subpopulations. 8 Considering that the presence of intrapatient recombinants can disturb the tree construction, the identification of these recombinant sequences was done through the PHI (pair-wise homoplasy índex) test, 9 implemented in the SplitsTree program. 10 Recombinant sequences were excluded until the p value was not significant (p>0.05). 11 All recombinants detected were excluded from the dataset for posterior analyses.
Maximum likelihood trees were generated using the PhyML 12 online tool applying the GTR evolutionary model to estimate the proportion of invariable sites and gamma shape parameter. The branch support was obtained by bootstrap analysis (1000 replicates). Bayesian analyses were performed with the BEAST v.1.4.8 package 13 testing the strict molecular clock with constant population size prior and the relaxed molecular clock using the constant population size, Bayesian Skyline Plot (BSP), and exponential growth priors. The parameters for each model were estimated using the Monte Carlo Markov chain (MCMC) method (50,000,000 generations with sampling every 5000 generations). The analysis results were visualized using Tracer v.1.4 software and the MCMC convergence was assessed calculating the effective sampling size (ESS) for each parameter, with the sampling size being significant when ESS >500. 14
The tested models were compared calculating the Bayes factor (BF): the ratio of the marginal likelihood of the compared models. Evidence against the null model, the one with the lower marginal likelihood, is indicated with 2 •loge(BF) >3 considered moderate evidence and >10 considered strong evidence. The BF was calculated to compare the strict molecular clock with the relaxed molecular clock model, both using the constant population growth prior, and then the relaxed molecular clock with the constant prior against the BSP prior and the exponential growth prior. The calculations were performed using BEAST v.1.4.8 and Tracer v.1.4 programs. The Bayesian framework, using the relaxed molecular clock with the BSP prior, estimated the effective population size, an informative method of assessing the evolutionary history of the pathogen. Tracer v.1.4 was used to perform the BSP reconstruction. Using the TreeAnnutator v.1.4.8 program, included in the BEAST package, 14 the maximum clade credibility tree was selected from the posterior tree distribution after a 50% burn-in for each dataset; all trees were visualized using FigTree v.1.2.2.
Subtype B CTL and B cell epitopes, previously described in the Los Alamos database, were mapped 13 for the Brazilian pair sequences, which are subtype B, while the previously described subtype C CTL and B cell epitopes were mapped for the Zambia pairs, since their sequences clustered as subtype C. For this analysis we aligned the epitope amino acid sequence with the amino acid sequences from each study subject and detected the presence of the epitope and which mutations were found in the epitope region by visual analysis.
In this study one mother and child pair from Feira de Santana, FS17 and FS16, and three pairs from Zambia, MIP834, MIP2660, and MIP2953, were analyzed. The FS16 and FS17 isolates were HIV-1 subtype B and were chronically infected at the first time point. The pair was diagnosed with HIV-1 3 years before the collection of the first time point sample. The child (FS16) was borne by natural birth and the mother (FS17) was under treatment at the first time point.
Different from the Brazil pair, the three isolate pairs from Zambia were subtype C and the first sample time point was the first HIV-positive sample for the mother and child, showing that the transmission from the mother to the child and, then, the sampling happened during the acute phase of infection of the mother. In addition, information on possible clinical symptoms of the mothers at the sampling time was not available in GenBank. These datasets of these pairs were selected for having three or more time points with multiple sequences from each time point and with approximately 6 months from one time point to the other.
The Hudson test was performed in all datasets to check if the different time points were different subpopulations. All datasets showed a value of p<0.01, indicating that each time point of the mother and the child represents different subpopulations.
The PHI test did not show different patterns in the percentage of recombination along time points when comparing the mother to child or the acutely infected to the chronically infected sequence datasets (Table 1). In most patients, a large number of recombinant sequences at the last time point was observed. The sequences from the mother MIP834_M showed a smaller number of recombination events, presenting only one (3%) recombinant sequence at the second time point, but some time points such as FS-16 revealed recombination in as much as 58% of the clone sequences (Table 1). The sequences from pairs FS-16 and FS-17 were from clones of multiple PCR reactions. This could increase the variation among the clones and the number of recombinations. Information on whether the Zambia pair clones were from a single PCR is not available. The presence of recombinant sequences in the phylogenetic analyses can disrupt its inference, giving less likely evolutionary results. Because of that, the sequences detected as recombinants by the PHI test were excluded from further analyses.
For sequence quality control the Quality Control tool, from the Los Alamos HIV database, was used. A maximum likelihood tree was also constructed using all the Zambia sequences and showed no epidemiological link between the pairs.
Maximum likelihood trees inferred using the online tool PhyML did not show statistical branch support. The topology showed a greater relationship between the sequences of the child and the mother at the first time point in the Zambia pairs due to the proximity of the sampling time and the transmission event. However, the chronically infected pair showed a distant relationship between the sequences from the mother and the child.
To study the HIV phylodynamics in these patients, Bayesian trees were constructed taking into account the sampling time. The relaxed molecular clock, which assigns different evolutionary rates to the different branches on the tree, was chosen as the best fitting model for all datasets when compared to the strict clock, which assigns a fixed evolutionary rate for the analyzed gene.
The sequence datasets were then analyzed using the relaxed molecular clock with the BSP and exponential population growth. Each model was then compared with the constant size prior, calculating the Bayes factor. For all datasets, the BSP was selected over the constant size, and the acutely infected pairs were strongly selected (>10) while the chronically infected pair was moderately selected (>3). However, the exponential growth showed strong evidence over the constant model in the MIP834_I (child) dataset and moderate evidence in the MIP2953_M (mother), MIP2953I+M (child+mother first time point), and FS17 (mother) datasets. The confidence intervals of the growth rate of MIP2662_I, MIP2953_I, FS16, and FS17 included the zero, indicating that there is no exponential growth in these viral populations.
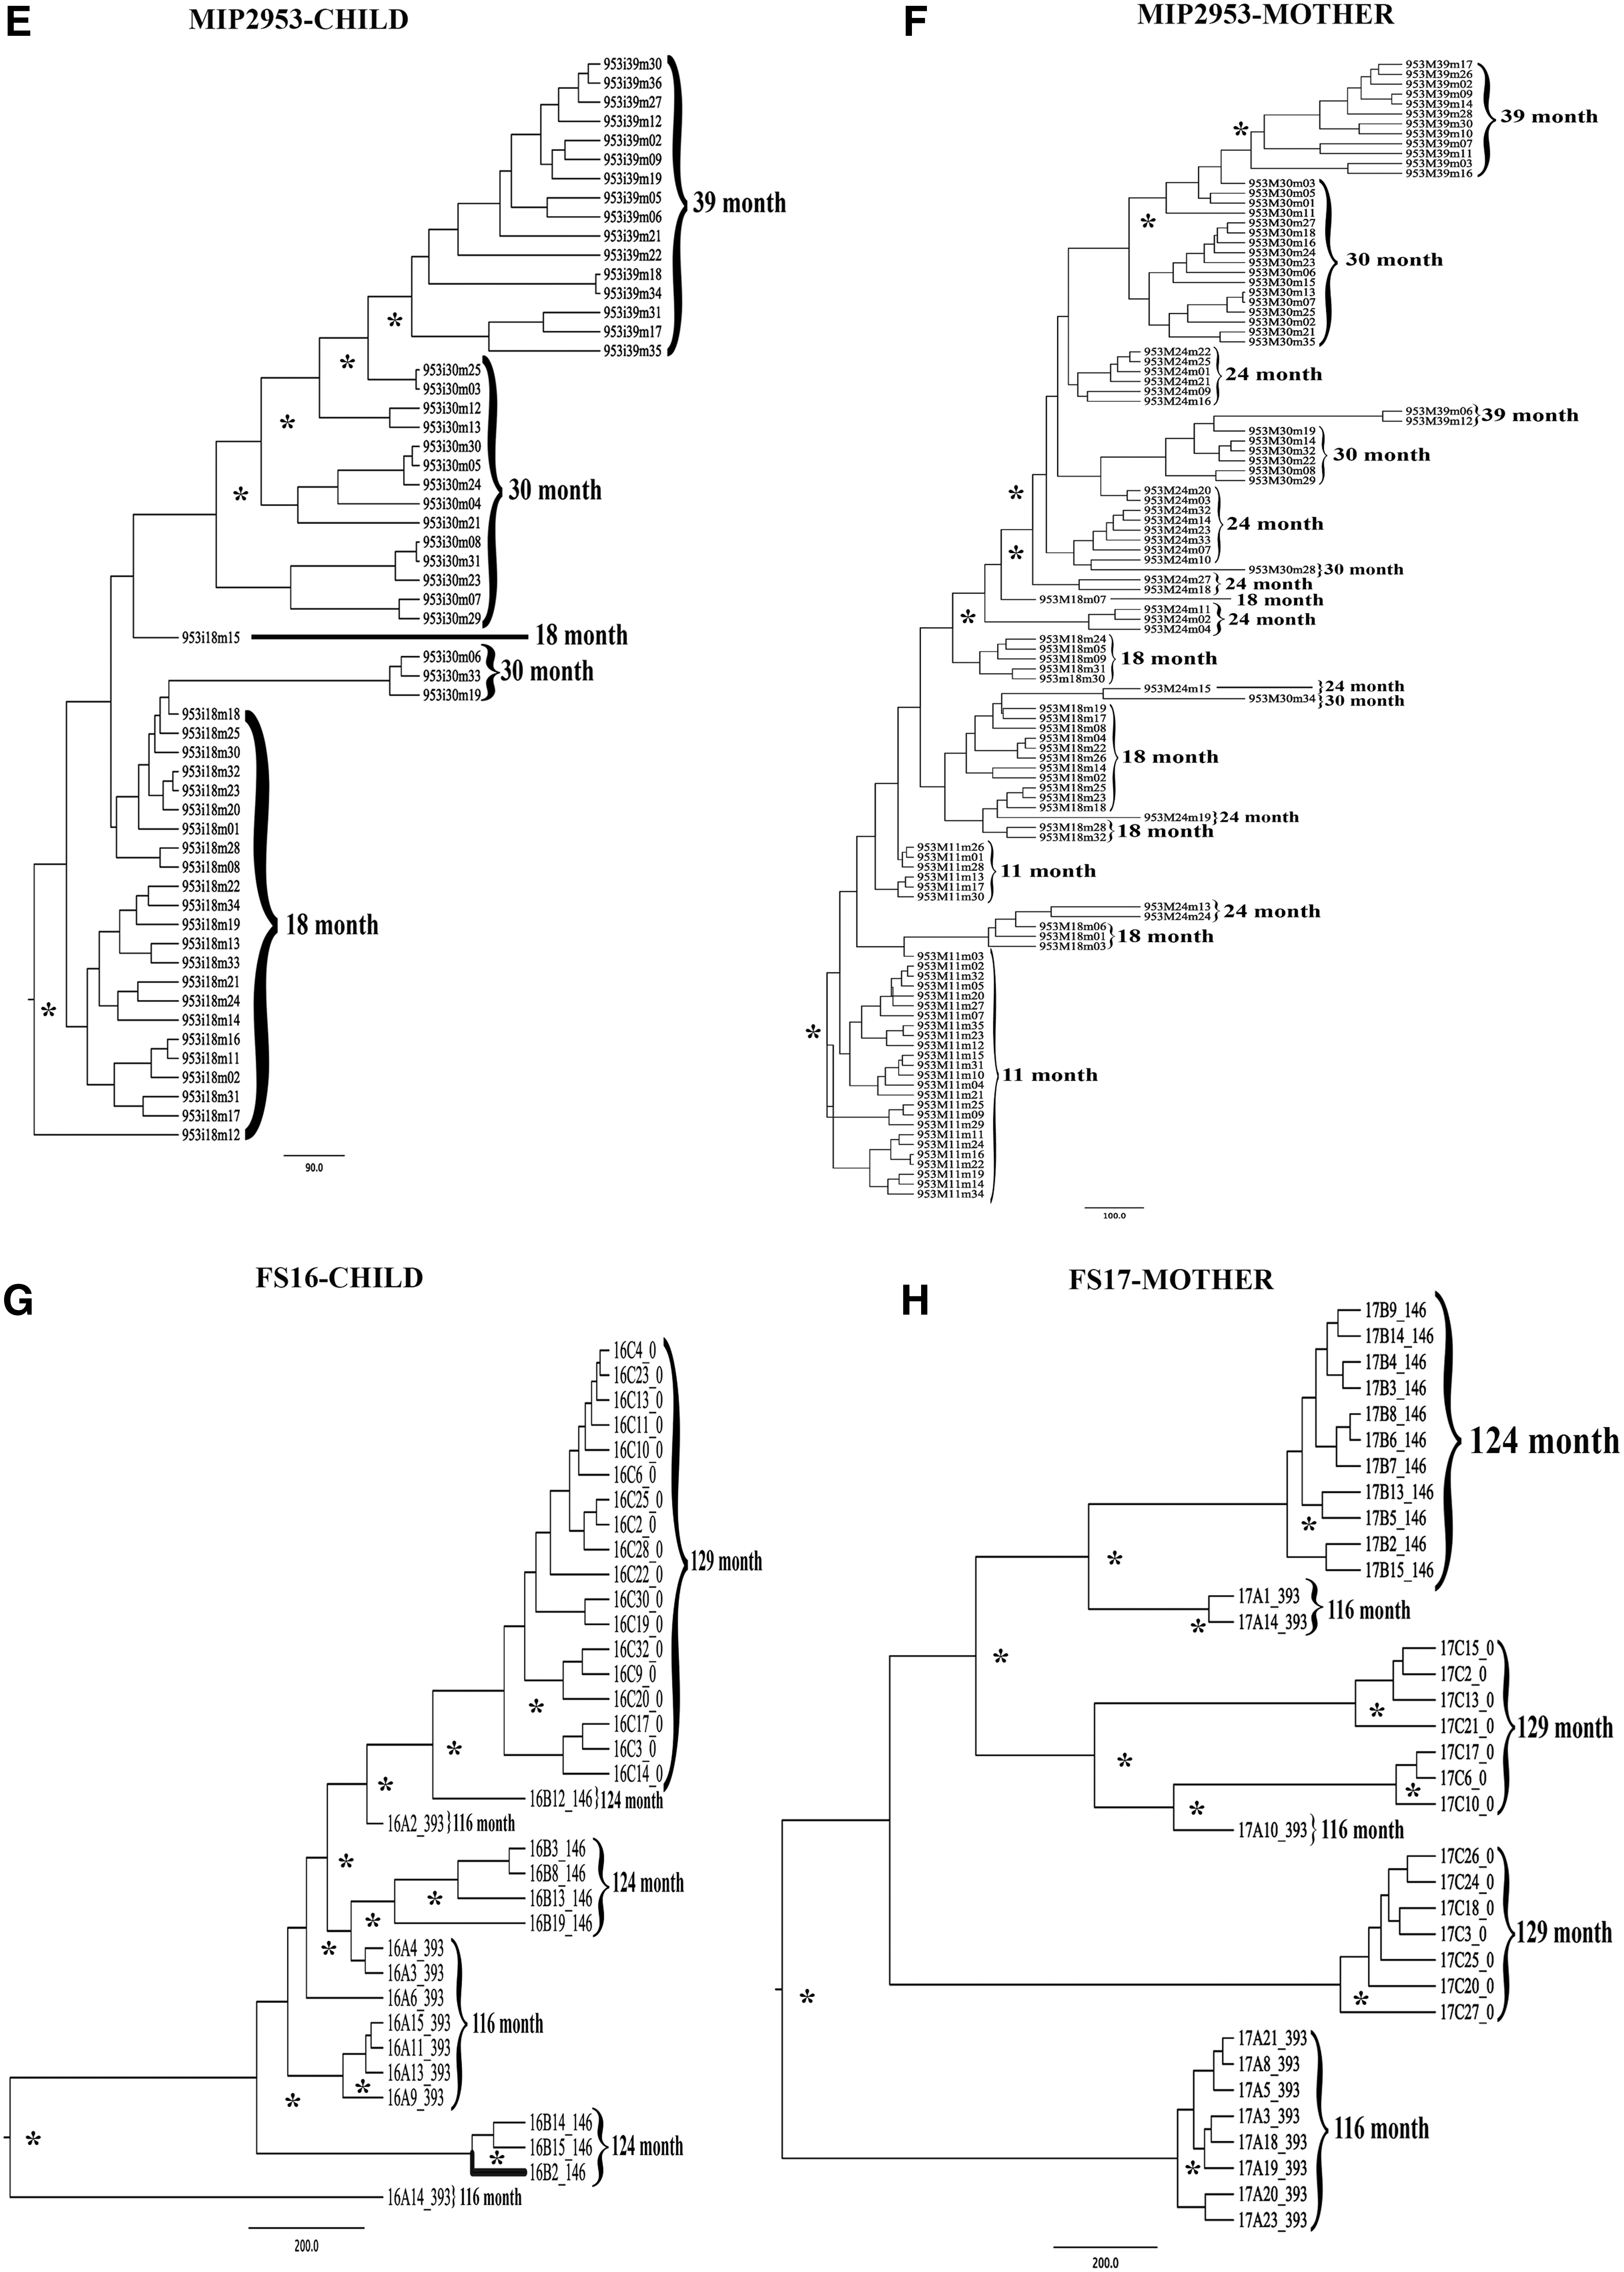
Figure 1 shows the Bayesian tree constructed with the relaxed molecular clock model. We did not find any pattern or different behavior of the tree topologies between mother and child either among subtypes or among phase of infection. Some of them presented a perfect temporal structure such as MIP834_M and MIP2953_I (Fig. 1).
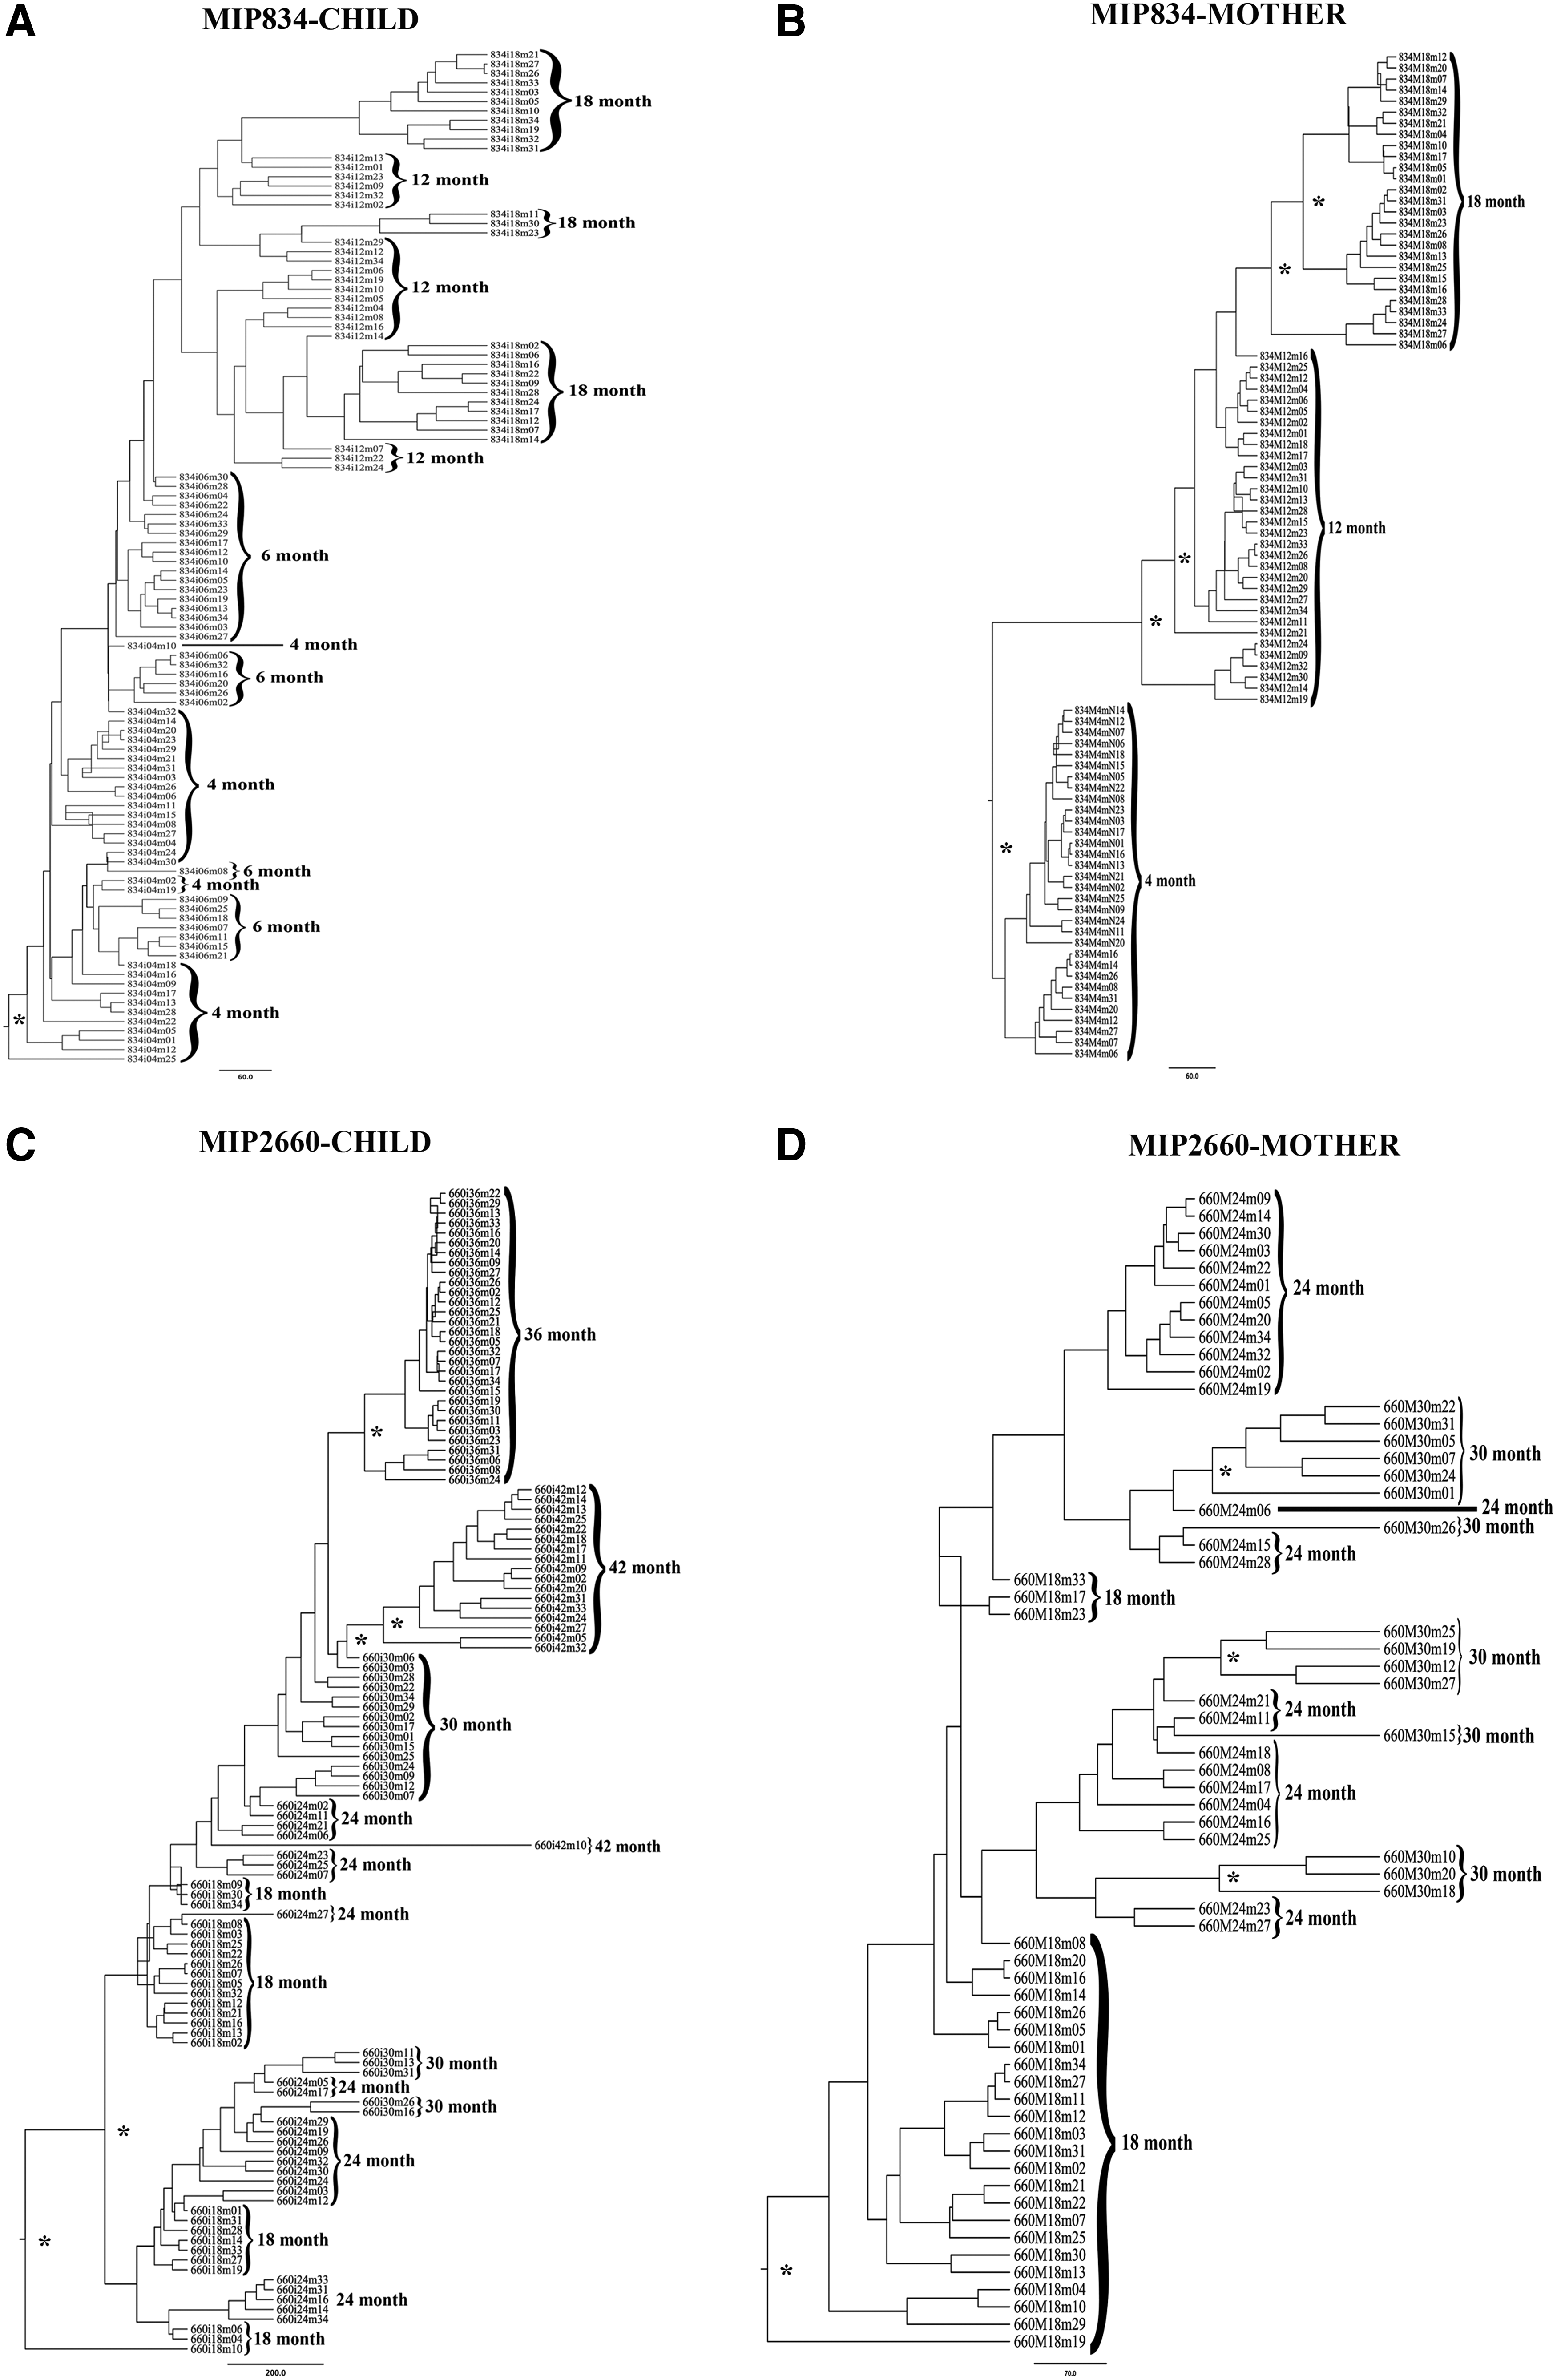
Bayesian maximum clade credibility phylogenetic trees. The trees were constructed using the relaxed molecular clock model and constant population size model. Tree roots were in the first time point considering that it is a temporal tree. The branch supports are giving by the posterior probability >0.80 and are indicated with an asterisk (*).
The BSP graphics that estimate the viral effective population size showed a different pattern for each pair, although the size had been around 2000. The pair from Feira de Santana showed a more constant growth over time, while in the Zambia pairs it was possible to observe a bottleneck between time points, especially in the analysis of the MIP2660 and MIP834 pairs (Fig. 2).
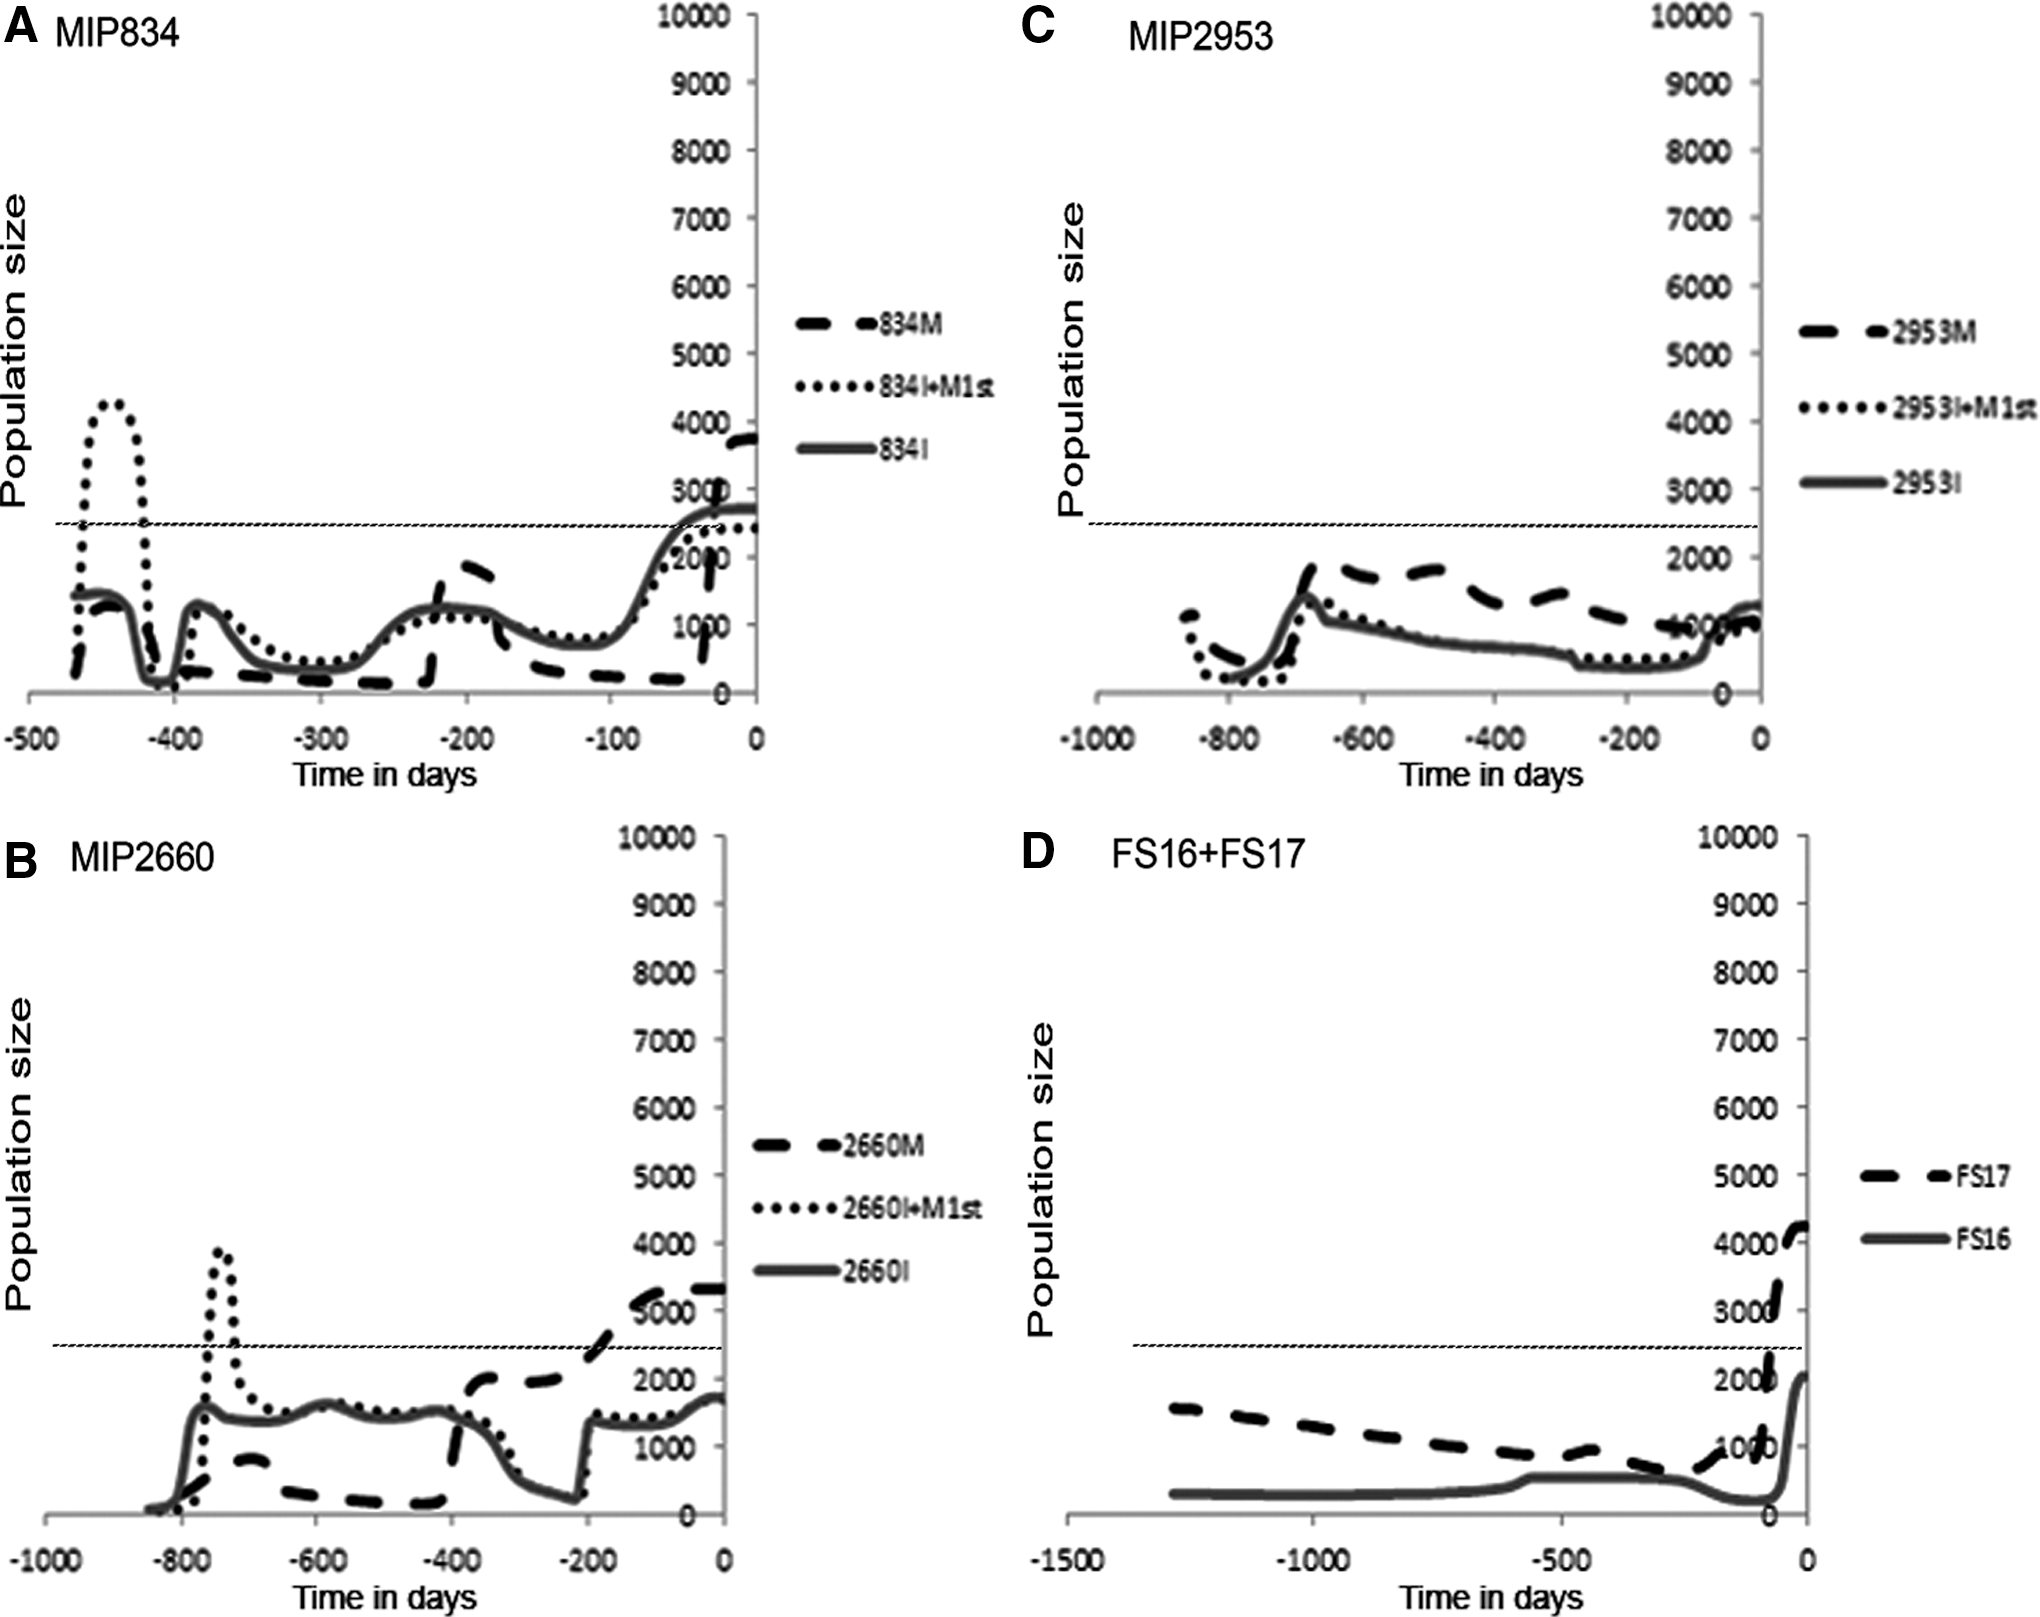
Bayesian Skyline Plots (BSP) to estimate the effective population size.
Out of the 21 subtype C B cell epitopes described in the Los Alamos database in this genomic fragment (env), four were wild type (for this analysis the Los Alamos subtype consensus sequences were considered as wild type) in the mother and the child in the MIP834 and MIP2660 pairs and one in the MIP2953 pair. Concerning the CTL epitopes, only 2 of the 10 epitopes found in the subtype C consensus sequence were wild type in the children and three in the mothers of the MIP2660 and MIP2953 pairs. The MIP834 mother presented four wild-type epitopes and the child presented five wild-type epitopes. Most of the mutations found in the sequences of the mother were the same ones found in the sequences of the child. However, for the subtype B pair, the epitopes and mutations were different between the sequences of the mother and child for both CTL and B cell epitopes.
The genetic variability within B cell and CTL epitopes was investigated and compared between different clones of each pair. Within the genomic fragment (env) analyzed in this study, there were 21 B cell epitopes described in the Los Alamos database for the consensus subtype C sequence. Out of these, 17 (81%) epitopes were entirely conserved in the mother and child MIP834, 20 (95%) in the MIP2660, and six (29%) in the MIP2953 at all time points. The remaining four epitopes (19%) for the MIP834, one (5%) for the MIP2660, and 15 (71%) for the MIP2953 were entirely conserved in the different time point clones of the same individual, but viral strains with additional mutations were present in part of the viral population of either the mother or the child.
Ten subtype C CTL epitopes were previously described in the Los Alamos database for the consensus subtype C sequence in the genomic fragment analyzed. Comparing the viral populations of mother and child, six (60%) epitopes were entirely conserved within the time in the MIP834 pair, three (30%) in the MIP2660 pair, and seven (70%) in the MIP2953 pair. Mutations emerged or disappeared within the time in four (40%) epitopes in either the mother or the child of the MIP834 pair, seven (70%) epitopes in either the mother or the child of the MIP2660 pair, and three (30%) epitopes in either the mother or the child of the MIP2953 pair.
For the chronically infected subtype B pair analysis, 32 B cell epitopes were included in the analysis (previously described in the Los Alamos database for the subtype B consensus sequence). Of those, three (9%) epitopes were entirely conserved in the mother and child at all time points. Mother and child showed differences in 29 (91%) B cell epitopes: 12 epitopes were conserved among the different time point clones of the same individual, but additional mutations were present in part of the viral population of either the mother or the child and 17 (53%) epitopes were completely different between mother and child and among the time points.
Out of the 53 CTL epitopes analyzed within the FS16/FS17 pair sequences, only two (4%) were entirely conserved in the mother and the child within the time. Five (9%) epitopes were partially conserved within the time, since at the third time point (124 months) new viral strains emerged but disappeared at the fourth time point (129 months). Mother and child showed differences in 46 (87%) CTL cell epitopes: four epitopes were conserved within the different time point clones of the same individual, but additional mutations were present in part of the viral population of either the mother or the child and the remaining 42 (79%) epitopes were completely different between mother and child and within the time points.
In conclusion, the tree topologies generated in this study did not show any differentiation in the evolutionary dynamics of the virus circulating in the mother from the viral population of the child. However, the trees and the BSP show that the strains from the mother are more closely related to the strains from the child in acutely infected mothers when they transmit the virus to their child.
Studies have shown that during chronic HIV-1 infection only a few variants of quasispecies are transmitted. 3,15 –17 However, acutely infected mothers transmit multiple closely related variants to their child, 18 which could be identified in the trees constructed using the sequences from the child with the sequences obtained from the mother for the first time point (data not showed). In the acutely infected pairs, sequences from the first time point of the mother and the child are mixed, showing different variants giving rise to the next population, while in the chronically infected pair analysis, the mother and the child present two different viral populations. The transmission of lineages from the mother to the child without selection in the mother and the possible multiple transmissions during breastfeeding are some of the possible explanations. 18
The effective population size reflects the evolutionary relationship among strains and changes in the number of effectively infectious virus, rather than the absolute number of circulating virions and viral load. Several studies have estimated the effective population size of HIV-1 quasispecies intrapatient. 19,20 –22 In this study, calculation of the Bayes factor selected the BSP over the constant population growth in all datasets, while exponential growth was selected in only a few datasets, showing that the BSP is a better fitting model to estimate the effective population size. The population growth estimate using different models indicates that the chronically infected pair has a more constant growth. Although the BSP model had been moderately selected over the constant, the BSP graphic shows a more constant effective population size over time, and the exponential growth rate did not exclude the zero, indicating constant growth. This could be related to a better adaptation of the virus in the chronic phase of infection and to a more compromised immune system in this pair.
The BSP of the acutely infected pairs shows a more dynamic growth so that the effective population size suffers a rapid decrease followed by growth, a bottleneck event, due to strong immune system pressure, from the beginning of the infection, selecting the more adapted strains over time. A perfect temporal structure was found at the MIP834_M (mother) dataset visualized in the tree and in the BSP, where the bottleneck events are clearly shown from one time point to the other.
The epitope mapping also indicates that the chronically infected mother presents a more distinct population than the child. Their different immune responses and the long time of infection lead to these very different populations, while the acutely infected pairs present more similar sequences, with similar epitopes between mother and child.
These findings show how HIV-1 intrahost population dynamics can differ depending on the phase of infection and transmission, and contribute to a better understanding of the mechanisms of virus evolution following vertical transmission.
Sequence Data
The sequences GenBank accession numbers for the F16–F17 pair are KF247318–KF247430 and for the Zambia pairs are FJ854750–FJ855125 and FJ859377–FJ859679. 18
Footnotes
Acknowledgment
We thank the Brazilian Ministry of Heath Centro Nacional de Pesquisa (CNPq) for funding of the master student L.A.S.
Author Disclosure Statement
No competing financial interests exist.