
Abstract
CHARM-02 is a crossover, double-blind, randomized trial to compare the safety and pharmacokinetics of three rectally applied tenofovir 1% gel candidate rectal microbicides of varying osmolalities: vaginal formulation (VF) (3111 mOsmol/kg), the reduced glycerin vaginal formulation (RGVF) (836 mOsmol/kg), and an isoosmolal rectal-specific formulation (RF) (479 mOsmol/kg). Participants (n = 9) received a single, 4 ml, radiolabeled dose of each gel twice, once with and once without simulated unprotected receptive anal intercourse (RAI). The safety, plasma tenofovir pharmacokinetics, colonic small molecule permeability, and SPECT/CT imaging of lower gastrointestinal distribution of drug and virus surrogate were assessed. There were no Grade 3 or 4 adverse events reported for any of the products. Overall, there were more Grade 2 adverse events in the VF group compared to RF (p = 0.006) and RGVF (p = 0.048). In the absence of simulated unprotected RAI, VF had up to 3.8-fold greater systemic tenofovir exposure, 26- to 234-fold higher colonic permeability of the drug surrogate, and 1.5- to 2-fold greater proximal migration in the colonic lumen, when compared to RF and RGVF. Similar trends were observed with simulated unprotected RAI, but most did not reach statistical significance. SPECT analysis showed 86% (standard deviation 19%) of the drug surrogate colocalized with the virus surrogate in the colonic lumen. There were no significant differences between the RGVF and RF formulation, with the exception of a higher plasma tenofovir concentration of RGVF in the absence of simulated unprotected RAI. VF had the most adverse events, highest plasma tenofovir concentrations, greater mucosal permeability of the drug surrogate, and most proximal colonic luminal migration compared to RF and RGVF formulations. There were no major differences between RF and RGVF formulations. Simultaneous assessment of toxicity, systemic and luminal pharmacokinetics, and colocalization of drug and viral surrogates substantially informs rectal microbicide product development.
Introduction
E
Key features of successful RM development include safety, efficacy, and acceptability of the product by the target population. RM have the advantageous feature of directly targeting the colonic mucosa that is at risk of HIV infection with high antiretroviral (ARV) drug concentrations while simultaneously limiting systemic exposure and potential toxicity. 12 High local concentrations may also enable periodic dosing by achieving local tissue concentrations above protective target concentrations more rapidly than can be achieved by oral dosing. However, locally high concentrations need to be developed carefully to rule out local toxicity.
Encouraged by the success of oral preexposure prophylaxis (PrEP) with tenofovir (TFV)-containing regimens, 13 –16 TFV, a potent nucleotide reverse transcriptase inhibitor (NRTI) with a long intracellular active drug half-life, is being investigated as an RM. RMP-02/MTN-006 evaluated the rectal application of the vaginal formulation (VF) TFV 1% gel, the formulation used in CAPRISA 004 and VOICE studies for vaginal application, 17 –19 and found a rate of minor adverse events (AEs) too frequent to recommend further development as an RM. The gastrointestinal-related AEs were attributed, in part, to the very high osmolality (3,111 mOsmol/kg) of the formulation. Subsequently, a TFV 1% reduced glycerin formulation (RGVF) with far lower osmolality (836 mOsmol/kg) was studied in MTN-007 showing that RGVF was safe and well tolerated. 20 Based on these favorable tolerability results, a phase II trial of the RGVF gel is now underway (MTN-017). A third TFV 1% gel, formulated specifically for rectal use (rectal formulation, RF), has been developed to achieve even lower, near physiologic, osmolality (479 mOsmol/kg) and pH value closer to that of the rectum (pH close to 7). 21 The RF vehicle was selected from among four candidate RM vehicles based on pharmacokinetics/pharmacodynamics (PK/PD), toxicity, and acceptability. 22
The current study, Combination HIV Antiretroviral Rectal Microbicide (CHARM) 02 (CHARM-02), is a double-blinded, randomized, pharmacokinetic and safety study of three rectally applied TFV 1% gel candidate rectal microbicide formulations; the VF, RGVF, and, RF are distinguished primarily by their far different osmolalities. The goals of the study were to evaluate the safety, systemic TFV PK, colonic luminal distribution, and clearance of the three gels, and their impact on mucosal permeability. In addition, we assessed the degree of overlap in the colonic luminal distribution for each of the gels with a surrogate for HIV-infected ejaculate. CHARM-02 was designed as a complement to, and performed in parallel with, CHARM-01, whose objectives included multicompartmental PK, a detailed mucosal safety assessment, and an evaluation of the HIV protective effect using an ex vivo colorectal HIV-1 challenge assay. 23 These studies represent the first-in-human studies of TFV 1% RF gel.
Materials and Methods
Study design and participants
The Johns Hopkins Medicine Institutional Review Board approved this single-center, randomized, double-blinded, crossover study of three TFV 1% gel formulations. All research participants completed a written informed consent prior to screening. Eligible participants were healthy, male, HIV-seronegative adults with history of consensual receptive anal intercourse (RAI) at least once within the 6 months prior to screening. All participants received each study gel twice, once with and once without simulated unprotected RAI. There was a minimum of 11 days washout period between each gel administration (Supplementary Appendix 1: CHARM-02 Protocol; Supplementary Data are available online at
Dose preparation and administration
The three rectally applied TFV 1% formulations in this study are a VF, an RGVF, and an RF. Study investigators administered all doses in the research clinic. Each dose of the study gels was prepared by mixing 100 μCi 111In-diethylenetriaminepentaacetic acid (111In-DTPA, Cardinal Health, Halethorpe, MD) with 4 ml of the study gel as the radiolabeled study drug surrogate. In addition, for the visits with simulated RAI, 500 μCi 99mTc-sulfur colloid (99mTc-SC) was mixed with 2.5 ml of autologous seminal plasma, and administered 60 min after gel product dosing as the HIV surrogate (based on a similar 100 nm sulfur colloid particle size in a colloidal suspension). The seminal plasma was collected prior to the study dosing visits in one or several outpatient visits to the research clinic until adequate semen volume was acquired.
To quantitatively describe the distribution of the formulation following the addition of ejaculate and the potential for mixing due to the coital forces, simulated unprotected RAI with autologous semen was carried out. All participants received a bowel preparation using a Normosol-R (Abbott Laboratories) enema to remove bowel contents from the distal colon and to more closely match the realistic clinical conditions in which these rectal products will be used. Normosol, a pH and salt-balanced electrolyte solution for licensed intravenous administration and fluid replacement, was chosen in order to reduce the confounding toxicity to the colonic mucosa. The research participant then inserts a single-use artificial phallus with a catheter in a urethral position into the rectum and cycles the devices in and out of the rectum to its full extent once each second for 5 min. With the phallus remaining in situ, the autologous semen sample, radiolabeled with 99mTc-sulfur colloid, is injected by the study team member through the catheter within the device. The subject then resumes simulated intercourse with 10 more in/out cycles of the device and then removes the device. This procedure has been used successfully in previous studies. 25
Safety and acceptability
The safety of the three products was assessed during the entire study period; participants were asked about any AE during each study visit, which was followed by a directed physical examination and safety laboratory examination. They were also instructed to contact the investigators should any AE occur while they were at home. The acceptability of each study product was evaluated through the administration of a brief questionnaire after each dose.
Drug concentration analysis
Blood samples (4 ml) were drawn in K2EDTA vacutainer tubes (BD, Franklin Lakes, NJ) at predose and 0.25, 0.5, 0.75, 1, 1.25, 1.5, 1.75, 2, 2.33, 2.66, 3, 3.5, 4, 8, 12, and 24 h postdose; plasma was separated from the tubes after centrifugation at 1,000 × g for 10 min at 4°C. Aliquots were set aside for gamma counting (permeability) and aliquots were stored at −80°C for batched TFV analysis. TFV concentrations were determined by a previously validated ultraperformance-liquid chromatographic-tandem mass spectrometric (UPLC-MS/MS) method at The Johns Hopkins University Clinical Pharmacology Analytical Laboratory (CPAL). 26,27 The assay had a lower limit of quantification of 0.31 ng/ml. Peak concentration (C max), times to peak concentration (T max), and area under the concentration-time curve for 24 h (AUC0–24) were calculated using WinNonlin (Pharsight, 6.3, Cary, NC).
SPECT/CT imaging distribution
Two hours and 24 h after each gel administration, participants underwent single-photon emission computed tomography with transmission computed tomography (SPECT/CT) to determine the luminal distribution and clearance of each study gel radiolabel (111In-DTPA) and whole semen radiolabel (99Tc-sulfur colloid). Participants were imaged using a dual-head VG SPECT series system (GE Medical Systems, Waukesha, WI) equipped with a CT unit (Hawkeye) as previously described. 25,28 CT images were reconstructed with a filtered back projection algorithm onto a 256 × 256 matrix size. After SPECT acquisition, images were reconstructed using the OSEM algorithm and fused with CT images into a 128 × 128 × 128 matrix size with each voxel representing 3.45 mm3, using the General Electric eNTEGRA workstation, software version 1.04 (GE Medical Systems, Waukesha, WI). 29
Curve-fitting and concentration-by-distance calculations were performed using R version 3.1.0 (The R Foundation for Statistical Computing, Vienna, Austria) as per previously described algorithms. 28,30 Briefly, a flexible principal curve algorithm was used to construct a three-dimensional curve based on the colon images. After the centerline was constructed, a concentration-by-distance curve was estimated along the centerline using the orthogonal projections. For standardizing distances within and among research participants, the readily identifiable coccygeal plane in the CT (axial view) was used as the origin (z = 0 value) of the centerline as previously described. 31 The distance along the centerline between the origin of the radiolabel signal and the coccygeal plane was recorded as D min (minimum distance associated with the closest, most distal, point where radiolabel was detected within the lumen of the colon) with negative values indicating radiolabel origin below the coccyx and positive values indicating centerline origin above the coccyx in the craniocaudal axis. Previously defined imaging pharmacokinetic-distance parameters—D max (distance associated with the most proximal radiolabel signal within the colon), DC max (distance associated with maximum concentration), and D ave (mean residence distance)—were calculated for further analysis. 31
Mucosal permeability
Blood samples were collected at the same 17 time points as for plasma TFV PK. Urine samples were collected in three intervals: 0–2 h, 2–4 h, and 4–8 h postdose. Gamma emissions in 1-ml aliquots were measured on a gamma counter (Wizard2 automatic gamma counter model 2480, PerkinElmer, Waltham, MA) within a 110- to 150-keV energy window, and data were corrected for decay relative to the time of dosing. Urine gamma emission results were also volume corrected. Radioactivity was expressed as a fraction of the dose administered in order to normalize readouts among subjects and products. Plasma 111In-DTPA results were analyzed by calculating the C max, T max, and AUC0–24. For urine, the maximum observed urine excretion rate (Max rate), area under the urinary excretion curve (AURC), and percent of dose recovered in urine (% recovered) were calculated. Both plasma and urine analysis were carried out using WinNonlin (Pharsight, 6.3, Cary, NC).
Dual isotope 111In and 99mTC image analysis
We determined the fraction of the HIV surrogate (99mTc-SC) colocated with the microbicide surrogate (111In-DTPA) to delineate the adequacy of the study product distribution relative to the HIV surrogate distribution. Crosstalk correction was performed using previously described methods. 32,33 Using R (version 3.1.2), all voxels with high 99mTc were selected and defined as “voxels at risk” (VAR). To remove scattered voxels far from the region of interest, only 200 or more contiguous voxels among the VAR, named contiguous VAR (cVAR), were considered.
For this analysis, we used the 99.99% quantile of the intensities of a pure background signal (abdominal location inconsistent with colon distribution) for 99mTc and 111In, respectively, as a scan-specific threshold. Within the cVAR in each scan, two quantities,
Data analysis and sample size
A sample size of nine research participants was calculated to detect a 0.7 difference in proportion of AEs and a standardized mean difference of 0.93 in the pharmacokinetic distance or permeability outcomes between any of the study gel formulations in a paired analysis with 80% power using a two-sided, 5% alpha error. Data were analyzed using the statistical package STATA/IC 13.1 software (StataCorp LP, College Station, TX). Statistical significance was defined as a p-value < 0.05.The number and frequency of Grade 2 or higher AEs were tabulated for each of the three study formulations after the final dosing visit. The proportion of events was compared between each pair of formulations using McNemar's test. The Friedman test was used to assess differences in frequency of AEs among study products, and based on the result, a Wilcoxon rank sum test was utilized for pairwise analysis. For comparison of plasma TFV PK, pharmacokinetic distance, and mucosal permeability outcomes, Wilcoxon rank sum paired analysis was used. In addition, to delineate the linear correlation between plasma TFV concentrations and mucosal permeability, a Pearson's correlation coefficient was calculated, with data transformation as needed.
Results
Subjects
Seventeen men provided written informed consent and were screened (Fig. 1). Of these, nine fulfilled the inclusion and exclusion criteria and were enrolled. The mean age of the research participants was 41.8 years [standard deviation (SD) 9.3]. Three were European American and six were African American by their own report. Data from all nine participants were included for AE analysis (safety cohort). Data from eight were included in the other analyses (PK cohort). One research participant was excluded from the PK cohort due to laboratory evidence that he was surreptitiously taking tenofovir/emtricitabine during the study period.
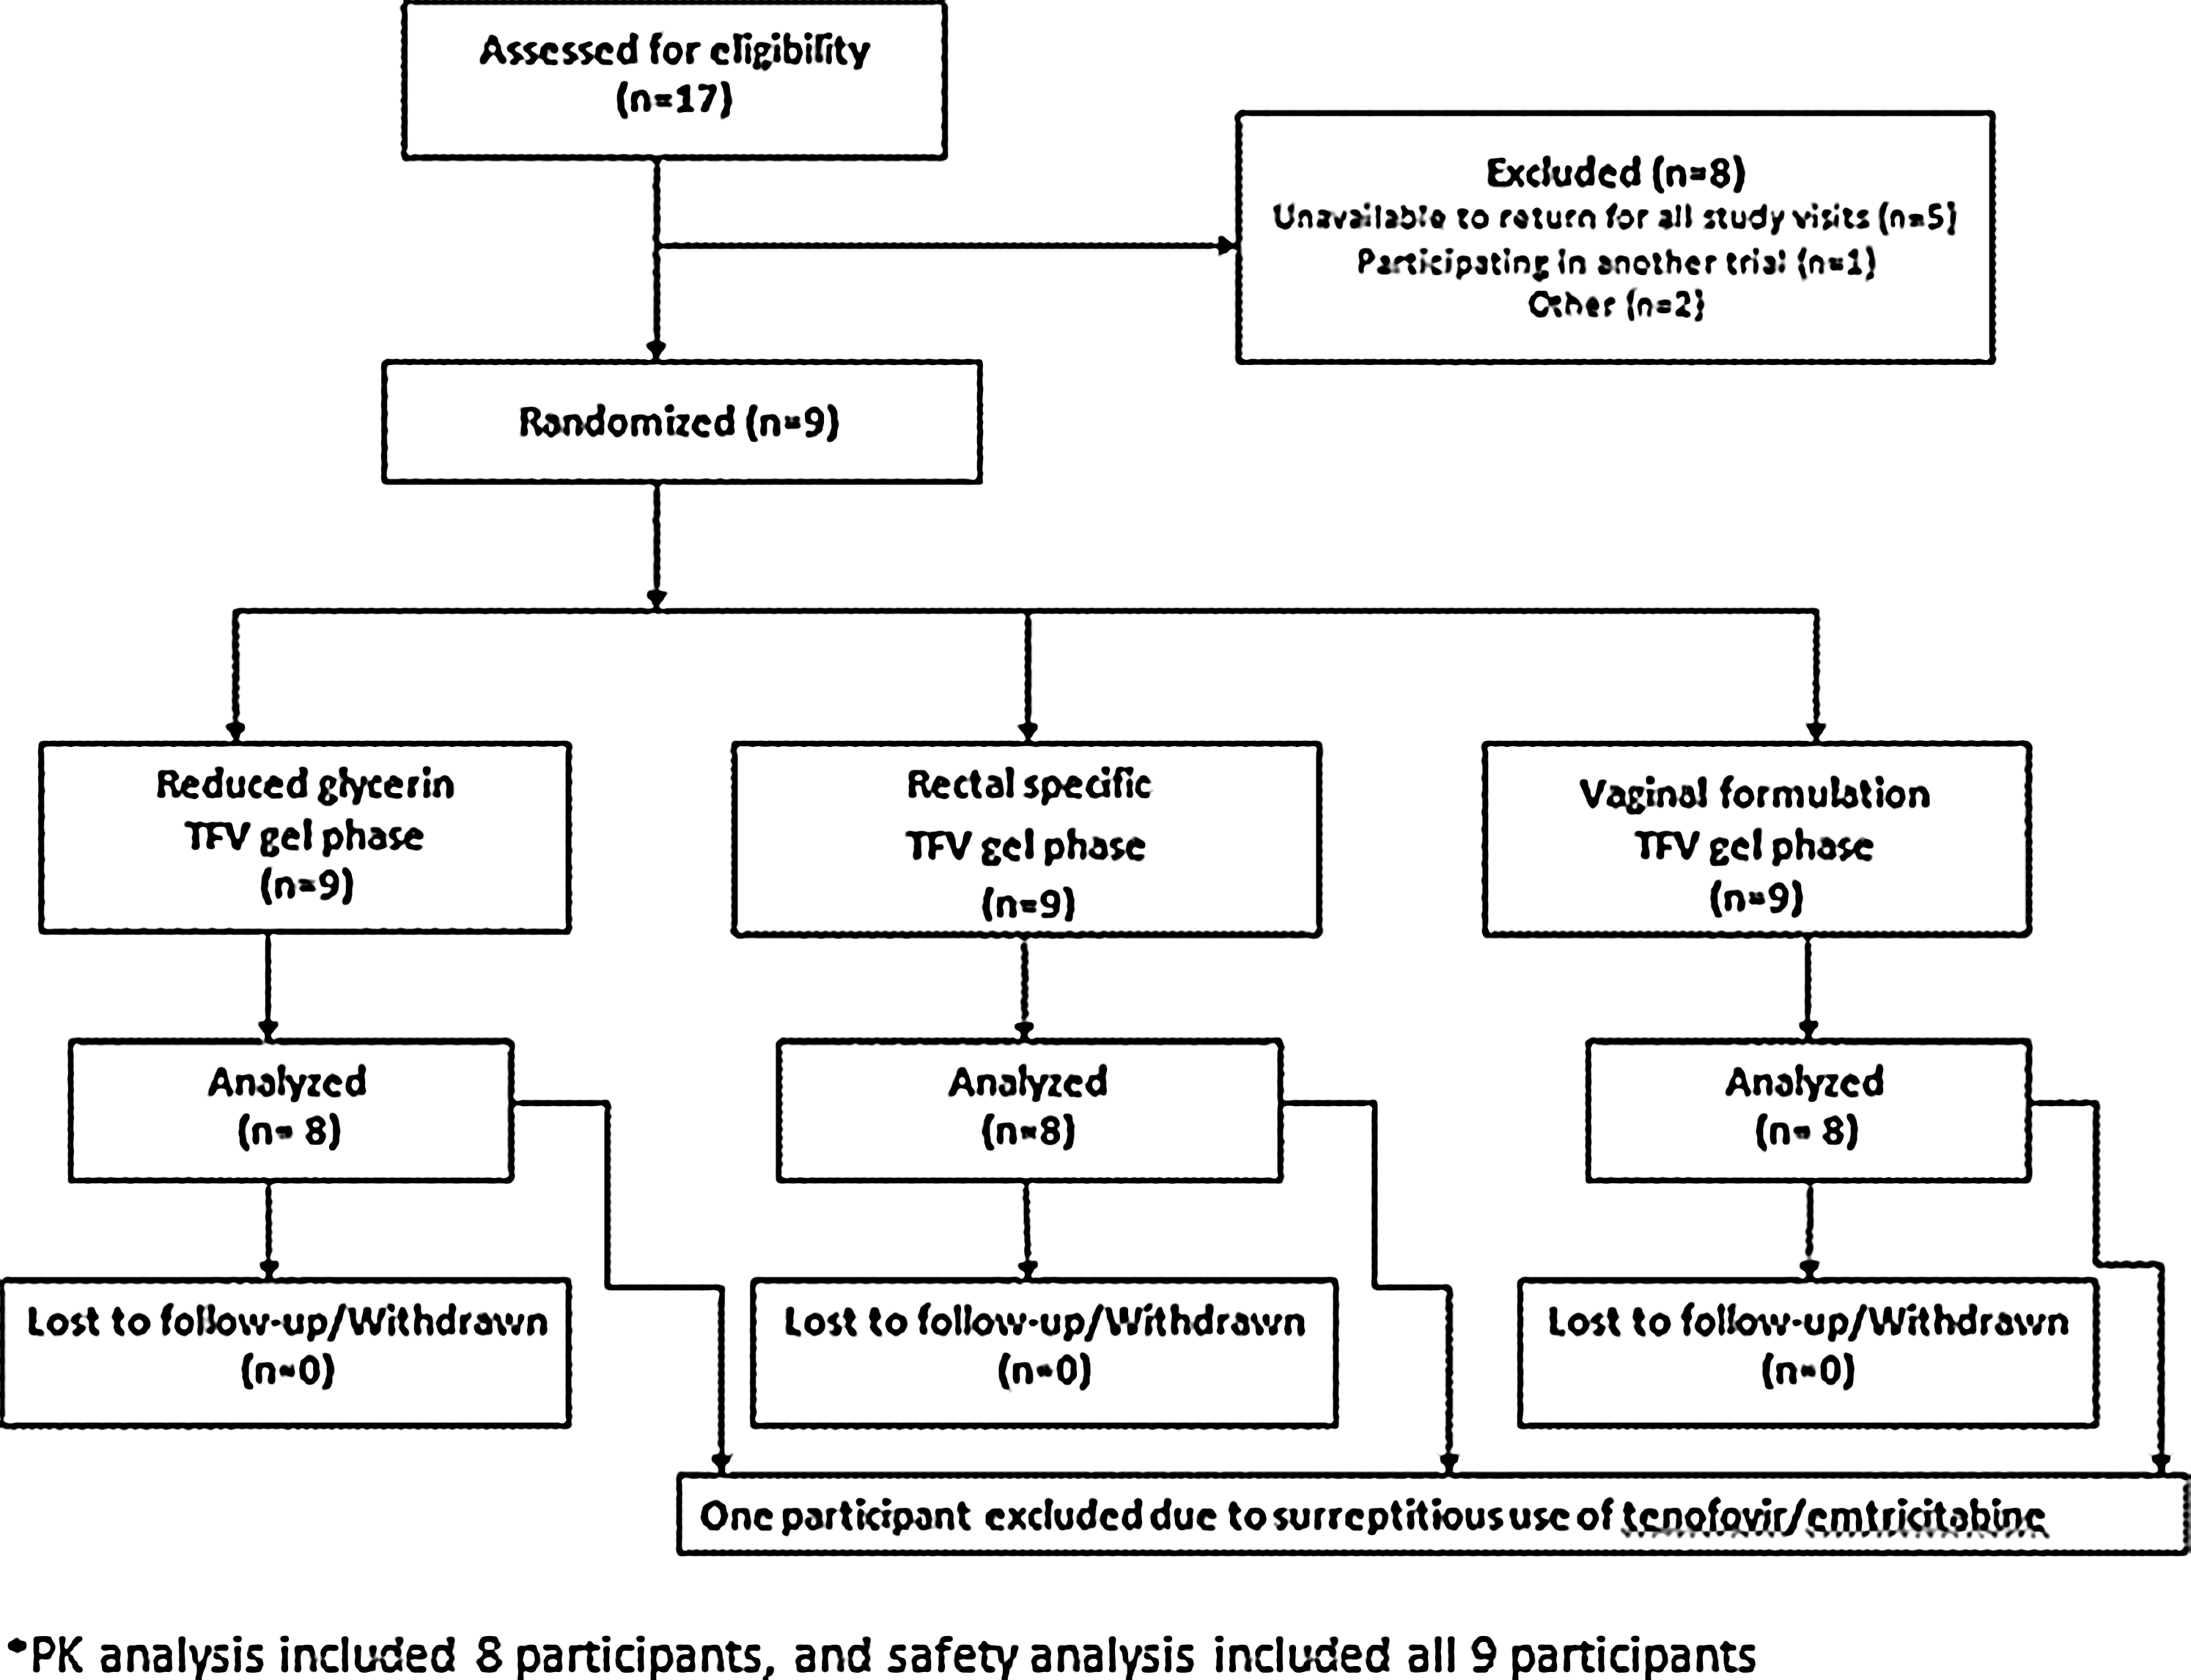
CHARM-02 study flowchart. Pharmacokinetic (PK) analysis included eight participants who maintained study eligibility, received all three study products, and completed all three sampling periods. The safety analysis included all nine research participants enrolled regardless of eligibility throughout the study.
Adverse events
Overall, there were 54 AEs and there were no Grade 3 or 4 AEs. AEs were more common when participants were receiving VF (6/9) as compared to RF (1/9) or RGVF (3/9) (Table 1). Pairwise comparison revealed a statistically significant higher number of overall Grade 2 AEs in the VF group as compared to RF (13 vs. 1, p = 0.006) and RGVF (13 vs. 5, p = 0.048).
p-values derived from pairwise comparison of formulations using McNemar's test.
p-values derived from pairwise comparison of formulations using Wilcoxon rank sum test; these were performed after a Friedman test showed differences in frequency of AEs among the study products.
RF, rectal formulation; RGF, reduced glycerin formulation; VF, vaginal formulation; RGVF, reduced glycerin vaginal formulation; AEs, adverse events.
Twenty-three of the AEs (41.8%) were deemed related to the study gels, and all but one of these events were Grade 1. All of the 23 AEs were gastrointestinal in nature, including abdominal cramps (34.8%), diarrhea (26%), bloating/flatulence (21.7), urgency (8.7%), proctalgia (4.4%), and rectal bleeding (4.4%). There were numerically higher number of AEs in VF as compared to RGVF and VF, which did not reach statistical significance in pairwise analysis (Fig. 2 and Table 1).
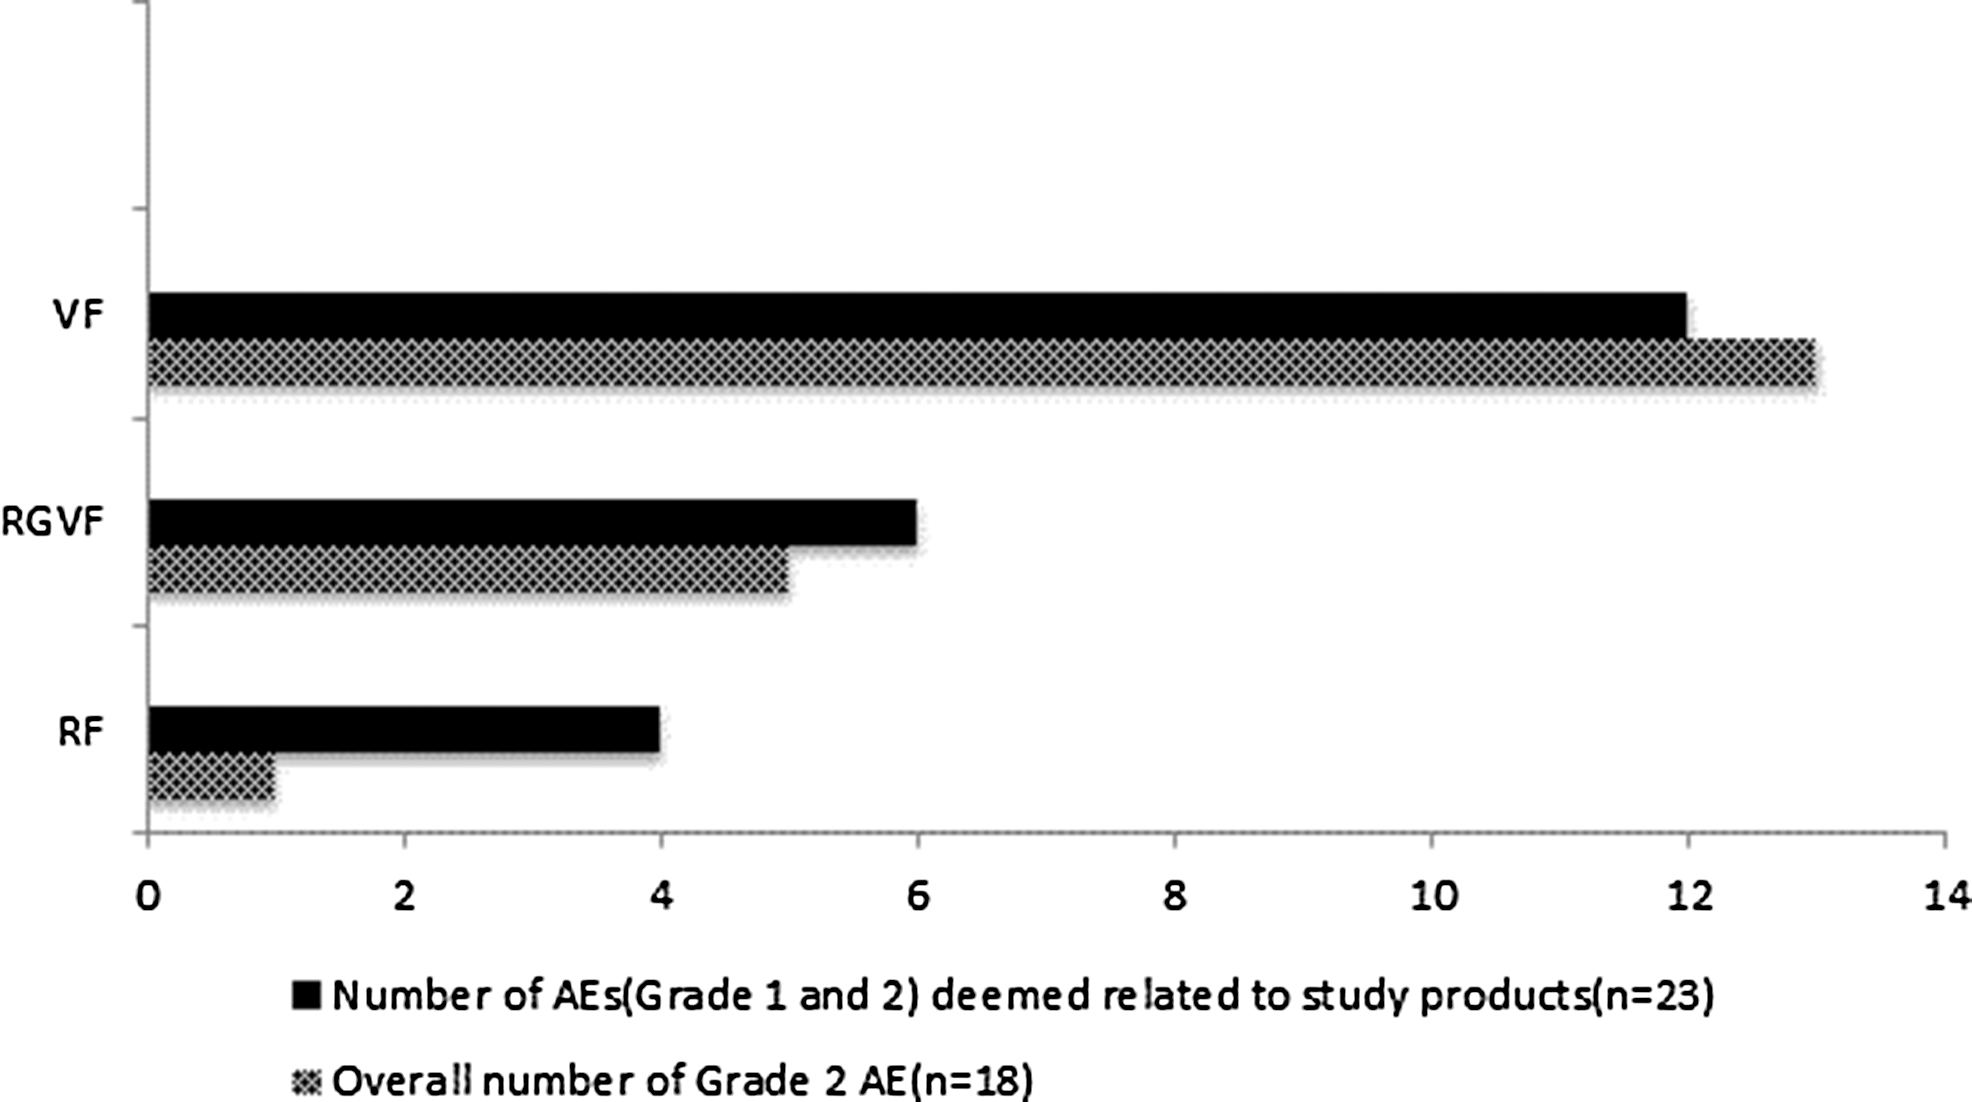
Number of overall Grade 2 adverse events (AEs) and subset of AEs (Grade 1 and 2) deemed related to study gels by product.
Plasma pharmacokinetics of tenofovir
In the absence of simulated unprotected RAI, the median C max of TFV for the VF formulation was 6.4-fold higher than for the RF (p = 0.009) (Table 2). VF also had a 4-fold higher median C max than RGVF, but this did not reach statistical significance (p = 0.06). The median C max for RGVF was also 1.6 times higher than RF (p = 0.005). With simulated unprotected RAI, the trend of a higher median C max for VF was also observed, but only the difference in C max for VF and RGVF was statistically significant (36.5 ng/ml vs. 6.87 ng/ml, respectively, p = 0.03) (Fig. 3 and Table 2).

Median (interquartile range) plasma tenofovir (TFV) concentration (log10) for each time point by product without
Comparison of SURAI vs. no SURAI for each PK parameter yielded p-value > 0.05.
SURAI, simulated unprotected receptive anal intercourse.
In addition, there was a statistically significant shorter T max observed for VF when compared to the RF formulation (1.18 h vs. 2.85 h, p = 0.005 without simulated RAI, 1.26 vs. 1.65h, p = 0.016 with simulated unprotected RAI).
Similar to the trend noted for C max, there was an overall trend of higher AUC0–24 for the VF formulation, both in the absence and presence of simulated unprotected RAI; however, only the comparison of VF and RGVF yielded a statistically significant difference, with VF having a 3.8-fold higher AUC0–24 than RGVF (p = 0.027).
Imaging distribution
Of the 48 2-h postdose SPECT/CT scans that were scheduled, all were completed. Three (two RF, one VF) did not show any microbicide or HIV surrogate signal due to loss of isotope as a result of a bowel movement prior to imaging. The 24-h postdose scans were discontinued after the first five scans in which there was no signal detected due to a combination of radioactive decay and bowel movements.
For the analysis of the drug surrogate (111In-DTPA) in the absence of simulated RAI, there was a statistically significant difference in D max and D ave for VF when compared to RF and RGVF; D max for VF was 1.5 times and 2 times higher than RF and RGVF, respectively (p = 0.04 and 0.002) (Table 3). Similarly, D ave for VF was 2.9 and 2.1 times higher than RF and RGVF, respectively (p = 0.015 and 0.02). In contrast, there was no statistically significant difference in DC max among the three products, although VF medians were higher than the other formulations. There was also no difference in D min among the products. In the presence of simulated RAI, VF had numerically higher medians of D max, DC max, D min, and D ave when compared to RF and RGVF, but none of these reached statistical significance.
The only comparison between CDS vs. no CDS that yielded p-value < 0.05 was DC max for RF (p = 0.035).
The coccyx is the reference point for all the distance variables above.
SURAI, simulated unprotected receptive anal intercourse; D max, furthest point where radiosignal was detected; DC max, distance at maximum concentration; D ave, mean residence distance; D min, distance associated with the most distal signal; CDS, coital dynamic simulation.
When comparing the distribution of the drug and the HIV surrogate, there was no statistically significant difference in D max and DC max. There was a trend of higher D ave for the drug surrogate in RF and RGVF, but it did not reach statistical significance (p = 0.06 and 0.07, respectively) (Table 4). The drug surrogate was closer to the anus when compared to the HIV surrogate for the RF and RGVF (p = 0.004 and 0.002, respectively). Sample SPECT images and distance-concentration plots are depicted in Fig. 4a–c.
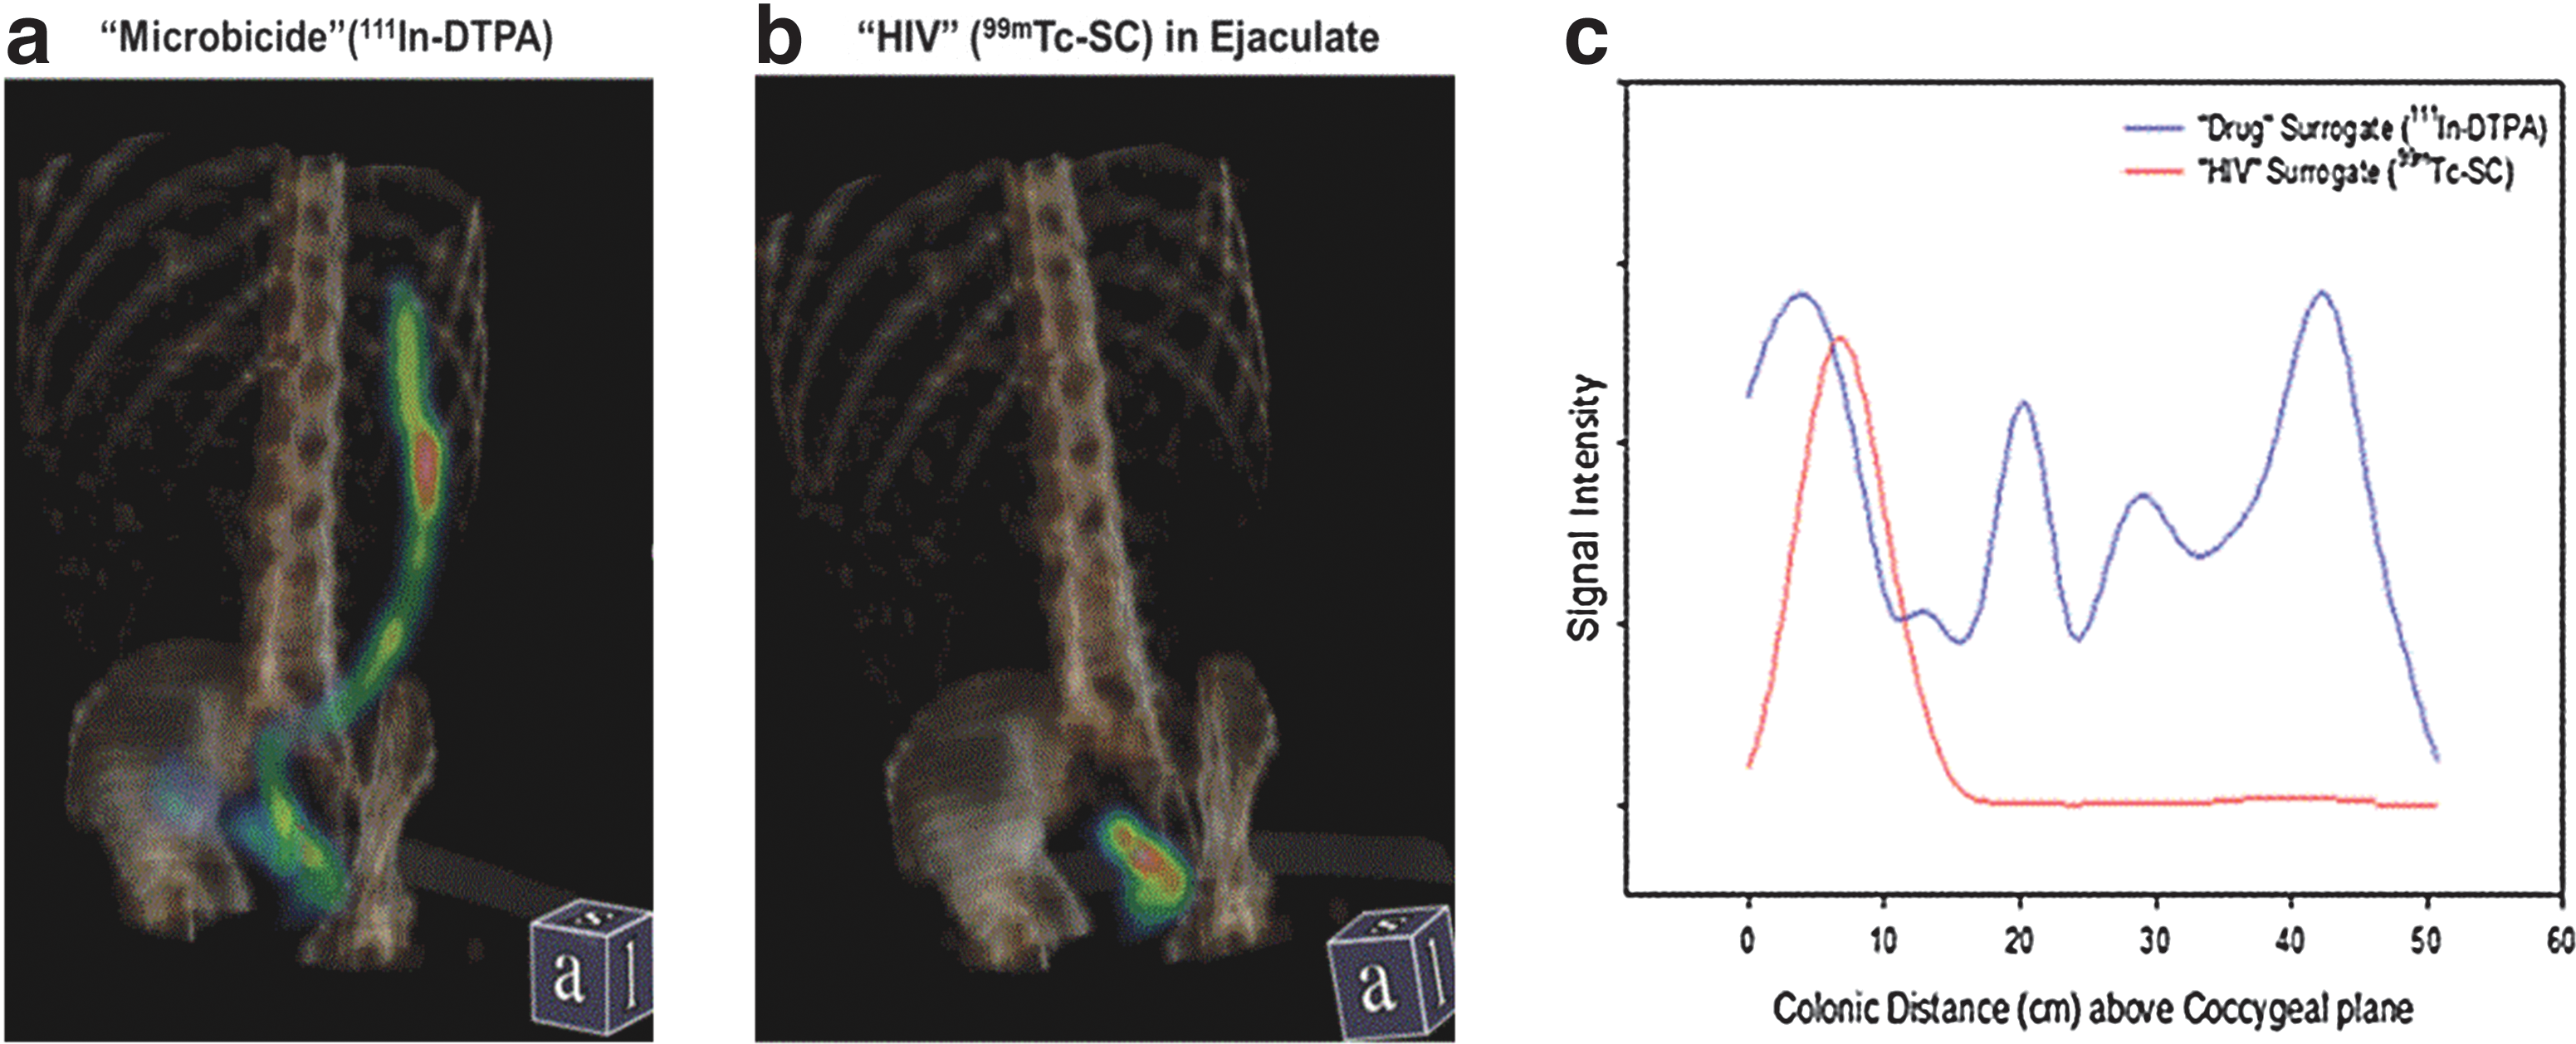
Single photon emission computed tomography with transmission computed tomography (SPECT/CT) scan of radiolabel distribution (SPECT, color scale) in the distal gastrointestinal tract with anatomic reference to pelvis and spine (CT, amber scale).
Comparison of D min for Tc and In for RF, p = 0.004, and RGVF, p = 0.002.
The coccyx is the reference point for all the distance variables above.
D max, furthest point where radiosignal was detected; DC max, distance at maximum concentration; D ave, mean residence distance; D min, distance associated with the most distal signal.
Adjusted for the mass of the HIV surrogate in each voxel, 86% (SD 0.19) of the HIV surrogate was colocated with the drug surrogate; without the mass adjustment (simply comparing coincident radiolabel voxel by voxel, regardless of the amount in each voxel), the mean percentage coverage goes down to 36.2% (SD 0.13). There was no statistically significant difference in percent coverage of the HIV surrogate among the three gel formulations using either colocalization method.
Mucosal permeability
Plasma 111In-DTPA PK
In the absence of simulated RAI, the dose-adjusted median C max for VF was 34-fold and 7-fold higher than RF and RGVF, respectively (p = 0.006 and 0.02) (Table 5a). A larger difference was noted with AUC, with VF 234-fold and 26-fold higher when compared to RF and RGVF, respectively (p = 0.005 and 0.02). The median C max and AUC, larger for RGVF compared to RF, nearly achieved statistical significance (p = 0.06 and 0.08, respectively).
111
Comparison of C max for SURAI vs. no SURAI for RF formulation: p = 0.03.
SURAI, simulated unprotected receptive anal intercourse.
With simulated RAI, a similar pattern was noted with the dose-adjusted median C max for VF being 7-fold and 8-fold higher than RF and RGVF, respectively (p = 0.02 and 0.03). The median AUC for VF was 63 times and 32-fold higher than RF and RGVF (p = 0.02 for both). There was no difference in AUC between RF and RGVF. There was also no statistically significant difference in regard to permeability T max among the three products, with or without simulated RAI.
Comparing the permeability of the PK parameters in the presence and absence of simulated RAI for each product, there was a pattern of numerically higher median C max and AUC for all three products with coital simulation; however, only the median C max for RF, compared to with and without simulated RAI, reached statistical significance, with a 9-fold increase in C max with coital simulation (p = 0.03). We also found a significant linear correlation (r = 0.83, p < 0.001) between plasma TFV concentration and plasma 111In-DTPA (Fig. 5a).

Correlation between radiolabeled small molecule surrogate, 111In-DTPA peak concentration in blood plasma
Urine 111In-DTPA PK
In the absence of simulated RAI, the maximum observed excretion rate for VF was 6.6 times and 3.2 times higher than RF and RGVF (p = 0.016 and 0.046) (Table 5b). The area under the urinary excretion rate curve (AURC) for VF was 5 times and 2.7 times higher than RF and RGVF, respectively (p = 0.01 and 0.03). The percent of 111In-DTPA recovered in urine for VF was also significantly higher for VF as compared to the RF and RGVF, 1.75 times and 4.7 times higher, respectively (p = 0.046 and 0.009).
111
SURAI, simulated unprotected receptive anal intercourse; Max rate, maximum observed excretion rate; AURC, area under the urinary excretion rate curve from 0 to last measurable rate; % recovered, percent of initial dose of 111In-DTPA recovered in the urine.
With simulated RAI, similar results were seen with a 2.8 times and 7.25 times higher maximum observed excretion rate for VF as compared to RF and RGVF, respectively (p = 0.036 and 0.021). The AURC for VF was 2.8 times, and 5.8 times higher than RF and RGVF, respectively (p = 0.027 and 0.016). In addition, the percent of drug surrogate recovered for VF in urine was higher than RF and RGVF by 1.75-fold and 4.7-fold, respectively (p = 0.046 and 0.009).
There was no difference noted between the maximum observed excretion rate, area under the urinary excretion rate curve, or percent recovery of the 111In-DTPA from the urine when comparing the RF and RGVF. Among and between products, there was no statistical difference between median maximum excretion rate, AURC, and percent recovered from urine when comparing values in the presence and absence of simulated RAI. There was a significant correlation between plasma TFV concentration and percent urine recovery of 111In-DTPA (r = 0.92, p < 0.001) (Fig. 5b).
Discussion
The CHARM-02 study showed that a single rectal dose of the three TFV gel formulations under study was safe as there was no Grade 3 or 4 toxicity reported. However, minor AEs were more common with VF as compared to the RGVF and RF. Similar results were observed in the companion study, CHARM-01, with VF accounting for 48% of reported AEs in the entire study, despite only one VF dose being administered, compared to seven consecutive doses of each for RF and RGVF. 23
Systemic TFV exposure was greater following VF dosing compared to the other formulations without simulated RAI, but depended on which PK parameter was compared. With the VF formulation, TFV C max was 6-fold higher and twice as rapid when compared to RF in the absence of simulated RAI. TFV AUC was 3.8-fold higher with VF than RGVF. RGVF also achieved higher peak concentrations than RF. This general trend of greater systemic exposure correlating with increased osmolality is seen to an even greater extent with permeability for DTPA (discussed below). With simulated unprotected RAI, these patterns generally persisted, but lost statistical significance. As simulated unprotected RAI generally increased the permeability of TFV and DTPA, this may have had a leveling effect on the differences seen without RAI. Also, plasma TFV correlated with the 111In-DTPA permeability estimates, though TFV permeability was of a much smaller magnitude compared to DTPA. The difference could be partly attributed to the relatively poor bioavailability of the charged TFV molecule relative to DTPA. The high correlations for DTPA permeability measurements and plasma TFV concentration suggest that 111In-DTPA can serve as a reasonable model for permeability measurement for TFV.
Imaging of the drug surrogate in the absence of simulated unprotected RAI revealed a significantly higher colonic mucosal distribution (D max and D ave) of VF when compared to RF and RGVF. This may best be explained by the far greater osmolality of VF, which draws significantly more fluid into the colonic lumen, thus increasing the spread of the radiolabel after dosing relative to the lower osmolality RGVF and RF formulations. It is noteworthy that RF and RGVF were not different in their luminal distribution in the colon.
Our weighted dual isotope analysis showed that 86% of the viral surrogate was colocated or “covered” by the drug surrogate and was not different among the formulations. We believe this to be a critically important variable since the goal of rectal microbicide development is to develop a formulation that can outdistance and outlast HIV. This dual isotope analysis reflects a high degree of concordant drug-HIV distribution within the lumen, but it does not assess mucosal coverage, per se, given the resolution of the radiographic method. Animal studies using fluorescent labeling and histologic imaging enable a more direct assessment of mucosal coverage. 34 These studies indicate optimal mucosal coverage with isoosmolar and slightly hypotonic products. Finally, none of these methods addresses diffusion of drug or HIV into the mucosal tissue over time.
The striking difference in mucosal permeability among the study gels was evidenced by the plasma and urine concentration of the drug surrogate (111In-DTPA). Plasma C max and AUC of the drug surrogate for VF were greater than 30-fold and 200-fold, respectively, when compared to the RF, in the absence of simulated RAI. Statistically significant, but smaller magnitude differences were seen for RGVF compared to VF. RGVF trended toward values greater than RF. Similar patterns were seen with simulated RAI. These DTPA permeability differences are consistent with the osmolality differences among the study products. Generally, for both TFV and DTPA colonic mucosal permeability, the greater the osmolality, the greater the systemic exposure: VF > RGVF > RF. This suggests that the predominant effect of the hyperosmolar gels was increased colonic mucosal permeability, which more than counterbalanced the competing physiologic effect of increased fluid from colon tissue into the colonic lumen with higher osmolarity products. In addition to osmolality, there may be other differences between products (e.g., pH and viscosity) that contributed to the results, although given the size of the compartment and the rectum's ability to buffer pH, such contributions are presumed to be minimal. 35 It is notable that there are not more consistent differences between the RGVF and RF given the nearly 2-fold difference in osmolality. This may be due, in part, to mitigation of some anticipated mucosal integrity-related differences by offsetting hyperosmolarity-related fluid fluxes into the colonic lumen.
Since we did not assess histologic damage or HIV infectivity, we cannot determine if these permeability differences increase HIV infection risk. Our previously published works with hyperosmolar sexual lubricants and hyperosmolar enemas are consistent with our CHARM-02 permeability observations. 36,37 Unlike CHARM-02, both of those earlier studies included colon biopsies and both demonstrated greater loss of the colonic single columnar epithelial layer associated with very high osmolality products—2,100 mOsmol/kg Fleet enema 36 and 3,429 mOsmol/kg commercial sexual lubricant 37 —when compared to isoosmolar controls.
Hence, a significant limitation of the current study is that no biopsies were obtained; therefore histologic toxicity, tissue PK, and susceptibility to ex vivo HIV infection were not assessed. Other than inferring the potential mucosal alteration based on the TFV and drug surrogate concentrations in plasma and urine, there was no histological examination performed to evaluate structural changes in the mucosa. The companion study, CHARM-01, included intensive safety analyses, which included histology, microbiology, and susceptibility to ex vivo HIV infection. We chose not to perform intraluminal manipulations to capture biopsies given our primary goal of assessing colonic luminal drug and HIV surrogate distribution, both of which we wanted to assess unperturbed by endoscopic instrumentation.
VF is no longer under development as a rectal microbicide given the adverse effect profile and safety concerns with rectal use, some of which are reinforced in this study. The incorporation of simulated RAI in CHARM-02 proves critical in the comparison of the novel RF formulation being compared to RGVF for the first time in CHARM-01 and CHARM-02. CHARM-02 demonstrated that although RGVF demonstrated greater plasma TFV concentrations and a trend toward greater mucosal permeability compared to RF, these differences disappeared with simulated RAI. Furthermore, RGVF and RF had a similar, excellent codistribution of drug and HIV surrogates. Of note, there were slightly more frequent minor AEs reported in the RGVF group compared to RF, but these differences were not statistically significant. On the basis of these observations and the CHARM-01 findings, we do not find a compelling advantage of RF over RGVF. There are two ongoing clinical studies of the RGVF formulation, PROJECT GEL and MTN-017. The results of these studies, especially MTN-017, which is an international, multicenter phase II trial, will inform the potential benefit and future development of rectal microbicides.
Footnotes
Acknowledgments
The authors would like to thank the study participants for their willingness to participate, and the Johns Hopkins drug development unit (DDU) and the Johns Hopkins clinical pharmacology analytical laboratory (CPAL) team members for their support of the study.
The study was funded by a U19 grant under the Integrated Preclinical-Clinical Program for HV Topical Microbicides (IPCP-HTM), Division of AIDS, National Institute of Allergy and Infectious Diseases, National Institutes of Health (NIH) (AI082637). This project has also been funded in part with federal funds from the National Institute of Allergies and Infectious Diseases, National Institutes of Health, Department of Health and Human Services, under contract no. HHSN272200800014C.
The CHARM-02 study was registered at clinicaltrials.gov (NCT01575418).
Author Disclosure Statement
No competing financial interests exist.
References
Supplementary Material
Please find the following supplemental material available below.
For Open Access articles published under a Creative Commons License, all supplemental material carries the same license as the article it is associated with.
For non-Open Access articles published, all supplemental material carries a non-exclusive license, and permission requests for re-use of supplemental material or any part of supplemental material shall be sent directly to the copyright owner as specified in the copyright notice associated with the article.