
Abstract
Control of HIV replication through CD4+ and CD8+ T cells might be possible, but the functional and phenotypic characteristics of such cells are not defined. Among cytokines produced by T cells, CCR5 ligands, including macrophage inflammatory protein-1 beta (MIP-1β), compete for the CCR5 coreceptor with HIV, promoting CCR5 internalization and decreasing its availability for virus binding. Interferon (IFN)-γ also has some antiviral activity and has been used as a read-out for T cell immunogenicity. We used cultured ELISpot assays to compare the relative contribution of MIP-1β and IFN-γ to HIV-specific responses. The magnitude of responses was 1.36 times higher for MIP-1β compared to IFN-γ. The breadth of the MIP-1β response (45.41%) was significantly higher than IFN-γ (36.88%), with considerable overlap between the peptide pools that stimulated both MIP-1β and IFN-γ production. Subtype A and D cross-reactive responses were observed both at stimulation and test level, but MIP-1β and IFN-γ responses displayed different effect patterns. We conclude that the MIP-1β ELISpot would be a useful complement to the evaluation of the immunogenicity of HIV vaccines and the activity of adjuvants.
Introduction
I
HIV requires a CD4 protein on the cell surface and a chemokine receptor, such as CCR5 for the predominantly R5 tropic transmitting virus and less often CXCR4 to fuse with the cell membrane and insert its genetic components into the cell. CC chemokines including macrophage inflammatory protein-1 beta
CD8 T cells, the major producer of MIP-1β, are able to exert pressure on virus replication early in HIV and simian immunodeficiency virus (SIV) infection as shown by the presence of SIV-specific CD8 T cells during SIV infection, 16,17 leading to decreased viral replication in rhesus macaques and the evolution of mutations at well-defined CTL epitopes, allowing escape from recognition. 15,18 –24
MIP-1β-producing CD8 T cells are associated with nonprogression to disease 25,26 and beta chemokines including MIP-1β suppress transcription of the LTR of the HIV-1 provirus. 27 MIP-1β, MIP-1α, and RANTES have been shown to be effective at controlling R5 tropic HIV replication in vitro. 28 MIP-1β and MIP-1α production by CD8 T cells correlates with asymptomatic HIV-1 infection 26 and CD8 cells producing MIP-1β and active in HIV inhibition assays are present in virus controllers and vaccinees. 14 In addition, successful highly active antiretroviral therapy (HAART) is associated with high beta chemokine levels in chronic HIV-1-infected individuals. 29
In view of these indications of a potential role of MIP-1β in HIV-1 control we compared the breadth and relative magnitude of MIP-1β and IFN-γ responses and evaluated possible associations of these responses to plasma viral load in initial phases of HIV infection. In addition, the effect of subtype of the peptides used in expansion of cells in culture on the breadth and magnitude of MIP-1β and IFN-γ response measured using ELISpot was also investigated.
Materials and Methods
Human subjects
The study was approved by the ethical committees of the Uganda Virus Research Institute and Uganda National Council for Science and Technology. All the subjects involved provided written informed consent to participate in the study.
One hundred and fifty-six serodiscordant couples identified at the AIDS information center in Kampala were enrolled in a prospective cohort from November 2006 to November 2009. p24 antigen ELISA and anti-HIV antibody ELISA were performed every 3 months for the HIV-negative partner. Four partners who tested positive for either of the tests were recruited into the Medical Research Council/Uganda Virus Research Institute, Uganda Research Unit on AIDS acute/early HIV-infected cohort (Rubicon). Ten individuals who were found to be seropositive within 12 months of the last documented seronegative test and who had a confirmatory HIV antibody ELISA test done were also recruited into the Rubicon cohort. Seven of the 14 participants with confirmed HIV-1 seroconversion and for whom we had collected sufficient peripheral blood mononuclear cells (PBMCs) were used in this study. Five were males and two were females. All the participants reported no use of antiretroviral therapy (ART) in the course of the study and were infected as a consequence of heterosexual transmission. At screening, two participants, 9004 and 9009, tested positive for p24 antigen ELISA and negative for HIV antibody enzyme immunoassay (EIA). Samples collected from 9004 and 9009 at enrollment (14 and 10 days respectively after screening) were positive for antibody EIA.
The time of infection was estimated as the midpoint between the date of the last documented seronegative test and the date of the first positive p24 and/or antibody serology. When the time between the estimated time of infection and the first HIV-positive p24 and/or serology was 6 months or less, individuals were followed monthly until the sixth month, then every 3 months until the twelfth month, and finally every 6 months until month 24. The Vironostika HIV-1 antigen kit (Biomérieux, Boxtel, Netherlands) was used for p24 testing and Vironostika HIV Uni-Form II plus O kit (Biomérieux, Boxtel, Netherlands) and Murex HIV-1.2.0 kit (Abbott, Dartford, United Kingdom) were used for the HIV antibody ELISA.
Plasma viral loads were determined using the Roche Amplicor HIV-1 Monitor test version 1.5 (Roche, Nutley, NJ) assay (limit of detection: 400 copies/ml) or Bayer bDNA (limit of detection: 50 copies/ml). CD4+ cell counts were determined using FACS Count (Beckton-Dickinson, Franklin Lakes, NJ). The characteristics of the selected individuals including sex, age, HIV-1 subtype, and Fiebig staging at enrollment are shown in Table 1.
M, male; F, female.
Determined at screening.
A or D subtype based on gag gene sequences; N/D, not determined.
Results from HIV third generation antibody ELISA and Western blot on plasma samples collected at enrollment were used retrospectively to determine Fiebig staging.
Participants with no p31 band or weak (1) p31 band on Western blot at enrollment were annotated as ‘‘acute’’ and those with strong (2, 3, 4) p31 band at enrollment were attributed as ‘‘early.’’
Fiebig staging
HIV antibody ELISA (Bio-Rad Genetic Systems HIV-1/HIV-2 PLUS O EIA Kit) and HIV-1 Western blot (Bio-Rad Genetic Systems) were retrospectively done on plasma samples collected at enrollment. Data from the ELISA and Western blot experiments were used in Fiebig staging. 30
Peptides
A set of 124 Gag A1 and Gag D 17-mer consensus HIV peptides overlapping by 10 amino acids (covering the full gag protein sequence) was synthesized using 9-fluorenylmethoxycarbonyl chemistry and standard-based solid phase techniques (Natural and Medical Sciences Institute, University of Tubingen, Tubingen, Germany). The estimated purities of 78% of the peptides were >70% as measured by mass spectrometry. Individual peptides were dissolved in DMSO (Sigma) and pooled. A peptide pool matrix was designed using Deconvolute This! Version 1.2 (Mario Roederer, Vaccine Research Centre, NIAID, NIH). 31 Each peptide pool had a maximum of 20 peptides. A total of 23 peptide pools (12 subtype A and 11 subtype D consensus) were tested in ELISpot assays. Two larger pools including all peptides of subtype A or D were used for stimulations of short-term T cell line (STCL) cultures.
PBMCs and STCLs
PBMCs were isolated from acid citrate dextrose anticoagulated blood by Ficoll-Hypaque density gradient centrifugation, cryopreserved in 90% heat-inactivated fetal bovine serum (FBS) (Sigma) plus 10% DMSO (Sigma), and stored in liquid nitrogen. Frozen PBMCs were thawed and rested in RPMI 1640 (Sigma) containing 20% heat-inactivated FBS, HEPES (Sigma),
Monocyte-depleted PBMCs were cultured in 10% heat-inactivated human AB serum (Sigma), RPMI 1640 (Sigma), HEPES (Sigma),
Cultured ELISpot
Ninety-six-well polyvinylidene difluoride plates (MAIPS 4510; Millipore) were coated with 10 μg/ml of antihuman MIP-1β monoclonal antibody (mAb) and MIP1b-I and antihuman IFN-γ 1-D1K monoclonal antibodies (Mabtech, Stockholm, Sweden) on either half of the plate and kept at +4°C for 16–20 h. This split plate design was used to minimize interplate variation. The ELISpot plates were washed with 1 × PBS and blocked using RPMI 1640 (Sigma) containing 10% heat-inactivated FBS, HEPES (Sigma),
Phytohemagglutinin at 5 μg/ml and a peptide pool of influenza, Epstein–Barr virus, and cytomegalovirus at 1.5 μg/ml were used as positive controls and 0.45% DMSO in medium was used as the negative control. The plates were incubated overnight at 37°C, 5% CO2. Biotin-conjugated secondary monoclonal antibodies MIP1β-II and 7-B6-1 (Mabtech, Stockholm, Sweden) were added after removing the cells and washing the plates with 1 × PBS. The plates were then incubated for 1 h at room temperature. A 1 μg/ml solution of streptavidine-alkaline phosphatase conjugate (Mabtech, Stockholm, Sweden, Catalog no. 3310-10) was added and incubated for an additional hour. A solution of 5-bromo-4-chloro-3-indolyl phosphate and nitroblue tetrazolium substrate (Bio-Rad Catalog no 170-6432) was added and the plate was incubated in the dark at room temperature for a maximum of 20 min. The reaction was stopped by washing with copious amounts of distilled water.
The developed ELISpot plates were read using an automated AID ELISpot reader (AID-Autoimmune Diagnostika GMBH) using the following parameters: minimum intensity 5, minimum size 10 and maximum size 295, minimum gradient 1, emphasis small, and algorithm C (ELISpot software version 4.0). The automated counts were checked and edited manually if necessary.
Cultured ELISpot made it possible to maximize the number of peptide pools that could be tested for a given initial number of PBMCs and provided enhanced sensitivity compared to the ex vivo ELISpot. 33,34
Sequencing and phylogenetic analysis
Proviral DNA was extracted from whole blood using the QIAGEN whole blood extraction kit following the manufacturer's instructions and stored at −20°C. Hot start nested PCR reactions were used for the amplification of HIV-1 gag DNA fragments of about 1.7 kbp using primers 5′-TCT CTA GCA GTC GCG CCC G-3′ and 5′-AAT TCC TCC TAT CAT TTT TGG-3′ for primary PCR and 5′-CTC TCG ACG CAG GAC TCG GCT T-3′ and 5′-TCT TCT AAT ACT GTA TCA TCT GC-3′ for secondary PCR. PCR products of approximately 1.7 kbp were purified and bidirectionally bulk sequenced using six overlapping primers. Sequences generated from the experiment were aligned together with subtype reference sequences in Clustal X and nonaligned sections were deleted. Phylogenetic trees were constructed using the neighbor joining method and the reliability of branching was determined by 1,000 bootstrap values. HIV subtype was attributed when the participant sequences were within the same node as the subtype reference sequence.
ELISpot response scoring and statistical analysis
The magnitude of response was defined as the number of spot-forming units (SFU) per million STCLs. An STCL response to a peptide pool was considered positive if the SFUs normalized to input cells (SFU/million STCLs) were ≥3 times those of the corresponding negative control and greater than 25 SFU/million STCLs. McNemar's χ2 test was used to compare the proportion of peptide pools that stimulated MIP-1β and IFN-γ production, i.e., to compare the breadth of response between MIP-1β and IFN-γ. Paired t-tests on the (natural) log of the response were used to compare the relative magnitude of the response between MIP-1β and IFN-γ.
Generalized linear mixed models (GLMMs) were used to examine the association between log10 viral load (as response variable) and the breadth and relative magnitude of MIP-1β and IFN-γ, as explanatory variables, adjusting for the estimated number of days post-HIV infection and allowing for participants as random effects. GLMM were also used to examine the effect of participant HIV-1 subtype, the subtype of the gag peptide used in culture, and the peptide pool subtype used in the stimulation of STCLs on the relative magnitude (log-transformed) of the MIP-1β and IFN-γ response, adjusting for the estimated number of days post-HIV infection and allowing for participants as random effects. The models explored the effect of the three factors, allowing for the inclusion of any of the three possible two-way interactions and the three-way interaction.
The reported models retained all three main effects and any two-way interactions that were significant at the nominal 5% level, as well as the three-way interaction if this was significant at the 5% level (in which case all two-way interactions were also retained). Similar GLMMs were fitted to examine the effect of the three factors on whether or not there was a response to MIP-1β and IFN-γ, respectively (i.e., the breadth of response).
Results were considered to be statistically significant at the nominal 5% level. Statistical analysis was done in STATA version 11 (Texas, College Station, TX). Graphs were produced using Graphpad prism version 6.00 (La Jolla, CA).
The accession numbers for the sequences used in the phylogenetic analysis are KT825896, KT825897, KT825898, KT825899, KT825900, KT825901, KT825902, KT825903, KT825904, KT825905, KT825906, KT825907, KT825908, KT825909, KT825910, KT825911, and KT825912.
Results
Course of viremia and CD4 counts in the acute/early phase of HIV infection
Considerable heterogeneity with respect to patterns of change over time in plasma viral load and CD4 count trajectories was observed (Fig. 1).
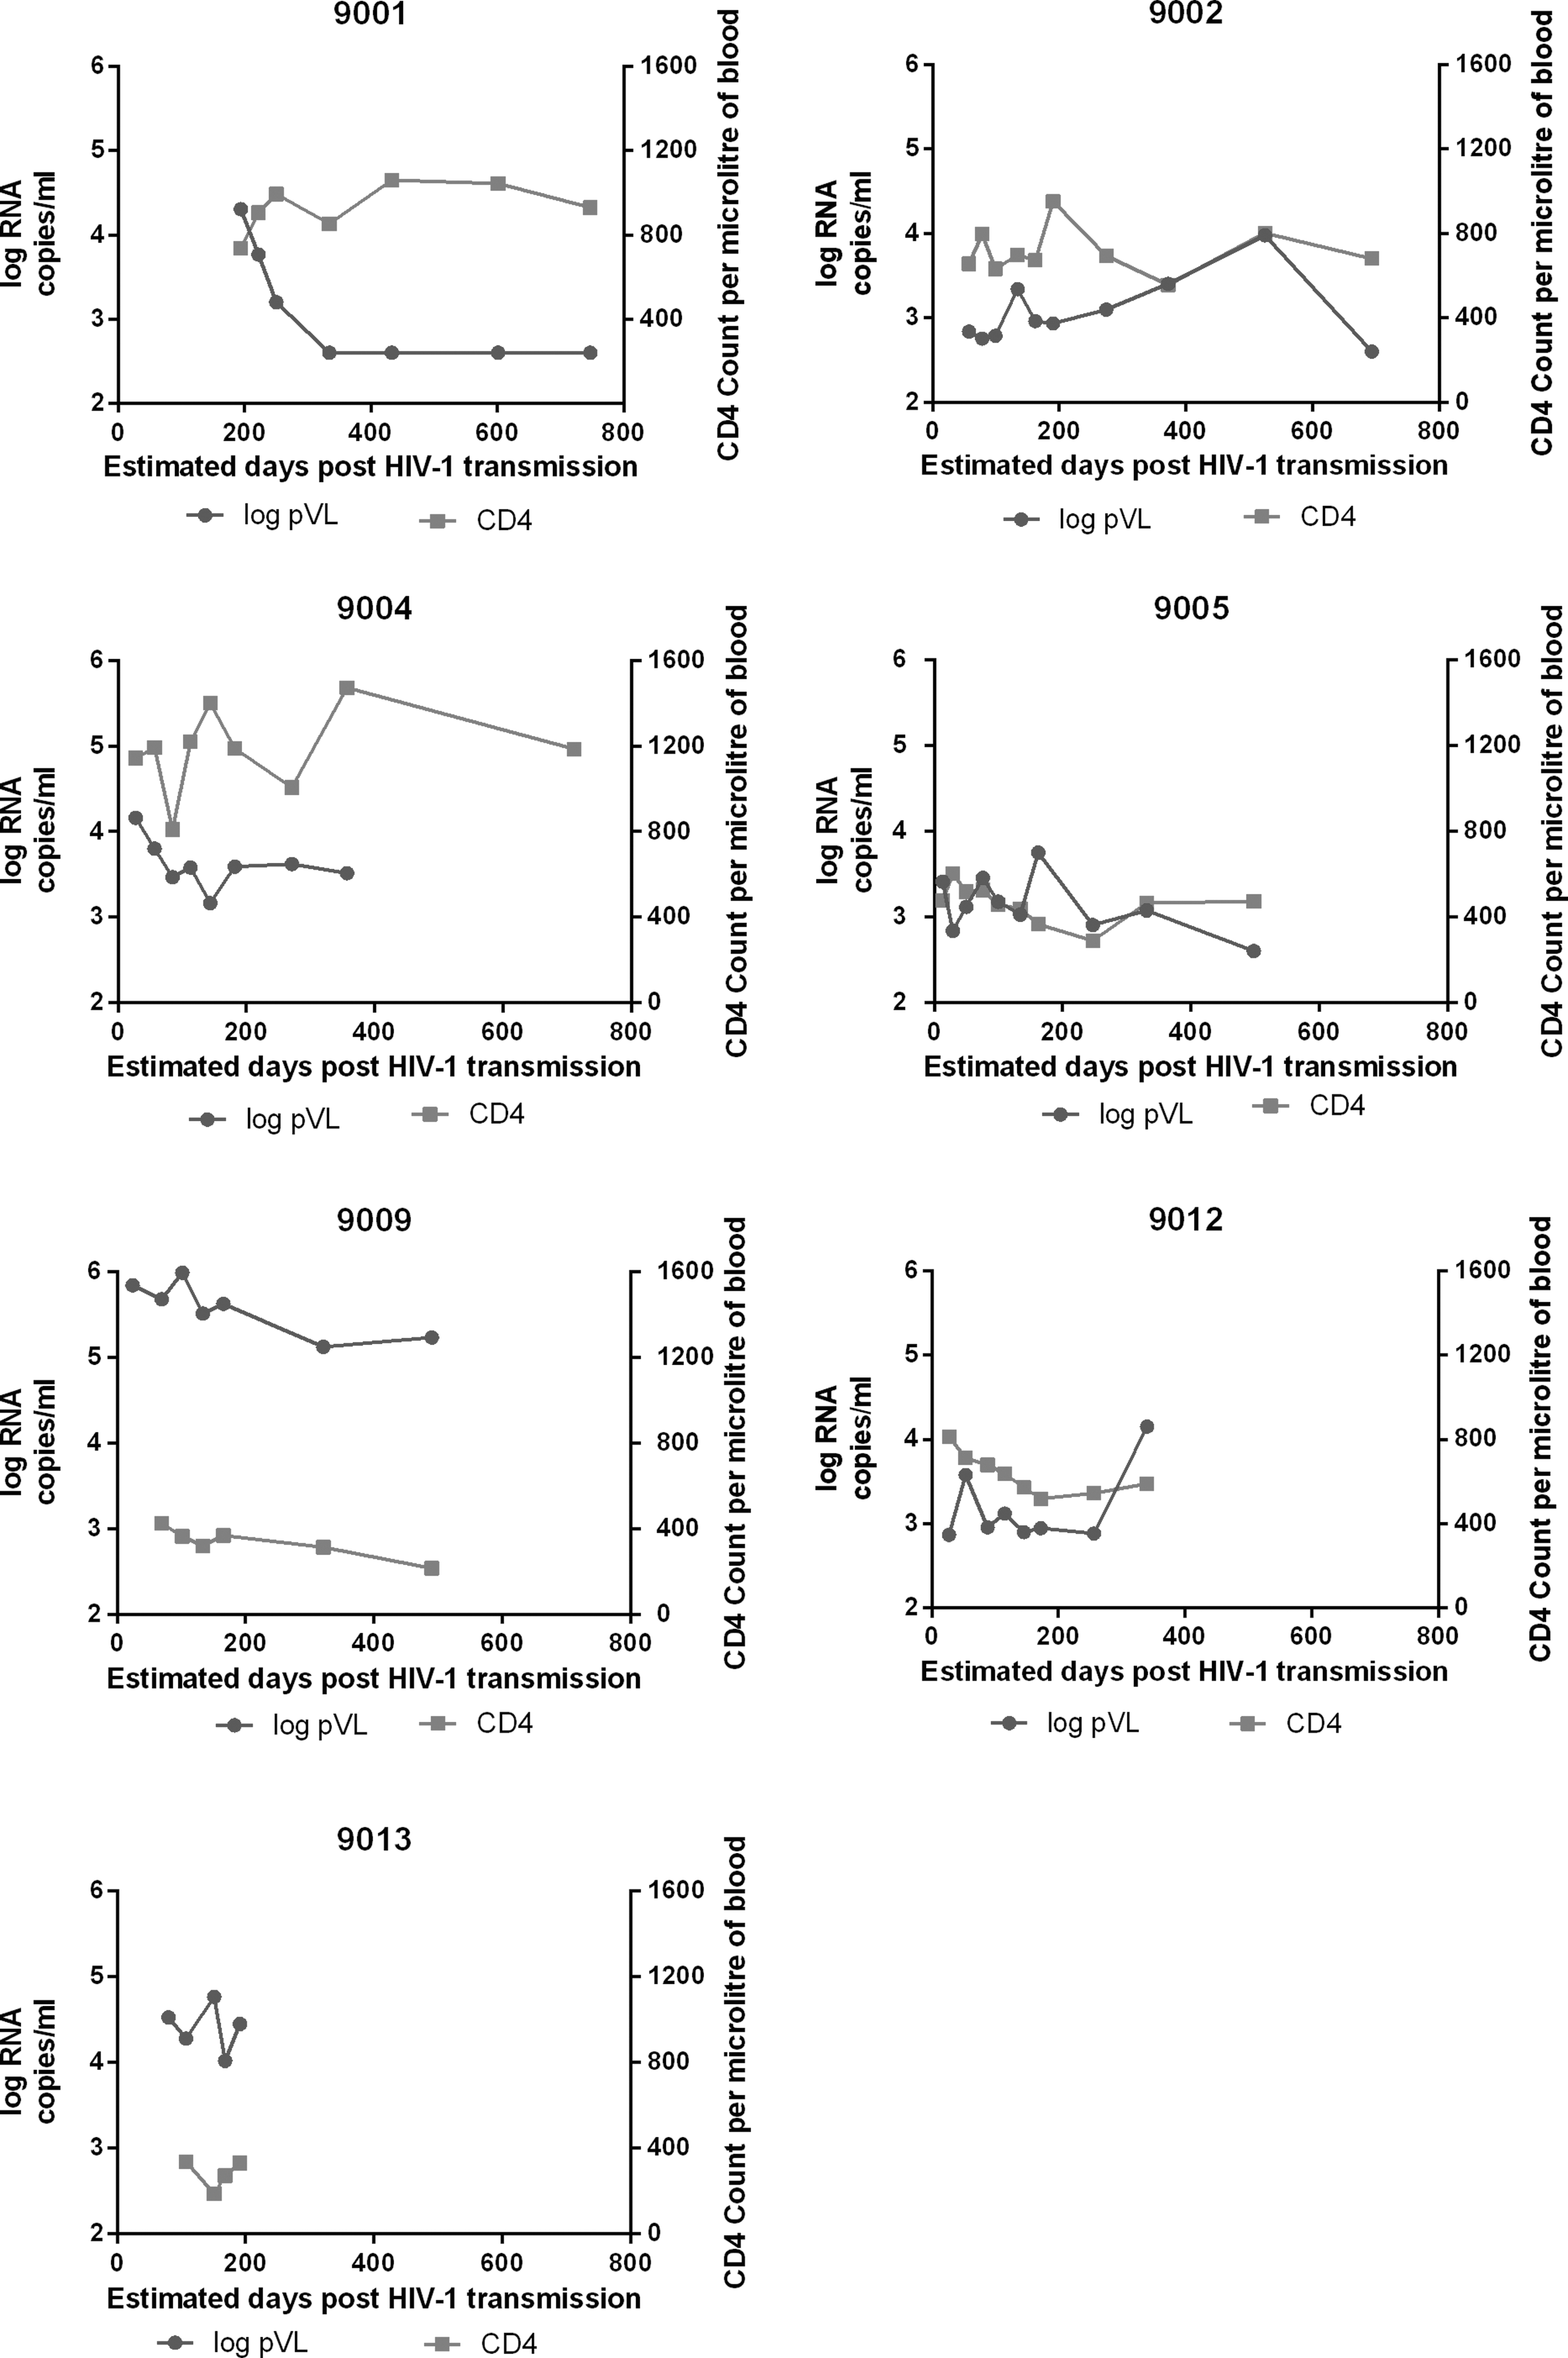
Trajectories of HIV-1 plasma viral load and CD4 counts for 9001, 9002, 9004, 9005, 9009, 9012, and 9013 participants. In light gray is CD4 count per microliter of blood and in dark gray is log10 RNA copies per ml of plasma. The detection limit for viral load was 400 RNA copies per ml of plasma, except for the first five time points of 9001, where the detection limit was 50 RNA copies per ml of plasma.
Within 6 months of enrollment participant 9001 achieved viral control below 1000 c/ml in the absence of ART and with preserved CD4 counts. Participant 9002 had a relatively constant, low plasma viral load and wide oscillations in CD4 cell counts. Participant 9004 had a decline in plasma viral load slower than 9001, settling on a set point of ∼104 c/ml with wide swings in CD4 counts. Participant 9005 had a slow decline in plasma viral load and CD4 cells. Participant 9009 had a high viral load at enrollment and remained above 105 c/ml throughout follow-up, with a steady loss of CD4 cells. Participant 9012 had a relatively low plasma viral load set point at enrollment (103 c/ml), with an initially rapid decline in CD4 cells; later CD4 counts stabilized at >500 but this was accompanied by a ∼10-fold increase in viral load. Participant 9013 was enrolled with a viral load >104 c/ml and 338 CD4 cells/μl. Over the 4-month follow-up viral load dropped below 103 c/ml but CD4 counts remained <350 CD4 cells/μl (Fig. 1). Individuals were different in viral load trajectories, CD4 counts, and rate of decrease of CD4 counts. We wanted to investigate which aspects of the T cell response might correlate best with this heterogeneity. Therefore we decided to measure both IFN-γ and MIP-1β responses to HIV-1 antigens.
MIP-1β breadth of response higher than IFN-γ breadth of response
PBMCs from each individual were stimulated with 23 Gag peptide pools and we determined the proportion of pools that stimulated production of MIP-1β (breadth of MIP-1β response) or IFN-γ (breadth of IFN-γ response).
The MIP-1β response was significantly broader than the IFN-γ response, with an MIP-1β response in 45.4% of the peptide pools compared to an IFN-γ response in 36.9% of the peptide pools (McNemar's χ2 15.70 on 1 d.f., p < 0.0001). An examination of the consistency of the results over study participants found that four of the seven participants had a significantly broader MIP-1β response compared to IFN-γ (3/3 acute and 1/4 early infections), while two had nonsignificantly broader MIP-1β responses and one had nonsignificantly broader IFN-γ responses (Table 2).
Time points (days) on which peripheral blood mononuclear cells were available for use in the cultured ELISpot assays.
Breadth is expressed as the fraction of 23 peptide pools tested that stimulated macrophage inflammatory protein-1 beta (MIP-1β) or interferon-γ (IFN-γ) production at any of the indicated time points. p-values ≤0.05 correspond to significant differences in the breadth of MIP-1β or IFN-γ responses (McNemar's χ2 test).
We then compared the frequency of recognition of each peptide pool that stimulated the production of either MIP-1β or IFN-γ only or both MIP-1β and IFN-γ or neither MIP-1β nor IFN-γ. Gag A1-3, Gag A1-9, and Gag D-9 peptide pools were the main inducers of concomitant MIP-1β and IFN-γ responses (Fig. 2).
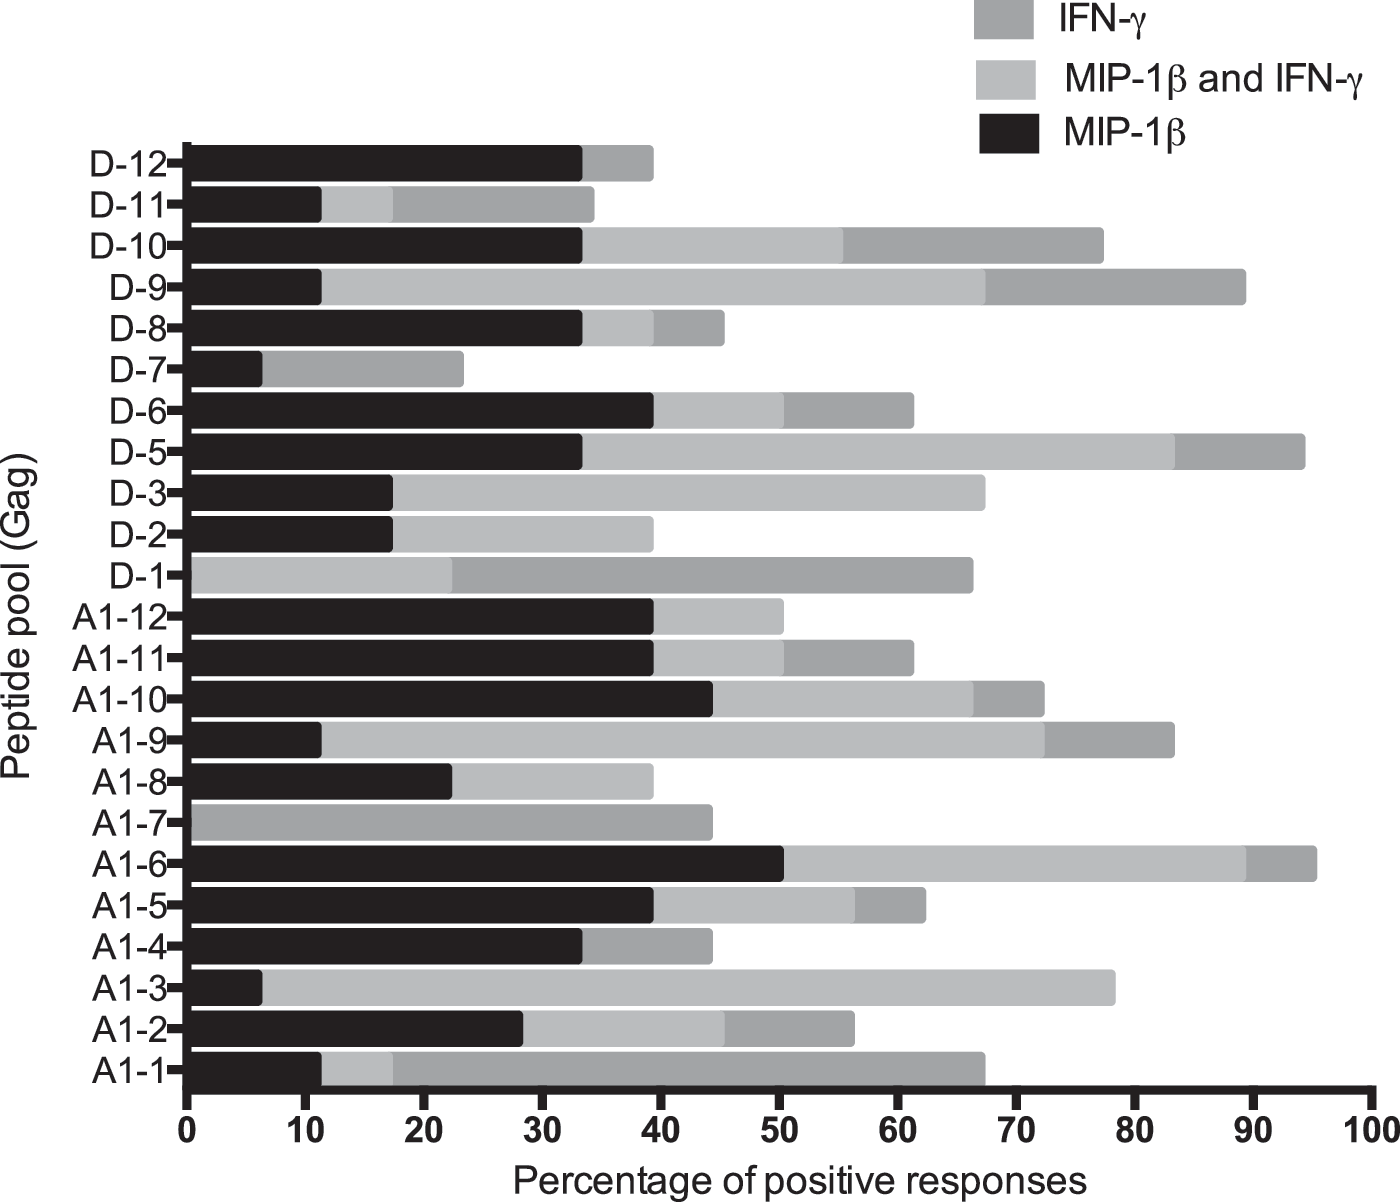
Proportion of macrophage inflammatory protein-1 beta (MIP-1β) and/or interferon-gamma (IFN-γ) responses induced by individual subtype A and D Gag peptide pools. Cultured ELISpot assays were done using peripheral blood mononuclear cells (PBMCs) from three acute and four early HIV-1-infected individuals. For each peptide pool, the percentages of SFU/million short-term T cell lines (STCLs) scored as positive MIP-1β and/or IFN-γ responses are shown.
Magnitude of MIP-1β and IFN-γ responses
The magnitude of response to a peptide pool reflects the frequency of T cells specific for a given epitope in a pool and the number of epitopes recognized within the peptide pool. We compared the relative magnitude of MIP-1β and IFN-γ responses using a paired t-test on the (natural) log-transformed value of the response. The relative magnitude of the MIP-1β response was 1.36 times higher than the relative magnitude of the IFN-γ response (95% CI: 1.24–1.49; Supplementary Table S1; Supplementary Data are available online at
Because peptide pools could stimulate production of either MIP-1β or IFN-γ only or both (Fig. 2), we compared the relative magnitude of response between MIP-1β and IFN-γ for peptide pools that stimulated production of both MIP-1β and IFN-γ. The relative magnitude of the IFN-γ response was 1.14 times higher than the magnitude of the MIP-1β response (Supplementary Table S1). Two participants (9001 and 9005) significantly contributed to the difference in magnitude of the IFN-γ response (Supplementary Table S1).
Fluctuations in magnitude of MIP-1β and IFN-γ responses with time of infection
We then compared the median magnitude of the MIP-1β and IFN-γ response at enrollment and 200 days postestimated HIV-1 transmission date for acute and early HIV-infected participants. At enrollment, the acute HIV-infected participants had a higher median magnitude of the MIP-1β response than the median magnitude of IFN-γ, whereas early HIV-infected participants had a lower median magnitude of the MIP-1β response than the median magnitude of the IFN-γ response (Fig. 3A and C). These differences were not statistically significant. The median magnitude of the MIP-1β response between the acute and early HIV-infected participants at enrollment was relatively constant (708 and 1043 SFU/106 STCLs, respectively); however, the median magnitude of the IFN-γ response for the early HIV-infected participants was about four times (1182 and 296.7 SFU/106, respectively) that of the acute HIV-infected participants (Fig. 3A and C).
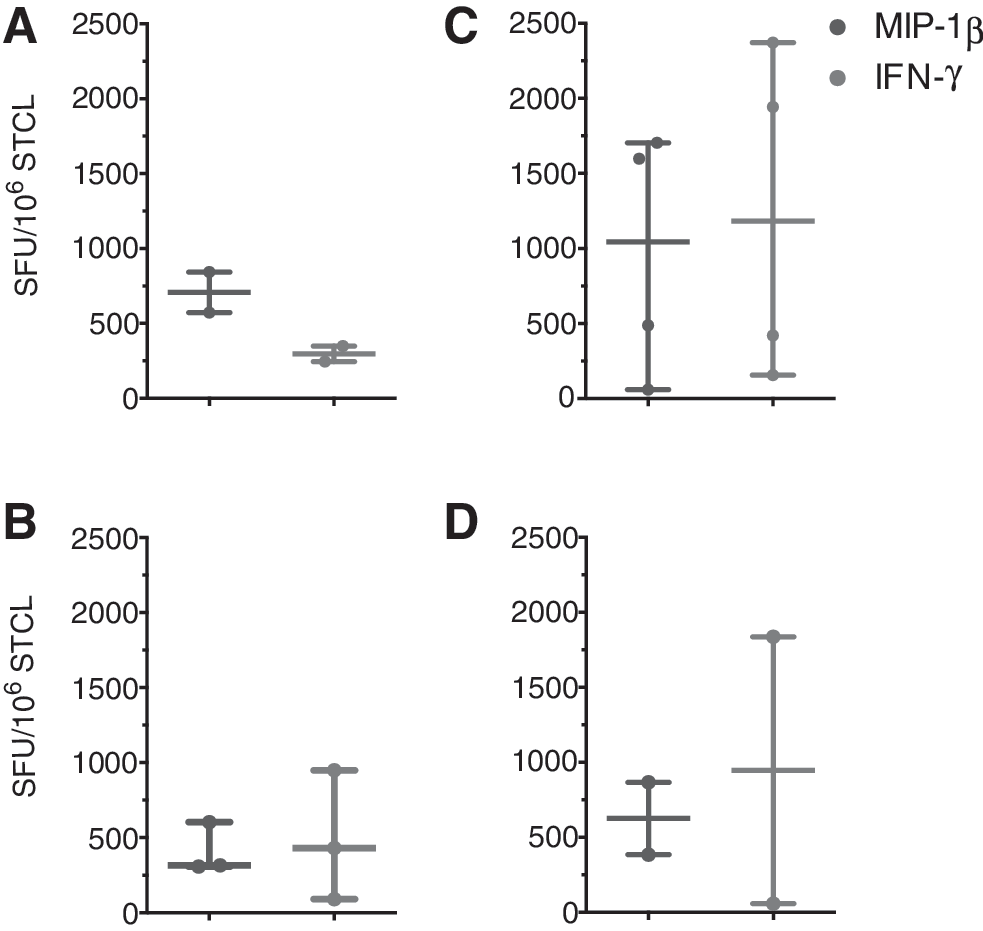
Temporal changes in magnitude of MIP-1β and IFN-γ responses to Gag subtype A and D Gag peptide pools obtained from cultured ELISpot assays. Plot showing the MIP-1β and IFN-γ response in SFU/million STCLs over the complete set of subtype A and D peptide pools calculated at enrollment
We next compared the median magnitude of the MIP-1β and IFN-γ response at enrollment and at 200 days postestimated HIV-1 transmission date. The median magnitude of the MIP-1β response of the participants recruited at acute HIV infection decreased (from 708 to 305 SFU/106 STCLs) and that of IFN-γ increased (from 297 to 421 SFU/106 STCLs; Fig. 3A and B), whereas the median magnitude of MIP-1β and IFN-γ concurrently decreased in early HIV infected participants (from 1043 to 625 SFU/106 STCLs for MIP-1β and from 1182 to 947 SFU/106 STCLs for IFN-γ; Fig. 3C and D).
Cross subtype reactivity of MIP-1β and IFN-γ responses
The availability of PBMCs from participants infected with the two main HIV subtypes circulating in Uganda (A and D) provided an opportunity to compare the impact of subtype mismatch on the recognition of HIV in parallel cultured ELISpot assays by modeling the IFN-γ and MIP-1β magnitude and breadth read-outs as functions of the A or D subtypes at infection, in vitro stimulation, and ELISpot assay.
The results of fitting linear mixed models to examine the effect of participant HIV subtype (infection), the gag peptide pool subtype used in STCL expansion (stimulation), and the subtype of the peptide pool in the ELISpot (test) on the (log-transformed) magnitude of MIP-1β and IFN-γ response, adjusting for the estimated number of days post-HIV infection and allowing for participants as random effects are summarized in Supplementary Table S2. The models explored the effect of the three factors, allowing for the inclusion of any of the three possible two-way interactions and the three-way interaction. Both the days postinfection and three-way interactions did not have a significant effect in the models and were not used in the final analysis.
The main effect on the magnitude of responses was associated with the infection subtype, D resulting in a higher magnitude than A (MIP-1β: 0.474, p = 0.018; IFN-γ: 0.638, p = 0.002). The test subtype also gave significantly higher MIP-1β responses with D than with A (0.262, p = 0.021); however, the IFN-γ responses were not significantly different. The stimulation subtype did not affect the MIP-1β responses significantly, but IFN-γ responses increased significantly with D (0.367, p = 0.003).
There were statistically significant effects for the interaction of infection with stimulation subtype and stimulation with test subtype. These are shown in Supplementary Table S3 as marginal means predicted for the three pairwise interactions. The infection and stimulation interaction showed that stimulation with the same subtype as the infection was associated with higher MIP-1β responses than stimulation with the alternate subtype. Instead, IFN-γ responses were higher for stimulation with the alternate subtype. In the interaction between stimulation and test subtypes, for both MIP-1β and IFN-γ responses, the highest responses were obtained when switching to the alternate subtype for the ELISpot test. There was no significant interaction between the infection and test subtype.
Breadth was modeled as the odds of a response to each subtype. None of the main factors had a significant effect on the breadth of MIP-1β responses; the only significant effect was the interaction of stimulation and test, which indicated lower odds ratios for subtype D stimulation followed by subtype D test (OR: 0.303, p < 0.0001).
The breadth of IFN-γ responses exhibited a significant effect for the infection subtype with the odds of a response being greater for D (OR: 2.90, p < 0.001) and no significant interactions.
Relationship between plasma viral load or CD4 count and breadth and magnitude of MIP-1β and IFN-γ
To investigate whether the viral load or CD4 count trajectory over time depended on either the relative magnitude and breadth of MIP-β or the IFN-γ response, generalized linear mixed models for repeated measures were used. A positive association of log viral load with the magnitude of the MIP-1β response was observed. The log viral load increased by 13 copies/ml for each unit increase in the magnitude of the MIP-1β response (p = 0.003; Supplementary Table S4). A nonsignificant positive association of the log viral load and the magnitude of the IFN-γ response was observed, with the log viral load increasing by 4 copies/ml for each unit increase in magnitude of the IFN-γ response (p = 0.083; Supplementary Table S4).
Adjusting for time since infection and the cytokine responses, there was no evidence of a difference in viral load between subtypes A and D.
In the model of the change in log viral load over time allowing for the breadth of response to MIP-1β and IFN-γ, there was a trend similar to that of the magnitude of response over time (a significant decrease in log viral load), but adjusting for this trend, there was no evidence of an association between log viral load and the breadth of response to either MIP-1β or IFN-γ (Data not shown).
In the model of the CD4 count trajectory we found no evidence of any trend over time, no evidence of HIV subtype effect, and no evidence that the CD4 trajectory depends on either the magnitude or breadth of either MIP-1β or IFN-γ (data not shown).
Discussion
We found a considerable overlap in the breadth and magnitude of the MIP-1β and IFN-γ responses, although the MIP-1β responses were induced by a broader spectrum of peptides than IFN-γ. We also observed that the MIP-1β responses were of a higher magnitude in the initial stages of infection, while the IFN-γ responses increased later on.
Several mechanisms could explain the decline of MIP-1β-producing cells as the HIV infection enters the chronic phase, including apoptosis, 35 pyroptosis, 36 “exhaustion,” 37 cell contraction, 38 or preferential infection and elimination of CD4 T cells. 39 None of these mechanisms appears intrinsically discriminating between IFN-γ and MIP-1β; however, the switchover from MIP-1β predominance early in infection to IFN-γ in chronic infection might be due to the differential feedback regulation of cytokine production as a result of protracted antigenic stimulation, such as mediated by PD-1 or other regulators that are expressed in T cell populations in chronic infections.
Cross-subtype reactivity of T cells induced by HIV has been observed in several studies 40 –42 and its extent might depend on the infecting subtype, 43 an observation with obvious implications for vaccine design. Cross-subtype reactivity has been typically inferred from the mismatch between the infecting subtype sequence and the sequence of the synthetic peptides used to test recognition, i.e., without taking into account the proliferative ability of HIV-specific effectors. We incorporated the evaluation of proliferative ability by using cultured ELISpot assays.
Our experiments had three variables in which the HIV A or D subtype was involved: (1) infecting virus, (2) peptide pool used to expand the STCLs, and (3) peptide pools used to test the cytokine response in the ELISpot assay. This allowed us to use a reciprocal design with all eight possible combinations to investigate the cross-subtype reactivity of the T cell response including proliferation and functional activities. Infection with subtype D was associated with a higher magnitude of both MIP-1β and IFN-γ response and a higher breadth of IFN-γ response.
Whereas stimulation with the same subtype as the infection subtype maximized the magnitude of the MIP-1β responses, the reverse was seen for IFN-γ responses, although the significance was borderline for IFN-γ (MIP-1β: p = 0.034; IFN-γ: p = 0.048). Thus the MIP-1β response was more subtype specific and the IFN-γ response was more broadly reactive for a given infection subtype at the level of in vitro stimulation. The interaction of stimulation and test resulted in a significantly higher magnitude of both MIP-1β (p < 0.001) and IFN-γ (p = 0.005) responses when the subtype was crossed. Interestingly, in vitro stimulation as a main effect was not significantly associated with differences in magnitude, reflecting a trend toward higher responses to D subtypes.
This would suggest that the cultured ELISpot assay might favor expansion of T cells with subtype cross-reactivity instead of focusing the response on the subtype used in the culture. These effects appeared limited to the interaction between consecutive stimuli, since the infection and test subtype interaction was not significant. In a study of HIV-uninfected Ugandans some of us (P.K., J.S., C.W., and P.P.) observed that the T cell repertoires of HIV-exposed seronegatives (HESN) and HIV-unexposed seronegatives (HUSN) contained memory cells capable of responding to both A and D subtypes detectable by cultured IFN-γ ELISpot after in vitro stimulation with pooled A and D Gag peptides. 44
Those memory T cell responses to the A and D subtypes were present in confirmed HIV-negative individuals and were likely due to previous exposure to cross-reactive environmental antigens, a suggestion later corroborated by the findings of other groups. 45 –47 In our previous study, HESN and HUSN STCLs were stimulated with a mixture of A and D peptides in the same culture and it was not possible to differentiate at the test level between two different scenarios: either (1) the presence of two separate T cell populations, each specific for either A or D epitopes, or (2) T cells with receptor-level cross-reactivity recognizing both A and D epitopes. In the present study, separate cultures stimulated with the A or D peptides responded to both the homologous and alternate antigen with IFN-γ and MIP-1β production, suggesting the in vivo presence of T cells bearing subtype cross-reactive T cell receptors in HIV-infected individuals.
Considering how the frequency of HIV-1-specific T cell clones in the repertoire of infected individuals tracks the selection of escape mutants, 24 and that HIV-1-infected individuals have IFN-γ responses well above those detectable in HESN or HUSN, 34,44 it is remarkable that infection did not result in “focusing” of the T cell response on the infecting subtype, suggesting that such cross-subtype reactive memory T cells clones persist and are available for antigen-induced expansion. Enhancement of the cross-subtype reactivity of preexisting T cell memory responses to environmental antigens might be a desirable feature to have in HIV vaccines to address the challenge of primary strain variability. The development of a subtype-appropriate immune model of cross-subtype reactivity will be crucial to assess vaccine efficacy.
We have a limited view of the correlation between the plasma viral load and magnitude of MIP-1β or IFN-γ responses. When we explored the correlation using time-matched samples for viral load and T cell responses, we observed a significant positive correlation between MIP-1β and viral load and a trend for a similar correlation for IFN-γ. In a simple linear model, this strong association would suggest that the MIP-1β response enhanced HIV viral replication or HIV viral replication enhances the magnitude of the MIP-1β response or a third factor causes an increase in both the MIP-1β response and viral load.
However, it is expected that the availability of antigen will affect the magnitude of the T cell responses and in turn antiviral T cell responses will affect the level of viral antigen production, leading to a nonlinear model for the interaction between viral load and T cell response. Indeed, there are conflicting reports concerning the correlation between plasma viral loads and T cell responses. 48 –53 Furthermore, the choice of HIV target antigen, 49 –53 infecting subtype, phase of infection, 48 and provision of ART might also affect the correlation. Within the Gag antigen we did not observe a correlation between the breadth of both MIP-1β and IFN-γ response and viral load after adjusting for days postinfection. A similar analysis for CD4 counts did not show any correlations.
Ferrari et al., using multiparameter flow cytometry and intracellular cytokine staining, identified MIP-1β responses as being the broadest among IFN-γ, tumor necrosis factor (TNF)-α, interleukin (IL)-2, and CD107a. MIP-1β-producing CD8+ T cells represented the dominant proportion of cells detectable in the early stage of HIV-1 infection prior to virus escape, and were strongly associated with immune pressure resulting in the selection of the early escape mutants. 15 Gray et al. observed that using IFN-γ only as a read out missed 60% of responses to HIV. 54
Our study confirms the mismatch between the magnitude of the MIP-1β and IFN-γ responses early in acute infection, and underscores the limitations in the conventional use of IFN-γ ELISpot as a single read out of HIV-specific responses. In comparison to flow cytometry ICS, which provides cell phenotype and concomitant MIP-1β and IFN-γ production at the single cell level, 55 the ELISpot assay is limited; however, it is more sensitive, robust, and deployable in large vaccine trials under GCLP conditions. The MIP-1β ELISpot enhances the detection of weaker, early HIV-specific responses beyond those detected by IFN-γ ELISpot. 3,56 The cultured version used in this study can test a large number of stimuli using a comparatively small initial number of cells. The increase in sensitivity afforded by culture is, however, at the cost of the loss of precise measurements of the ex vivo frequency of responding cells.
The STEP and RV144 HIV vaccine trials used the IFN-γ ELISpot assay as a measure of immunogenicity. In the STEP trial, 75% of the vaccinees responded to one or more HIV antigens with a geometric mean of magnitude of over 200 SFU/million PBMCs, but the vaccine neither prevented HIV-1 infection nor lowered the viral load set points. 2 The RV144 trial, using the IFN-γ ELISpot assay, as well as measuring IFN-γ and IL-2 production by intracellular cytokine staining, detected Gag-specific CD8 and CD4 T cell responses in only 7.6% and 1.4% of the vaccines, respectively, but was deemed moderately successful with 31% efficacy. 57 The obvious conclusion is that IFN-γ production is a poor correlate of protection against HIV-1 infection. Unfortunately, the MIP-1β responses were not measured in these trials. Our findings of a superior breadth and magnitude of early MIP-1β responses compared to IFN-γ support the inclusion of MIP-1β ELISpot assays as a standard part of the immunogenicity assessment of HIV-1 vaccines.
Footnotes
Acknowledgments
We thank Dongning Wang, Christie Brinkley, and Feng Gao from Duke University Medical Center for performing the retrospective HIV-1 ELISA and Western blot assays, Deogratius Ssemwanga for help with GenBank submissions the late Harr F. Njai for HIV-1 ELISA and Western blot assays, the staff at AIC for recruiting the participants, and the late Anthony Kebba who obtained the funding that made this study possible.
This research is jointly funded by the UK Medical Research Council (MRC) and the UK Department for International Development (DFID) under the MRC/DFID Concordat agreement, the Wellcome Trust (grant WT078927MA), and EDCTP (project code: TA_05_40200_40203).
E.A.O. and P.P. conceived the idea, C.W. recruited the study participants, E.A.O, D.L.B, M.K., and N.N. performed the experiments, E.A.O., N.N., J.L., and P.P. analyzed the data, P.P., J.S., and P.K. supervised the study, and E.A.O., D.L.B., K.M., C.W., J.S., N.N., J.L., P.K., and P.P. wrote the manuscript.
Author Disclosure Statement
No competing financial interests exist.
References
Supplementary Material
Please find the following supplemental material available below.
For Open Access articles published under a Creative Commons License, all supplemental material carries the same license as the article it is associated with.
For non-Open Access articles published, all supplemental material carries a non-exclusive license, and permission requests for re-use of supplemental material or any part of supplemental material shall be sent directly to the copyright owner as specified in the copyright notice associated with the article.