
Abstract
A major obstacle to using next generation sequencing (NGS) technology in clinical routine practice is reliable data analysis. Thousands of sequences need to be aligned and validated, to exclude sequencing artifacts and generate accurate results. We compared two analysis pipelines for Roche 454 ultradeep pyrosequencing (UDPS) raw data generated from HIV-1 clinical samples: a commercial and fully automated Web-based software NGS HIV-1 Module (SmartGene, Zug, Switzerland) vs. the Amplicon Variant Analyzer software (AVA, 454 Life Sciences; Roche). Results were also compared to those obtained with Sanger sequencing. HIV-1 reverse transcriptase and protease genes from 34 plasma samples were submitted to Sanger sequencing and GS Junior UDPS. Raw UDPS data (sff files) from all samples were analyzed with AVA 2.7 software plus manual review of the alignments and the fully automated SmartGene NGS HIV-1 Module prototype (SMG). Results obtained with both analysis pipelines showed good correlation (85.0%). Divergent results were mainly observed at homopolymer positions, such as K101, where the frame-aware alignment and error corrections of the automated approach were more efficient and more accurate, both in terms of detecting and quantifying drug resistance mutations. Our study shows that NGS data can easily be analyzed via a fully automated analysis pipeline, here the SmartGene NGS HIV-1 Module, thus minimizing the need for manual review of alignments by the user, otherwise essential to ensure accurate results. Such automated analysis pipelines may facilitate the adoption of NGS platforms in the routine clinical laboratory.
Introduction
H
The transition of NGS technologies into routine practice will require the advent of commercial tests but also data-analysis pipelines that are reliable and easy to use. These data analysis pipelines ensure clustering, alignment, review for errors, and translation into amino acids for thousands of reads per sample. Resistance mutations are to be retained and further assessed in a quantitative manner (as a percentage of the total reads). 7 In the case of UDPS, due to the lack of frame awareness in the alignments in the AVA software provided by Roche and the frequent shifts due to homopolymers, these analytical steps require much expertise and time, a major obstacle toward using this sequencing technology in routine practice.
This study compares the results of an analysis of UDPS raw data generated from HIV-1 clinical samples with 454 technology (Roche Diagnostics, France), by a new commercial and fully automated Web-based software provided by SmartGene (Switzerland;
Materials and Methods
Samples
Thirty-four plasma samples were randomly chosen for our study (see Table 1 for details). 5,8 Seventeen corresponded to baseline plasma of HIV-infected individuals naive of antiretroviral treatment (median VL = 121,221 cp/ml) and 17 corresponded to plasma of individuals who failed a first antiretroviral therapy (median VL = 5,914 cp/ml). For these latter cases, virological failure (VF) was defined as a plasma VL >1,000 copies/ml or two consecutive VL >500 cp/ml at least 6 months after treatment initiation. In 13 cases, samples were matched pairs from the same patient at prefailure and postfailure time points.
For each individual, plasma samples available at baseline (N) and/or virological failure (F) were used for HIV-1 RT and protease sequencing.
Sanger and Ultradeep pyrosequencing (UDPS)
Viral RNA was extracted from 1 ml plasma using the High Pure Viral RNA kit (Roche). The reverse transcriptase (RT) and protease genes were amplified and population sequencing was performed as previously described.
8
For 454 UDPS analysis, amplicon preparation, emPCR, and UDPS were performed as previously described.
8
Raw data are available in GenBank under accession numbers SRP033482 and SRP026411 and in the HIV LANL database (
Computational analysis
For each sample, raw data (sff files) obtained after “Amplicon” Signal Processing, applied to ensure high-quality reads, were submitted to the two analysis pipelines, one using Amplicon Variant Analyzer (AVA 2.7) software (454 Life Sciences; Roche) and manual review of the alignments and the second using SmartGene NGS HIV-1 Module prototype (SMG).
AVA 2.7 pipeline
Using the identifier (MID) patterns, all reads of a sample were grouped and aligned in AVA 2.7 and variant frequencies were calculated for each nucleotide position relative to the HxB2 reference HIV-1 strain sequence (accession no. AF033819). All alignments were carefully reviewed for alignment errors and analysis was then focused on positions involved in drug resistance (drug resistance mutations, DRMs) as defined by the 2012 ANRS HIV drug resistance algorithm v22 (
SMG pipeline
The SmartGene NGS HIV-1 Module is based on the proprietary IDNS (Integrated Database Network System) technology of SmartGene and is accessible via a secure web interface; users can view the progress of the analysis. It provides a web-based interface to upload *.sff files from a local directory. The module then performs the following steps in an automated manner: (1) demultiplexing and grouping of reads with regard to their MID, (2) a quality filtering to remove low-quality fragments, and (3) establishment of a work list on the basis of the corresponding MID showing the number of reads for each sample. The user can then select the analysis pipeline to be used and the appropriate cut-off for ambiguous bases/background. Then a subsequent fully automated analysis including the following steps is performed: grouping reads using the MID patterns provided by the user with the sample information, exclusion of reads unsuitable for further analysis (too short, too many errors, cannot be aligned), generation of a frame-aware nucleic acid alignment (using a proprietary alignment method of combined global and local alignments developed by SmartGene) with fixed (HxB2, accession no. K03455) or variable reference sequences, detection and correction of homopolymer-related errors, translation of the corrected alignments into amino acid sequences, and determination of mutations and respective frequencies. The mutation cut-off (0.5–20%) above which mutations shall be interpreted for resistance using one of the embedded HIV resistance algorithms is then selected. The resistance profile is then computed along with mutation frequencies as percentage values. The final results are summarized as a list of all mutations per sample with their respective frequencies. Related SmartGene patents are EP05700367 and EP07816282.
Results
Correlation between AVA and SMG NGS pipelines
Levels of HIV drug resistance mutations located in protease and RT regions were quantified from reads generated by 454 UDPS using both pipelines.
A combination of the two pipelines detected 270 DRMs among the 34 samples. Overall, the results obtained with both NGS analysis pipelines showed a 77.4% correlation in terms of detection and quantification of DRMs, with some minor differences (Table 2). We observed DRMs detected only with AVA (13.3%; 35/270) and DRMs detected only with SMG (9.3%; 25/270). However, most differences between the pipelines were found only in cases of mutations at a very low level (0.5–3.3%).
The mutations also detected by Sanger sequencing (SS) are labeled “+”, or “−” if not detected. nd, not determined. The cut-off of mutation detection in the SMG module is 0.5%.
Whereas the AVA analysis pipeline reported DRMs detected at very low frequency levels, the SMG pipeline has a DRM detection threshold set at 0.5% (which is above the overall mean error rate of 0.21 ± 0.07% determined in our experiments 8 ). If only DRMs >0.5% were analyzed, both NGS pipelines displayed a good correlation (85%).
Differences between AVA and SMG NGS pipelines
Among all 34 analyzed samples, discrepancies on DRM detection and quantification between the AVA and SMG analysis pipelines were observed for the following 14 DRMs: PI resistance mutations L10V, I15V, G16E, M46I, I47V, I50V, and V82F; NRTI resistance mutations K65R, D67N, and K219Q; and nonnucleoside reverse transcriptase inhibitor (NNRTI) resistance mutations L100I, V179T, K101E, and Y188H.
For individual 1, the mutation D67N was quantified at levels of 21% by AVA vs. 96.1% by SMG at baseline (sample 1N) and 51.3% by AVA vs. 98.9% by SMG at failure (sample 1F) (Table 2). The GAT codon at position 67 is located at the 3′ end of a 7A stretch, where deletion of a nucleotide was often found. This led to an alignment shift visualized on AVA software, but corrected by an SMG module, explaining the difference of quantification of this D67N mutation.
The main differences observed in other samples were the detection of some DRMs at levels >0.5% with the SMG pipeline, when AVA, including manual review, did not detect them. Typical examples were L100 (sample 13F), K101 (sample 11F), and V179 (sample 6F) positions on the RT region. The codons at position 100 (Fig. 1) and 101 (Fig. 2) are located within or near homopolymeric regions, sensitive to insertion/deletion sequencing errors, and therefore resulted in alignment shifts. Thus, detection of these mutations is very difficult even with manual review.

Example of alignment of reverse transcriptase (RT) sequences obtained by 454 pyrosequencing for sample 13F. Alignments of nucleotide sequences surrounding position 100 (codon 100 is underlined) obtained by the SMG pipeline (left panel) and AVA software (right panel) were chosen to show the presence of insertions/mutations at position 100.
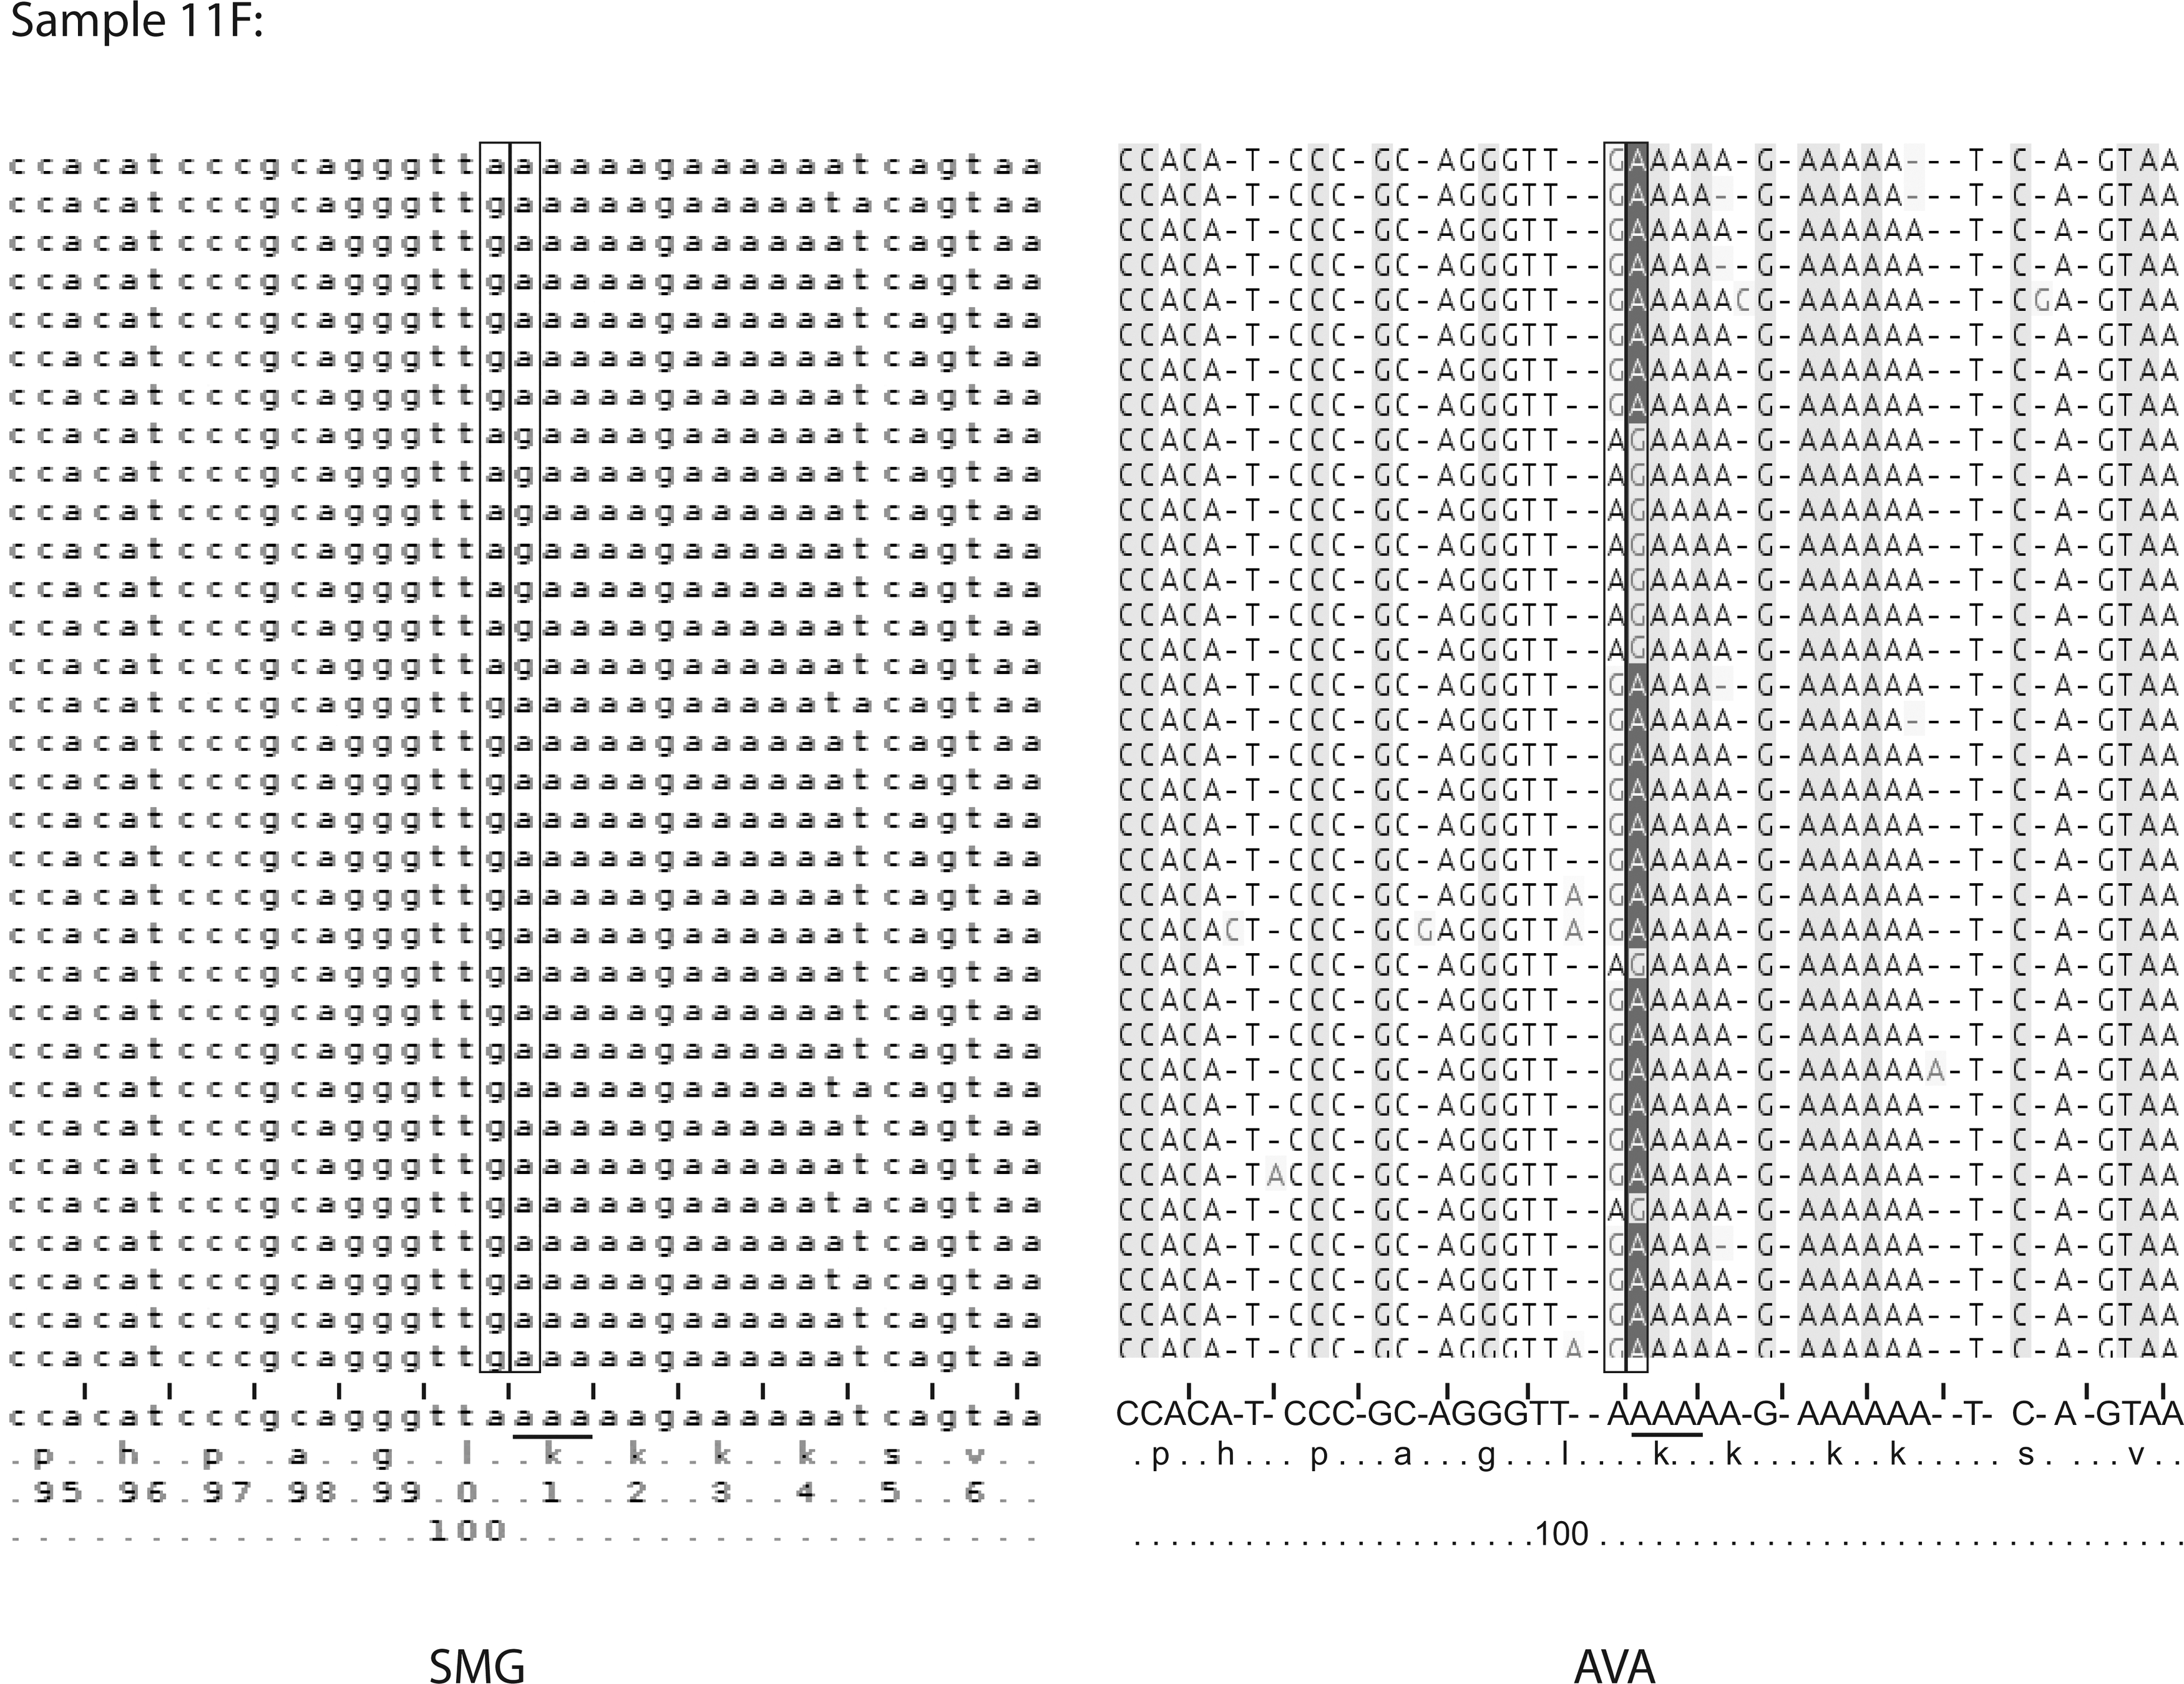
Example of alignment of RT sequences obtained by 454 pyrosequencing for sample 11F. Alignments of nucleotide sequences surrounding position 101 (codon 101 is underlined) obtained by the SMG pipeline (left panel) and AVA software (right panel) were chosen to show the presence of insertions/mutations at position 101.
In Figs. 1 and 2, the sequence alignments obtained from AVA revealed the presence of mutated codons. Indeed, in both cases, there was an insertion of A, leading to a change in the codon at the position of interest (100 or 101). The homopolymer error correction applied in the SMG module and the improved frame-aware sequence alignment resulted in the correct detection of DRMs at these positions for a significant number of reads. Concerning the V179T mutation, which is actually not located in a homopolymeric region (ATA
Comparison Sanger sequencing and UDPS data
The UDPS results of both pipelines were compared to Sanger sequencing results (Table 2). While the majority of DRMs present at a level >20% by both pipelines were also detected by Sanger sequencing, some exceptions were noticed. In sample 10F (Table 2), the mutation K20R was detected at 93.5% on the VF plasma sample by UDPS. Surprisingly, Sanger sequencing performed prior to the UDPS did not detect this mutation in sample 10F. In this and in other cases, Sanger sequencing and UDPS amplicons were independently generated; when resubmitting the UDPS amplicon to Sanger sequencing, the K20R mutation was indeed retrieved (data not shown). By contrast, some DRMs present at levels below 20% were also detected by Sanger sequencing, although somehow inconsistently. For instance, a K101R mutation detected at 6–7% by both NGS pipelines was also observed by Sanger sequencing (data not shown).
Discussion
Our study showed that NGS data generated with Roche 454 technology can be made suitable for a fully automated analysis pipeline, here the SmartGene NGS HIV-1 Module.
Bulk population sequencing by the Sanger method is currently the gold standard for HIV genotypic testing. Our results indicated that UDPS could afford the same reliable results with an increased sensitivity. The two analysis approaches, AVA 2.7 (plus manual validation by a user with recognized expertise in HIV) and the SmartGene analysis pipeline, showed an overall good correlation of results. However, some discrepancies with Sanger sequencing were observed. These differences could be explained by the use of several polymerases harboring different proofreading activities for amplicon preparation as well as by selection bias, especially on samples with low viral load.
NGS technologies are as efficient as the current genotyping tests for HIV drug resistance evaluation and provide additional information, i.e., low-frequency variants detection. Low-cost, laboratory scale UDPS-based HIV genotyping methods have already been described. 9 However, there is a need for an automated analysis of HIV DRMs when using NGS technologies in routine practice for genotypic resistance testing.
Establishment of adequate thresholds is critical to discriminate true variants from sequencing errors. Indeed, while the AVA pipeline has the potential to detect mutations of less than 0.5% frequency, there is a debate about the reliability of the detection and the reproducibility and the clinical relevance of such a low-level mutation. 10,11 The threshold for detection of low-frequency DRMs is generally determined with regard to the frequency of error occurrence. The error rate in UDPS depends on the number of initial template molecules (i.e., viral load of the sample), the PCR amplification and amplification strategies, the pyrosequencing reaction itself, the signal detection, the read coverage of the studied position, and errors by bioinformatic processes, especially in homopolymeric regions. 12 –14 Several studies indicated that the main source of errors on HIV population detection was dependent on the type of polymerase used for amplicon preparation. 15 –17
Different approaches to improve the accuracy of the detected low-frequency DRMs have been developed based on flowgrams analysis 18,19 or reads analysis. 20 –22 However, they remain difficult to use for a nonexpert and are not suited for clinical routine practice. Since the AVA software does not generate frame-aware alignments, visual review of the alignments is essential to exclude alignment errors and homopolymer problems. Such a review is a time-consuming and fastidious process, but is necessary to avoid erroneous detection of mutations or missing mutations, especially in a minority of reads.
The SmartGene pipeline, a completely automated and a frame-aware alignment process, detected all mutations above the cut-off of 0.5%. A complex, proprietary homopolymer correction algorithm, which is part of the SMG pipeline, significantly reduces the problems encountered with the AVA software. The reliability of the qualitative and quantitative detection of DRMs flanked by the homopolymeric regions is of importance, since there are at least 17 protease inhibitor (PI), nucleoside reverse transcriptase inhibitor (NRTI), or NNRTI DRMs located around homopolymeric regions. 9 One example is the NRTI K65R mutation, which has a different genetic background region in subtype B vs. C viruses. In this latter subtype, the RT KKK nucleotide template leads to the spurious detection of K65R induced by UDPS. 23,24 For the NNRTI K103N mutation, it has also been demonstrated that the estimated UDPS error rate was higher than other DRMs due to its position near the homopolymeric regions. 25
The SMG pipeline reduces the necessary hands-on time; an alignment visualization tool facilitates the review of problematic loci. In addition to their detection and quantification, this pipeline offers the ability to interpret drug resistance mutations according to current drug resistance algorithms of Stanford and ANRS (
Although the use of NGS for HIV genotypic resistance testing is becoming more standard, it should be remembered that the clinical relevance of low-frequency drug-resistant mutations on treatment is not well defined and could vary according to their amount, their nature, and the targeted therapeutic class. 26 –28 In our sample panel, none of the low-frequency DRMs detected by one of the pipelines would have impacted the response to the prescribed regimen. An L100I NNRTI resistance mutation was detected by SMG with only a 1.3% level in the postfailure sample (sample 13F). This low-frequency mutation could have been selected by efavirenz, but was not fully responsible for this NNRTI resistance since other high-frequency NNRTI mutations were detected (G190S). However, it would be interesting to extend the comparison between these two pipelines to an analysis of NGS data generated from naive patient who failed first line ART and did not harbor baseline low-frequency DRMs detected by AVA.
Thus, NGS combined with an automated bioinformatic analysis pipeline now offers a powerful and promising tool for the clinical diagnosis of drug-resistant viruses, which could potentially be applied to other NGS available platforms, whereas the supervision of such interpretations should remain in the hands of an expert virologist.
Footnotes
Acknowledgment
The authors are grateful to Thierry Lombardot, PhD, former employee with SmartGene, for his expert help in bioinformatics and data analysis.
Author Disclosure Statement
No competing financial interest.