
Abstract
HIV long-term nonprogressors (LTNPs) maintaining high CD4+ T-cell counts without antiretroviral therapy (ART) are divided into elite controllers (ECs) with undetectable and viremic controllers (VCs) with low viral loads. Little is known about the long-term changes of T-cell subsets and inflammation patterns in ECs versus VCs. The aim of the study was to explore the long-term evolution of CD4+ T-cell levels in LTNPs and to analyze cytokine profiles in ECs versus VCs. Nineteen ECs and 15 VCs were enrolled from the natural virus controller cohort (NaViC). T-cell counts were monitored over years, the mean annual change was calculated, and plasma concentrations of 25 cytokines were evaluated using a multiplex bead array. While absolute numbers of T cells did not differ between ECs and VCs over time, we observed a significant decrease of CD4+ T-cell percentages in VCs, but not in ECs (median [interquartile range]: ECs: 37% [28–41] vs. VCs: 29% [25–34]; p = .02). ECs had lower levels of macrophage inflammatory protein-1β (MIP-1β, p = .003), interferon γ-induced protein-10 (IP-10, p = .03), and monokine induced by interferon–γ (MIG, p = .02). CD4+ T-cell percentages inversely correlated with MIP 1-β (r = −0.42, p = .017) and IP-10 (r = −0.77, p < .0001). A subtle decline of CD4+ T-cell percentages could be observed in VCs, but not in ECs, which was associated with higher plasma levels of proinflammatory cytokines. Hence, even low levels of HIV replication might go along with a progressive decline in CD4+ T-cell counts in LTNPs.
Introduction
S
Only a small fraction of HIV-infected individuals (1–2%) are LTNPs, characterized by low to intermediate plasma viral loads (pVLs), stable CD4+ T-cell counts, and no AIDS-specific disease symptoms over years without ART. 1 –6 A subset of LTNPs are able to maintain HIV RNA levels below the limit of detection for long periods and are classified as elite controllers (ECs), as opposed to those who have low, but detectable, viral loads referred to as viremic controllers (VCs). 7 –9
Data on the frequency of ECs are difficult to obtain as there is no commonly accepted definition of EC. The French HIV controller group defined ECs as individuals with viral loads below the limit of detection in >90% of measured values over a time period of >10 years. 8 The International HIV Controller Consortium and others define ECs by three or more viral loads below the limit of detection in >12 months. 9,10 The natural viral suppressors cohort stipulates 2 years of undetectable viral loads. 11 Despite these different definitions, studies consistently suggest a prevalence of ECs of less than 1% of the infected population. 7,8,12 –14
Previously, immune activation as a critical factor driving disease progression in HIV infection has been investigated in LTNPs. Indeed, HIV controllers tend to show reduced immune activation compared with HIV noncontrollers. However, in comparison with healthy individuals, HIV controllers still have elevated levels of immune activation. 15 One important factor might be the persistence even with very low-level viremia, which could be detected by ultrasensitive assays. In a recent study of ECs, low-level viremia was associated with a slow decline of CD4+ T-cell counts over time. 16
Former studies mainly compared the disease course and different immunological functions of ECs with successfully treated HIV patients, progressive HIV-infected patients, and HIV-negative volunteers. 9 In contrast, comparisons of the immunological profile of ECs versus VCs are sparse. However, such a comparison might provide more detailed information about the role of viral replication for the gradual loss of CD4+ T cells and for inflammation. Therefore, we sought to characterize the evolution of CD4+ and CD8+ T cells over years and to identify a cytokine and chemokine signature in plasma that distinguishes ECs and VCs by a screen of inflammatory biomarkers.
Materials and Methods
Study subjects
HIV-1 ECs and VCs were recruited from the natural virus controller cohort (NaViC) group in 2008. This cohort comprises HIV patients from a database of more than 6,000 patients of a German network of clinical HIV centers. Written informed consent was obtained from all patients enrolled in this study, which was approved by the Ethics Committee of the University of Cologne (LTNP: 06–061). pVL, CD4+ T-cell counts and rate of progression of the infection were used for classification. Enrollment criteria for the treatment naïve ECs included a documented HIV-1 infection for more than 2 years, a pVL below 50 copies/mL, and a CD4+ T-cell count above 500/mm3 at enrolment. VCs had to be treatment naïve and have a documented HIV-1 infection for more than 2 years.
At study inclusion, the pVL had to be between 50 and 6,000 copies/mL with a CD4+ T-cell count above 500/mm3. The minimum follow-up for all patients was 2 years, with at least three CD4+ T-cell counts and three pVLs available for analysis. Exclusion criteria were an infection with hepatitis B or C virus, start of ART, or treatment with interleukin-2. Baseline values were defined as the earliest available values since the time of HIV diagnosis. The latest values were defined as the last values before the time of analysis.
Moreover, the human leukocyte antigen (HLA)-B*27 and HLA-B*57 were analyzed as they are overrepresented in LTNPs. 17,18
Healthy individuals (n = 10), HIV-infected patients (n = 22) on ART with a suppressed pVL (i.e., <50 copies/mL), and untreated HIV progressors (n = 31) served as controls. Progressors were defined as having a documented HIV-1 infection for ≥1 year, a CD4 cell count <350/mm3, and being treatment naïve or on ART with a pVL <50 copies/mL.
Patient data, including comprehensive demographic, clinical, laboratory, and pharmaceutical data, were collected over time and entered into the study database.
Cytokine and chemokine analysis
Twenty-five cytokines and chemokines were measured in plasma of the study participants: eotaxin, granulocyte–macrophage colony-stimulating factor, interleukin (IL)-1b, IL-2, IL-4, IL-5, IL-6, IL-7, IL-8, IL-10, IL-12, IL-13, IL-15, IL-17, interleukin-2 receptor, interleukin-1 receptor antagonist, interferon-γ (IFN-γ), interferon-α (IFN-α), tumor necrosis factor-alpha, regulated upon activation normal T cell expressed and secreted, monocyte chemotactic protein-1, macrophage inflammatory protein (MIP)-1a, MIP-1b, interferon-γ-induced protein (IP-10), and monokine induced by IFN-γ (MIG).
Plasma was frozen at −80°C before analysis within 3 months of collection. Analysis was performed using Luminex™ multiplex analysis according to the manufacturer's recommendations and read on a Luminex100 platform. Intra- and interplate assay variations of cytokine levels, using representative samples run on all plates, were less than 5%.
Statistical analyses
All statistical analyses were performed using GraphPad Prism, version 5, California. Associations between continuous variables were assessed using Spearman's nonparametric correlation. The mean yearly change in absolute CD4+ T-cell counts and percentages was calculated by the compound annual growth rate, which describes the year-over-year growth rate over a specified period of time. It is calculated by taking the root of the total percentage growth rate, where n is the number of years in the period being considered.
Data are summarized using median and interquartile range or mean ± standard error of means, as indicated in the tables and figure legends.
Differences between groups were tested for significance with paired or unpaired t-test as applicable. All statistical analyses are two-sided and assume a significance level of 0.05.
Results
Study participants
Nineteen HIV-1 ECs and 15 VCs were recruited from the NaViC cohort. Thirty-one healthy individuals, 22 HIV-infected progressors on ART with undetectable pVL, and 31 HIV-infected progressors off ART served as controls.
The clinical baseline characteristics of ECs and VCs showed no statistically significant differences regarding age, gender distribution, ethnicity, and mode of transmission of HIV. However, disease duration was slightly longer in ECs, being consistent with a longer observation period in ECs compared with VCs. Data are depicted in Table 1.
Data are presented as the median value, with the interquartile range given in parenthesis unless indicated otherwise.
N/A, not applicable; NS, not statistically significant.
Demographic data about HIV progressors (on or off ART) are available in Supplementary Table S1 (Supplementary Data are available online at
HLA subtypes were analyzed in ECs and VCs. HLA subtypes, B27 or 57, were found in 3 of 16 ECs and 4 of 9 VCs, respectively. There were no statistically significant differences between ECs and VCs regarding the frequencies of these HLA subtypes.
Baseline immunologic parameters of both ECs and VCs showed no significant differences (Table 2); however, absolute CD4+ T-cell counts were slightly higher in ECs. For the nadir of CD4+ T cells, no differences were observed in the absolute numbers, but in the percentages, a slightly lower value for VCs was observed. The peak HIV viral load was significantly higher in VCs as expected due to the definition of both patient groups (Methods and Materials Table 2).
Data are presented as the median value, with the interquartile range given in parenthesis.
While absolute numbers of CD4+ and CD8+ T cells did not change over time in either patient group, we observed a decrease of CD4+ T-cell percentage and increase of CD8+ T-cell percentage in VCs, but not in ECs, over time (Fig. 1A–D).

Longitudinal evolution of CD4+ and CD8+ T-cell counts in elite controllers (ECs) and viremic controllers.
Concordantly, looking at the calculated mean annual CD4+ T-cell changes, the decrease of the percentage was higher in VCs (median [interquartile range]: −1.9% [−9.2 to −0.8]) than in ECs (−0.28% [−2.0 to 3.76]; p = .029), but changes in the absolute numbers were comparable (VC: 0.9% [−2.9 to 9.4], EC: −0.9% [−5.3 to 0.92]; p = .115) (Fig. 1E).
Comparison of chemokine/cytokine levels between study groups
Most chemokine and cytokine levels were not different comparing ECs and VCs. However, IP-10, MIG, and MIP-1β emerged to vary significantly between ECs and VCs with lower concentrations in ECs (Fig. 2A).
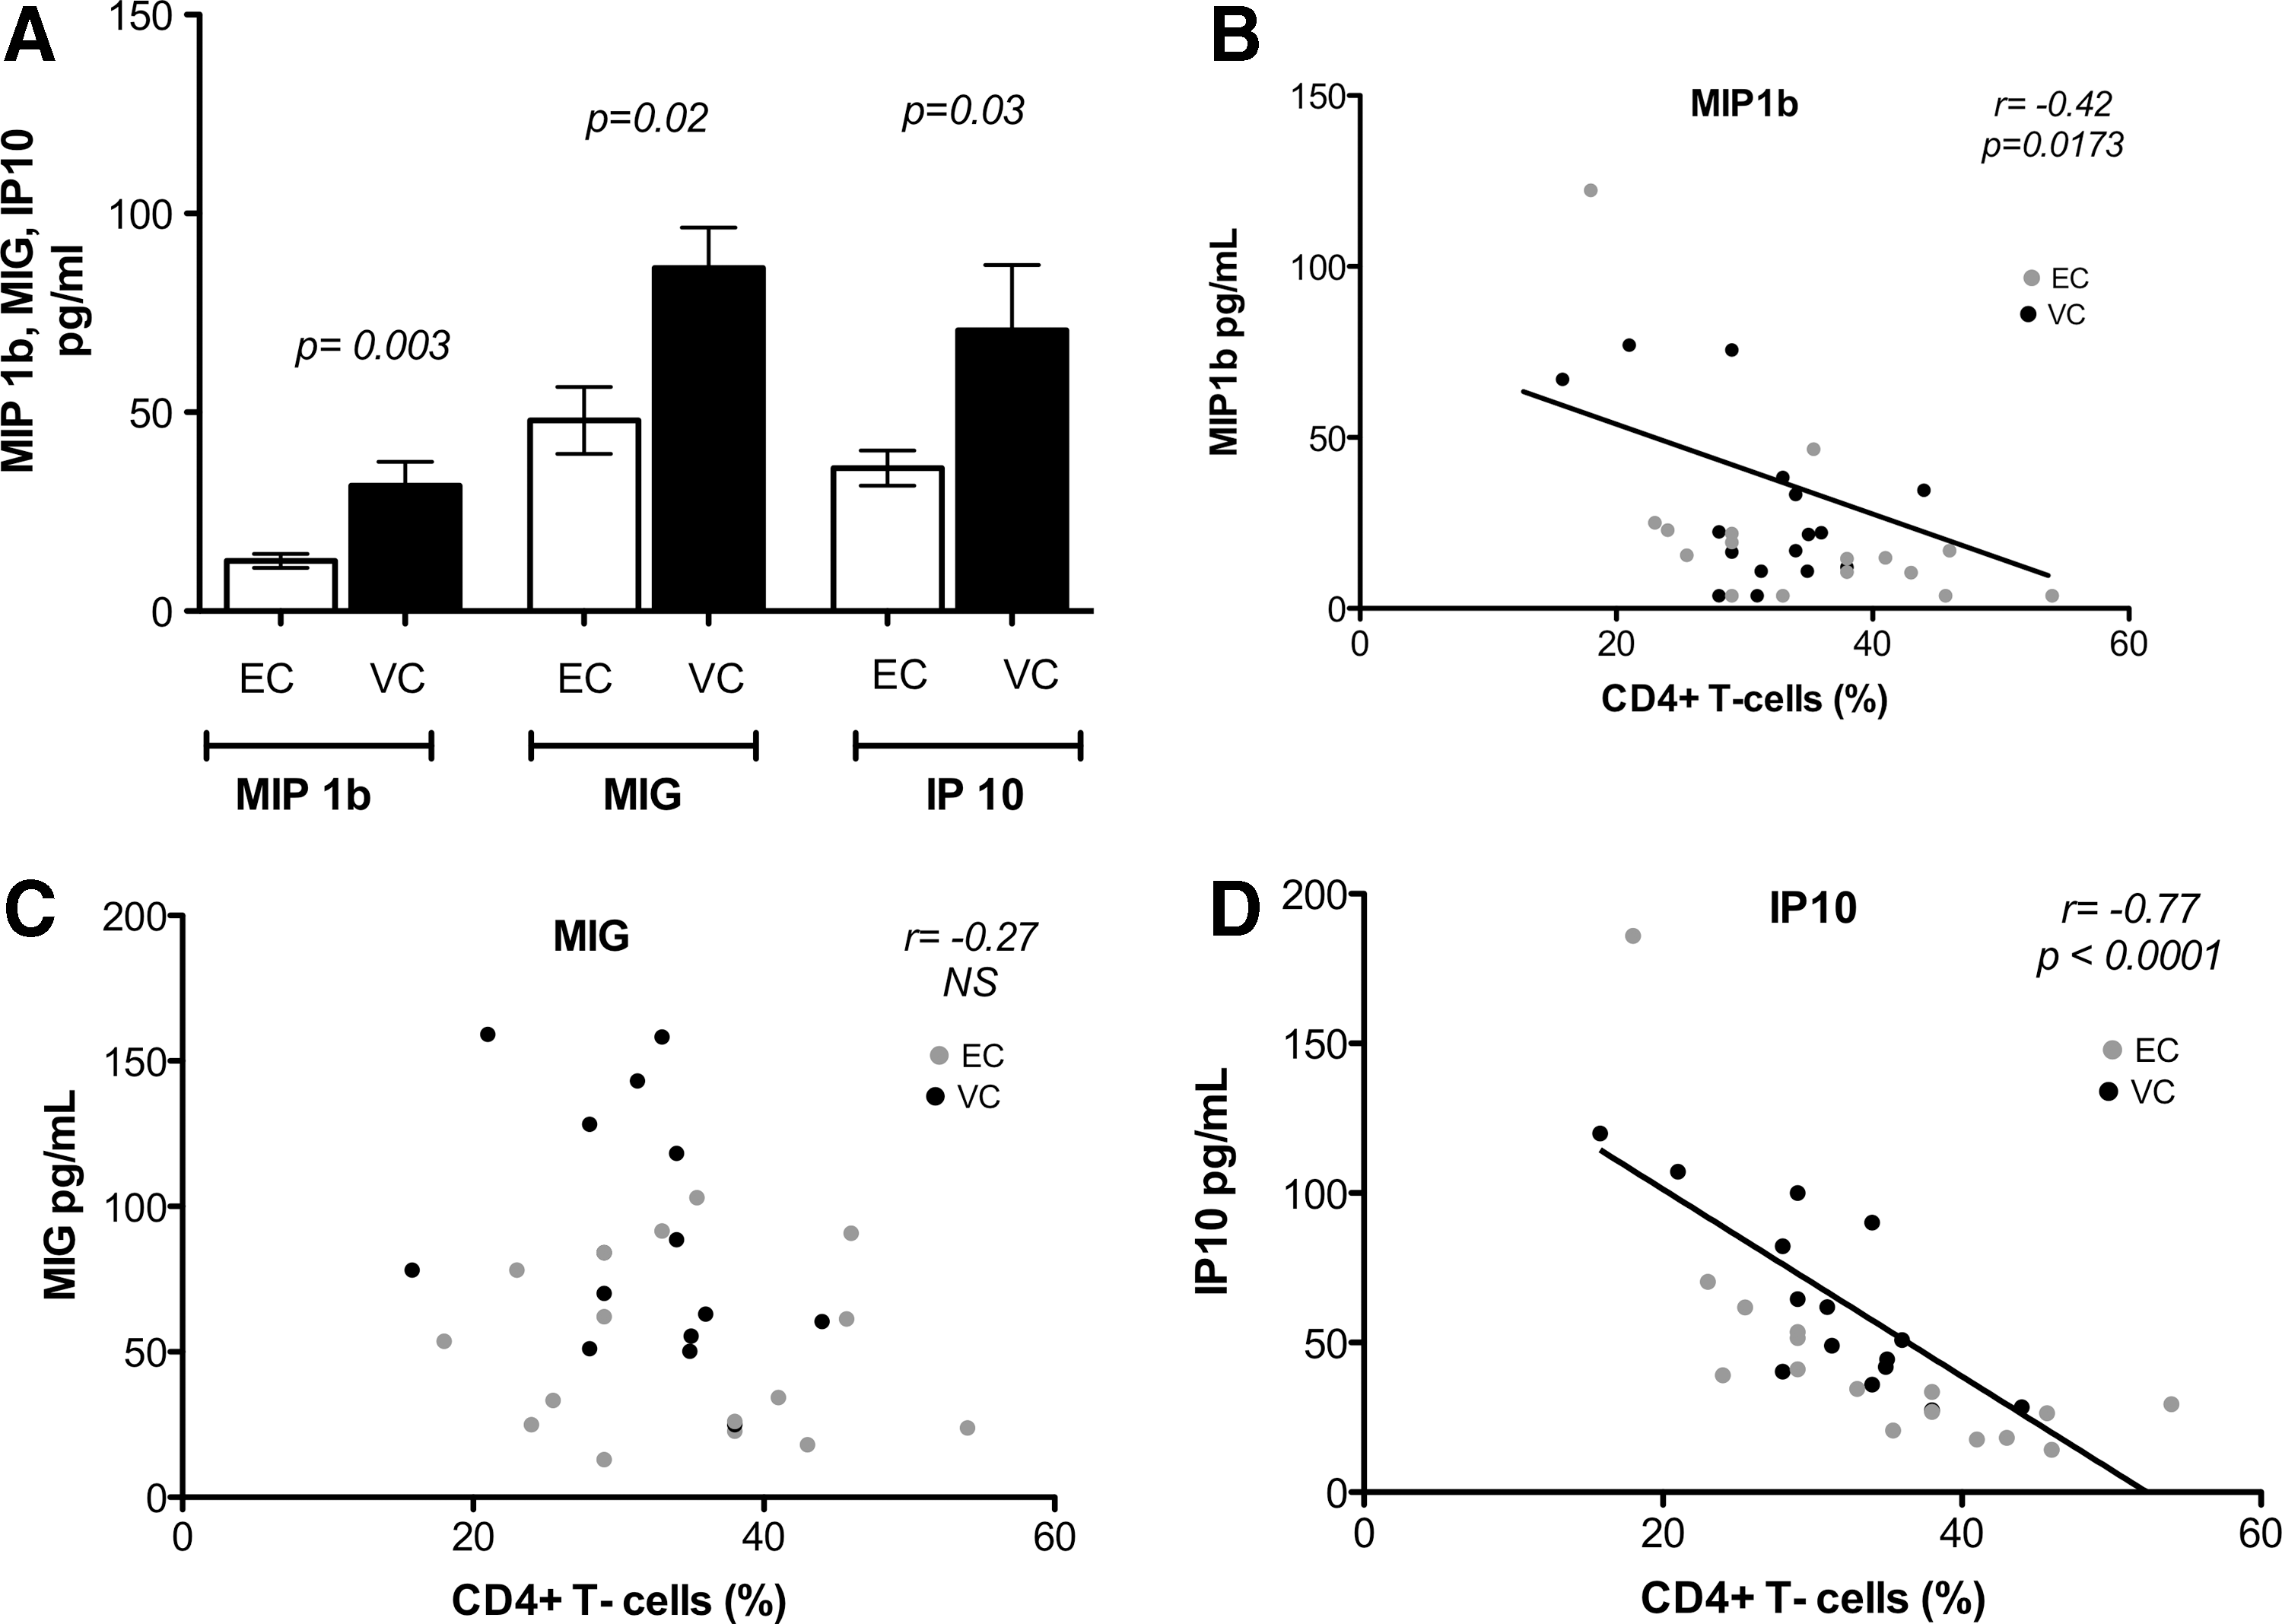
Differences in plasma cytokines and chemokines between ECs and viremic controllers (VCs).
Remarkably, the chemokine concentrations of the ECs met with the levels of HIV-negative individuals. Compared with patients on ART with suppressed pVL, chemokine concentrations were slightly lower in ECs, with MIP-1β demonstrating a statistically significant decrease (Fig. 3A).
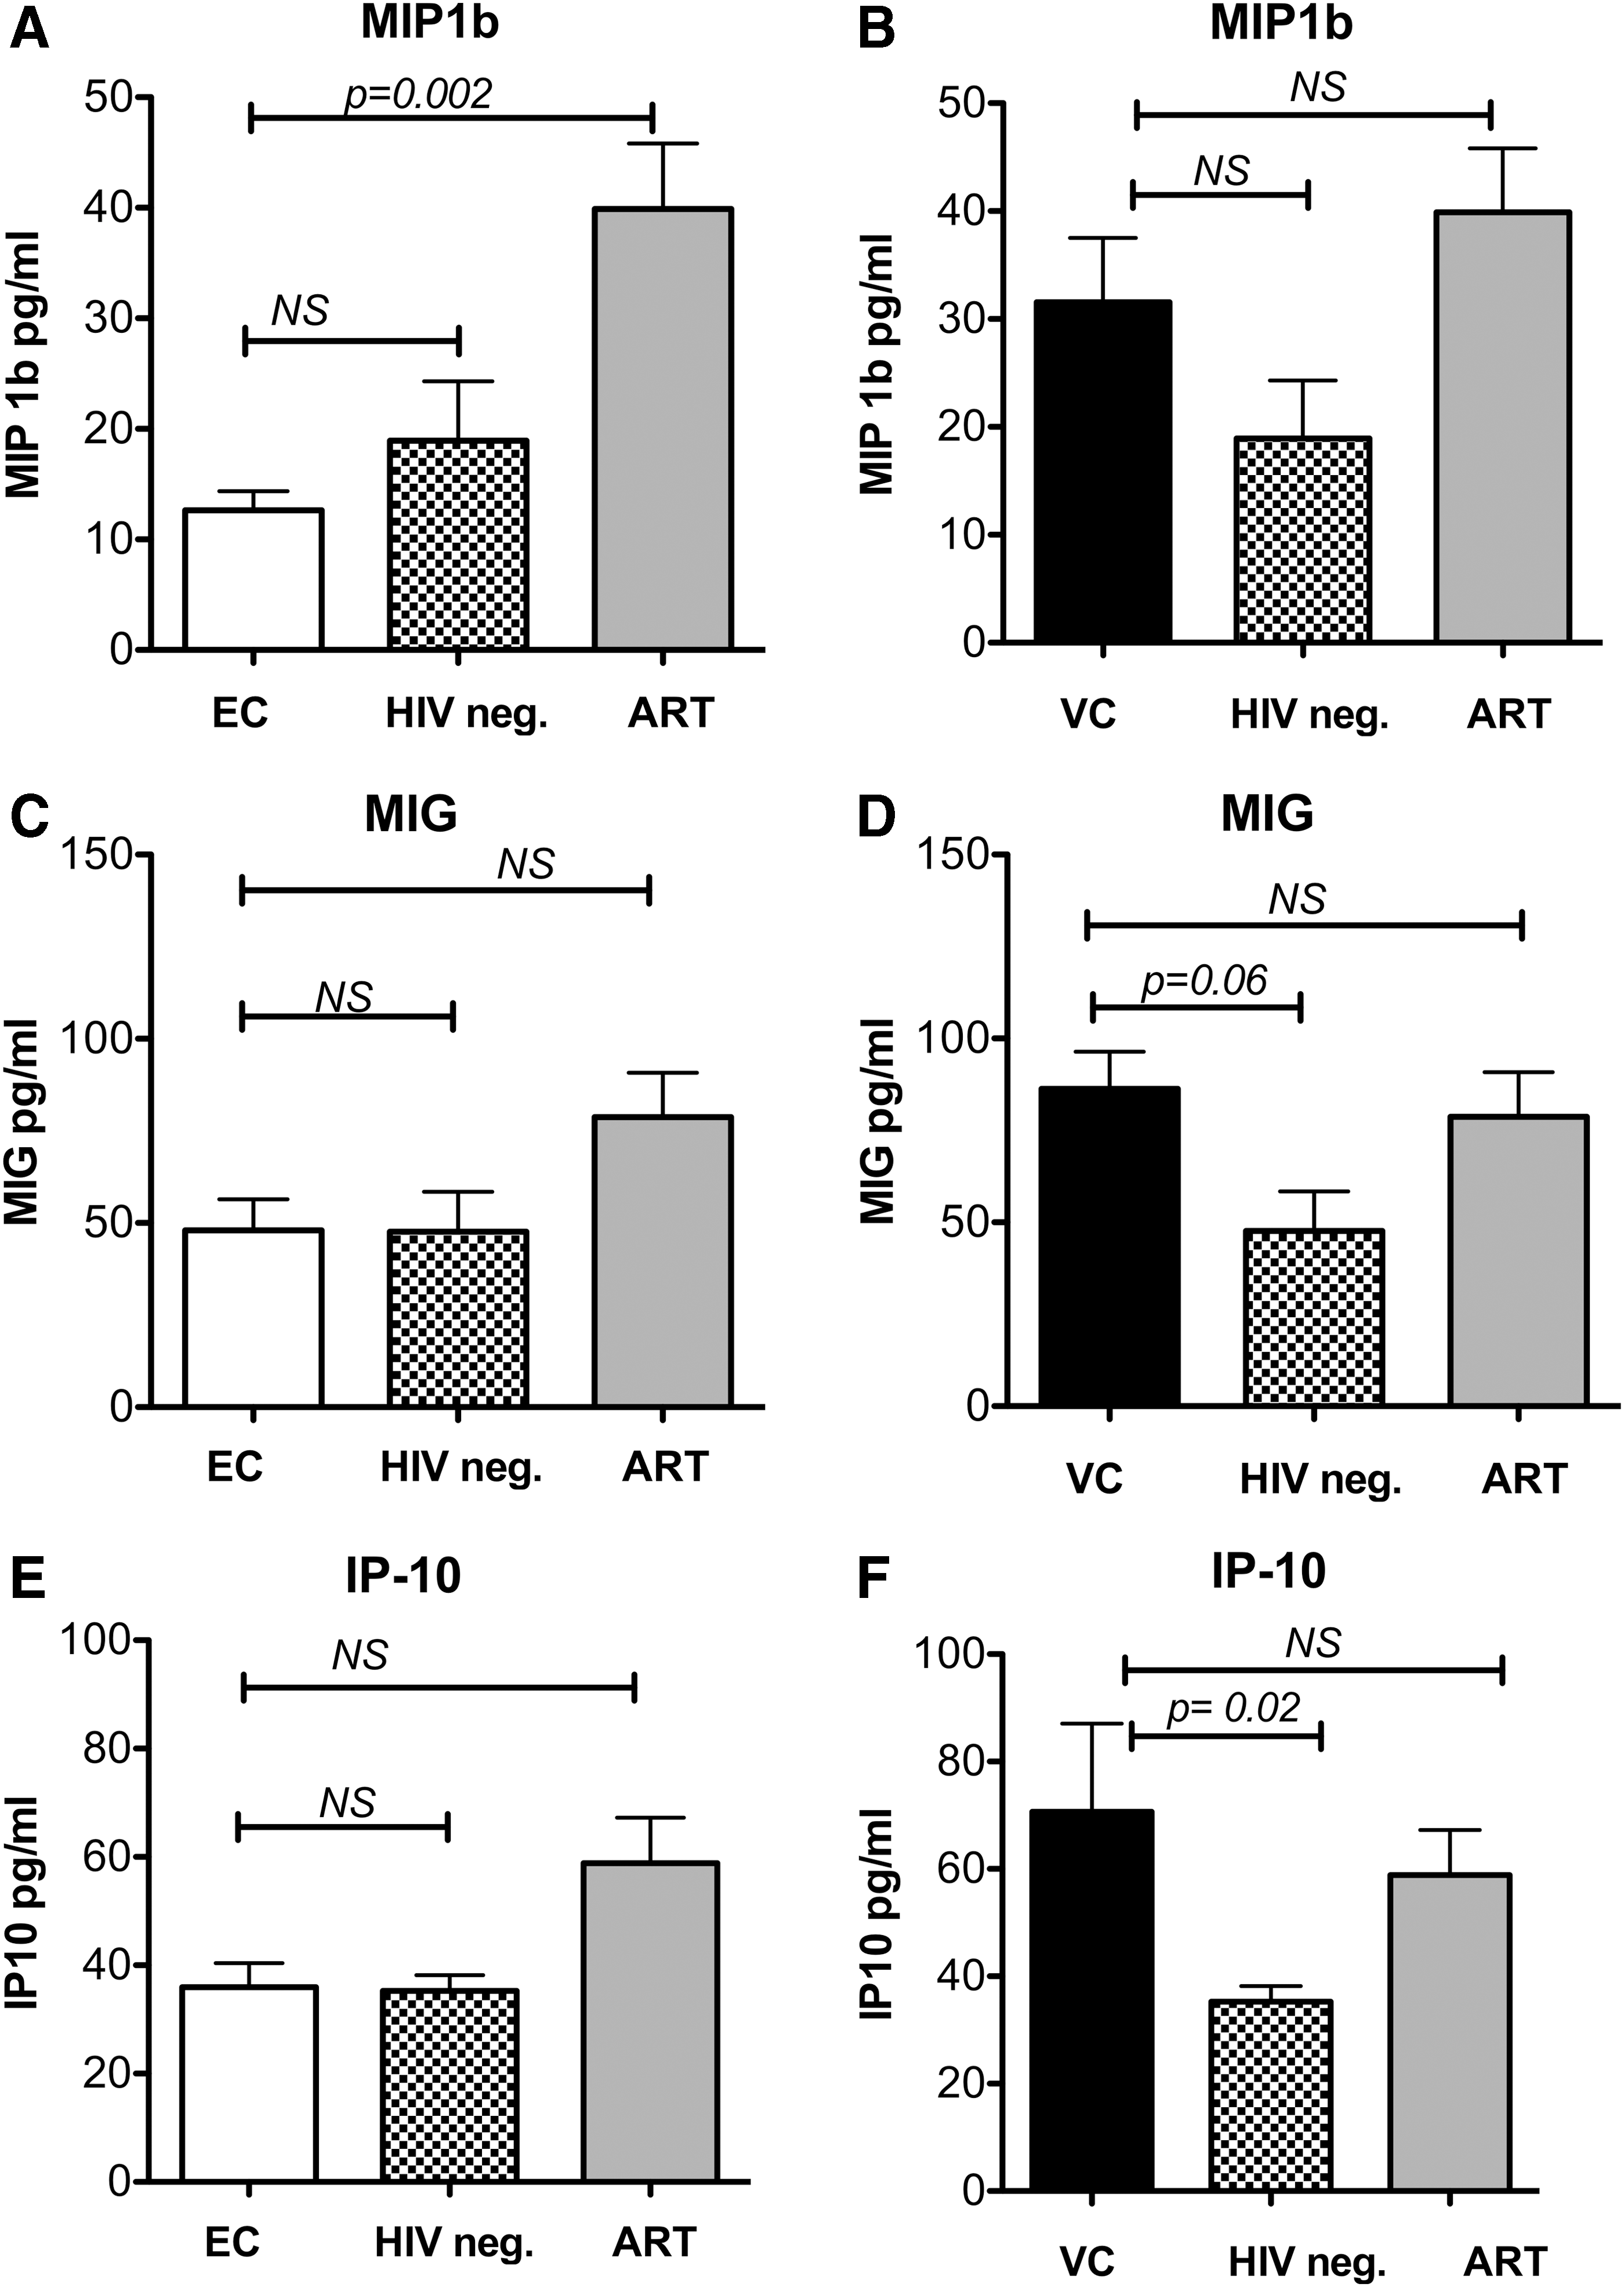
Plasma concentrations of plasma chemokines and cytokines in ECs and VCs compared with HIV-negative and ART-treated persons. Plasma concentrations of MIP-1β in
In VCs, the concentrations of IP-10, MIG, and MIP-1β were higher compared with HIV-negative individuals. However, a statistically significant difference was only found for IP-10, but not for MIG and MIP-1β. Compared with patients on ART with undetectable pVL, the concentrations were comparable (Fig. 3B, D, F). In the group of HIV progressors, the concentrations of IP-10, MIG, and MIP1β were significantly higher compared with all other groups.
We next investigated if there was a relationship between concentrations of these three analytes with the percentage of CD4+ T cells in ECs and VCs (Fig. 2). The percentage of CD4+ T cells inversely correlated with the concentrations of MIP-1β (r = −0.42, p = .017; Fig. 2B) and IP-10 (r = −0.77, p < .0001; Fig. 2D). MIG did not correlate with CD4+ T cells (%) (r = −0.27, p = .149; Fig. 2C).
Discussion
In LTNPs, little is known about differences in the immunological and clinical long-term evolution comparing ECs and VCs. We therefore conducted a comparative study between ECs and VCs, analyzing the CD4+ T-cell course over time as well as plasma cytokine and chemokine profiles.
The main findings of our study are that (i) the percentage of CD4+ T cells decreases over time in VCs, but not in ECs; (ii) the annual change in percentage of CD4+ T cells was higher in VCs than in ECs; and (iii) plasma levels of IP-10, MIG, and MIP-1β were lower in ECs, being comparable with HIV-negative individuals, and for IP-10 and MIG, being comparable with HIV-infected patients on ART with undetectable pVL.
Several studies have demonstrated that absolute count and percentage of CD4+ T cells are independent predictors of disease progression in HIV-infected individuals. 19,20 Moreover, the CD4+ T-cell percentage has less diurnal variability than the absolute CD4+ T-cell count. Recently, pretreatment percentages of CD4+ T cells were found to influence the recovery of CD4+ T-cell counts and percentages after initiation of antiretroviral treatment. 21 Thus, both parameters and especially the CD4+ T-cell percentage might be important and are in fact widely used as surrogate parameters to monitor the clinical course of HIV-infected patients.
In the present study, there were no differences in the absolute CD4+ T-cell count, neither between ECs and VCs nor over time in each patient group. However, a higher decrease in the CD4+ T-cell percentage in VCs compared with ECs was documented. Similar results were found in another study. 22 In other studies, a higher decrease was seen in VCs regarding both CD4+ T-cell percentage and absolute counts. 7,9,23
Hence, it seems that even ongoing low-level HIV replication has an impact on the CD4 cell course during HIV infection. Inflammation might be related to persistent low-level viral replication. 22
Progressive HIV infection with depletion of CD4+ T cells is usually accompanied by an increase in CD8+ T-cell counts. 24 Expectedly, the CD8+ T-cell percentage showed an increase over time, while the absolute CD8+ T-cell count did not change over time, and was not different between ECs and VCs.
Next, we investigated if ECs with their stable CD4+ T-cell counts might differ from VCs in respect of cytokine/chemokine expression. Plasma levels of the two chemokines, IP-10 and MIG, both members of the IFN-γ-inducible family, were found to be significantly lower in the EC group compared with the VC group and comparable with HIV-negative individuals and HIV-infected patients on suppressive ART. IP-10 and MIG are inflammatory chemokines binding to the CXCR3 receptor, which is expressed by Th1 cells. 25,26 They are mainly involved in the recruitment of leucocytes to inflamed tissue and have been involved in the context of chronic immune activation. 27,28
Chronic immune activation in HIV-infected individuals is strongly associated with disease progression, 29,30 which may be reflected by an elevation of inflammatory cytokines. Multiple cytokines have been investigated as plasma biomarkers of immune activation. In SIV-infected monkeys, elevated levels of IP-10 and MIG in lymph nodes and plasma were positively associated with disease progression; high plasma levels were found in monkeys with rapid disease progression. 25 Matching results were recently found in HIV-positive individuals who are able to control viremia in the absence of ART: Elevated IP-10 levels were associated with activation of CD4+ and CD8+ T cells and lower CD4+ T-cell counts. 28
At the genital mucosa of HIV-exposed, HIV-negative commercial sex workers, which are characterized by high protection from HIV acquisition, MIG and IP-10 expression was lower compared with HIV-negative and HIV-infected individuals, 31 which is concordant with our data. Furthermore, our observations are consistent with a recent study, which characterized the cytokine/chemokine profile of HIV controllers and noncontrollers. The authors also found lower IP-10 and MIG concentrations in HIV controllers. In contrast to our study, elite and viremic controllers were considered as one group and a separate analysis of the cytokines for these two groups was not performed. 32
Interestingly, another recent study also found lower IP-10 concentrations in HIV controllers. 33 Conflicting results were found in another recent study comparing levels of 20 inflammatory markers in HIV-infected ECs, HIV-infected individuals on ART, and HIV-uninfected individuals. ECs had elevated levels of a set of inflammatory markers, including IP-10, despite maintaining relatively low levels of viremia. 34
As an important extension of this study, our approach to compare ECs and VCs provides further evidence that LTNPs are not homogeneous, but can be further distinguished by the extent of virologic control, maybe associated with differences in expression of the chemokines, MIG and IP-10. Several mechanisms have been proposed by which HIV persistence and ongoing replication might be impacted by immune activation. For instance, certain chemokines and ligands such as CXCR3 ligands (MIG, IP-10), CCL19, and CCL20 have been implicated in the recruitment of target cells and infection of quiescent cells to the site of inflammation. 35
This might imply that the recruitment of specific cell types, in this case CD4+ T cells, through chemokines, contributes to the immunologic differences between ECs and VCs. However, as IP-10 and MIG are part of the interferon-induced cytokines/chemokines, we were not able to explain why there was no significant association between MIG and CD4+ T-cell counts. Kamat et al. reported an association of CXCL10, but not CXCL9, with CD4+ T-cell counts. 27 In total, the role of these chemokines in virologic control and in the progression of HIV infection warrants further investigation.
On the other hand, many cytokine levels investigated in this study showed no differences between ECs and VCs. To our knowledge, plasma levels of most of these cytokines have not been investigated by others to date. One study reported significantly higher IL-6 concentrations in LTNPs, 36 another study showed that only LTNPs displayed a preserved IL-10 production. 37 Two studies about IL-7 plasma levels compared between LTNPs and HIV progressors reported conflicting results. 38,39
In our study, the plasma levels of MIP-1β (CCL4) in ECs were in the range of HIV-negative individuals and lower than in patients on ART with undetectable pVL. MIP-1β (CCL4) belongs together with MIP-1α to the β-chemokine subfamily. They are produced by CD8+ T cells in response to various external stimuli and induce a strong inflammatory response. 40,41 Elevated plasma levels of soluble activation markers such as MIP-1β 42 have been postulated as markers for immune activation in HIV infection and hence been used to investigate the relationship between immune activation and clinical outcomes in HIV-infected patients. On the other hand, it has been demonstrated that MIP-1β is able to suppress the replication of R5 tropic viruses in vitro. 43 Another study has shown that CD8+ T cells from LTNPs produce higher levels of MIP-1β compared with progressors after mitogen stimulation in vitro.
In contrast to these results, plasma levels of β-chemokines were shown not to be different between progressors and nonprogressors. 44 –46 To our knowledge, this is the first observation that plasma levels of MIP-1β are lower in ECs compared with VCs. Consistent with a recent study in aviremic patients on ART, we found a tendency to lower levels of IP-10, MIG, and MIP-1β in ECs, which correlated with higher CD4+ T-cell counts. 27 Moreover, it was shown that IP-10 allows the infection of resting cells. 47 This might be an indication of the importance of ongoing HIV replication and the persistence of long-lived, latently infected resting memory CD4+ T-cells for chronic immune activation as there was no difference in regard to MIG and IP-10 chemokine levels between patients on suppressive ART with artificial HIV suppression and ECs whose immune system itself is able to suppress HIV replication.
However, it was shown that IP-10 is associated with an increased risk of cardiovascular disease in ECs compared with healthy individuals. This was explained by a sustained prolonged low-level viral replication in ECs that might directly or indirectly lead to sustained T-cell and monocyte activation, which in turn contributes to increased systemic inflammation and finally significant coronary atherosclerosis compared with healthy individuals. 48
Taken together, as increased morbidity and mortality rates are still observed in treated HIV-infected patients compared with uninfected persons, reducing systemic inflammation during HIV pathogenesis should be a therapeutic goal to limit non-AIDS clinical complications and finally HIV transmission.
We are aware that the results of this cytokine and chemokine multiplex analysis may not reflect the form, biological activity, or presence of inhibitors of the chemokines and cytokines detected. Limitations of our study include the cross-sectional study design of the chemokine and cytokine analysis, which may have decreased the power to detect significant associations between biomarker expression and CD4+ T-cell count over time. Furthermore, we did not explore the cellular sources of the chemokines and cytokines, as well as the immune activation, on a cellular level. However, two studies demonstrated the importance of plasma biomarkers and immune activation for the prediction of disease progression during HIV infection. 49,50 Our cohort represents one of the largest LTNP cohorts reported so far. Nevertheless, a higher absolute number of patients would be desirable to strengthen the results of our study. 7 –9
In conclusion, we found that expression of the proinflammatory chemokines and cytokines, IP-10, MIG, and MIP-1β, was different in ECs and VCs. We have shown that the degree of plasma immune activation is lower in ECs and might be associated with stable CD4+T-cell counts over time. The small, but significant, decrease in the percentage of CD4+ T cells in VCs seems to be related to HIV replication.
Footnotes
Acknowledgment
The authors thank the patients who participated in this study.
Author Contributions
Conception and design were done by G.F., N.J., C.L., and M.P. Acquisition of data was done by P.F., S.T., C.L., and N.J. Supply of the blood samples was done by JvL, J.R., D.M.-O., J.S.z.W., S.M., and S.T. Analysis and interpretation of the data were done by N.J., C.L., V.W., P.H., G.F., and M.P. Drafting of the manuscript was done by N.J., C.L., G.F., and M.P. Critical revision of the manuscript was done by JvL, J.R., D.M.-O., J.S.z.W., S.T., S.M., P.H., and S.T. Statistical analysis was done by V.W., C.L., and S.T.
Author Disclosure Statement
M.P. has received travel grants from Gilead and has participated in Advisory Boards from Abbvie. N.J. has received lecture fees and travel grants from Abbott, BMX, Essex, Gilead, GSK, MSD, Novartis, and Pfizer. S.T., P.F., D.M.O., J.S.Z.W., C.S., S.M., and V.W.: none reported. M.B.B. has received research grants from Amgen, Astellas, MSD, and Roche and has participated in Advisory Boards from Amgen, Astellas, MSD, and Roche. J.R. has received honoraria for speaking at educational events or consulting from Abbvie, BMS, Boehringer, Bionor, Gilead, Janssen, Merck, Tibotec, and ViiV. G.F. has received grants from Abbvie and lecture fees from Abbvie, Bristol Myers Squibb, Gilead, Janssen-Cilag, and Merck Sharp & Dohme. He has participated in Advisory Boards from Bristol Myers Squibb, Gilead, Janssen, and Merck Sharp & Dohme. C.L. has received travel grants from Gilead and BMS and speaking honorarium from Gilead and Abbvie. C.L. was supported by the Federal Ministry of Education and Research (Bundesministerium für Bildung und Forschung, BMBF) grant 01KI1017.
References
Supplementary Material
Please find the following supplemental material available below.
For Open Access articles published under a Creative Commons License, all supplemental material carries the same license as the article it is associated with.
For non-Open Access articles published, all supplemental material carries a non-exclusive license, and permission requests for re-use of supplemental material or any part of supplemental material shall be sent directly to the copyright owner as specified in the copyright notice associated with the article.