
Abstract
Forkhead box O (FOXO)1, FOXO3, interferon regulatory factor (IRF)4, X-linked inhibitor of apoptosis protein (xIAP), and E74-like factor (ELF)4 have been described as important regulators of T cell functions and differentiation. However, whether these molecules are associated with HIV-1 disease progression is still unknown. In this study, we showed that the levels of FOXO3, IRF4, and xIAP mRNA in rapid progressors (RPs) were significantly higher than in HIV-negative healthy controls (HCs). Moreover, FOXO3 expression was positively correlated with HIV-1 viral load and CD4+ T cell activation. Remarkably, increased CD4+ and CD8+ T cell activation was apparent in RPs compared with typical progressors and HCs. In addition, a profile of higher apoptosis, more CD8+ TEM cells, and fewer CD4+ and CD8+ Naive T cells were observed in early HIV infection patients with low CD4+ T cell counts. Furthermore, in vitro, IRF4 and xIAP expression was enhanced in peripheral blood mononuclear cells from healthy people following T cell receptor stimulation. T cell activation was decreased by treatment with siRNA inhibiting FOXO3, IRF4, and xIAP. Our results show that significantly increased levels of FOXO3, IRF4, and xIAP mRNA in Chinese HIV-1-infected patients were related to T cell immune activation, implicating them as potential targets for developing new therapeutic avenues to slow down HIV-1 disease progression.
Introduction
T
Previous studies on T cell functions of the RPs were mostly focused on children. 10,11 Children who were RPs showed a lower response of polyfunctional HIV-1-specific CD8+ T cells, a higher mean percentage of DR+CD38+CD8+ T cells, and higher viremia compared to non-RPs, and these findings were associated with faster subsequent disease progression. 10,12 Research on adult RPs has evidenced that dendritic cell counts 13 and some miRNAs are associated with a rapid disease progression of HIV. 14 Pathway enrichment analysis has shown that the deregulated expression genes in RPs were mostly involved in apoptosis pathways. 14
However, to present, there have been few studies on T cell function in adult RPs. Children have a definite infection time and they show characteristics distinct from those of adults after HIV-1 infection. 15,16 How T cell function changes in adult RPs and how these changes are regulated are still unclear and require further discussion.
Recently, Forkhead box O (FOXO)1 and FOXO3, interferon regulatory factor 4 (IRF)4, X-linked inhibitor of apoptosis protein (xIAP), and E74-like factor (ELF)4 were found to play important roles in regulating T cell differentiation and functions. 17 –24 FOXO3 has been reported to be associated with the control of viremia and to slow HIV disease progression of HIV+ elite controllers (ECs). IRF4, xIAP, ELF4, and FOXO1 have not been reported upon in HIV-1-infected patients. Whether these molecules regulate T cell functions and accelerate disease progression in early HIV infection (EHI) is still unclear.
In this article, we prospectively examined the expression of these T cell function regulating molecules; moreover, we cross sectionally analyzed the relationship between these molecules and HIV-1 viral load, CD4+ T cell counts, and T cell activation. Our results showed that FOXO3, IRF4, and xIAP were involved in HIV-1 immune activation. The results of our study will be of benefit for the control of HIV disease progression and provide a new direction for the study of HIV pathogenesis.
Materials and Methods
Human subjects
EHI was defined as documented HIV-1 acquisition within the past 6 months.
25
In this study, HIV-1-positive MSM patients with EHI were enrolled. HIV-1-infected MSM in our study were from the prospective MSM cohort established in our laboratory. The exact infection time for acute HIV patients was determined by using a third-generation ELISA antibody test and pooled nucleic acid amplification testing for HIV screening.
26
The date of infection was estimated on the basis of epidemiological and laboratory results according to the Fiebig classification.
27
For the quantification of mRNA (FOXO1, FOXO3, IRF4, xIAP, and ELF4) levels and T cell activation measurement, patients were divided into RPs (CD4+ T cell counts ≤350 cells/μl within 1 year after HIV-1 infection) and typical progressors (TPs) (CD4+ T cell counts ≥500 cells/μl after a 12-month follow-up visit). The HIV treatment guidelines of WHO published in June 2013 recommended an earlier start to antiretroviral therapy (ART). The new proposal encouraged all countries to initiate ART if CD4+ T cells were ≤500 cells/mm3 in HIV-infected adults. In response to these guidelines, we vigorously implemented early ART. Most of the patients received ART therapy after we performed the phenotype tests. Therefore, we could not divide them using the same rules as RPs or TPs. Thus, for the detection of T cell apoptosis, proliferation, and differentiation, patients were divided into two groups according to the CD4+ T cell counts at detection time, CD4low group (CD4+ T cell counts <449 cells/μl within 180 days after HIV-1 infection) and CD4high group (CD4+ T cell counts >450 cells/μl within 180 days after HIV-1 infection). We chose the samples at about 180 days because we intend to look for a predictive marker for disease outcome. None of these patients had received antiretroviral treatment at study entry. Age and gender-matched HIV-1-negative healthy volunteers were used as healthy controls (HCs). The information about infected individuals and controls is shown in Supplementary Table S1 (Supplementary Data are available online at
Both patients and HCs were obtained from the Key Laboratory of AIDS Immunology of the Ministry of Health, First Affiliated Hospital of China Medical University. All the participants of this study gave written informed consent for their participation in the study.
CD4+ T cell count determination
CD4+ T cell counts were measured using TriTEST™ CD4 FITC/CD8 PE/CD3 perCP reagent (BD Biosciences, Franklin Lakes, NJ) with 50 μl of anticoagulant-treated whole blood. The quality and accuracy of the CD4+ T cell counts were controlled using Trucount™ control beads (Becton Dickinson). CD4+ T cell counts were obtained on a FACSCalibur™ flow cytometer 28 (Becton Dickinson).
HIV-1 viral load measurement
Plasma HIV-1 viral loads were measured by standardized real time-PCR (RT-PCR) (COBAS® AmpliPrep®/COBAS® TaqMan®) (Roche Diagnostics, Basel, Switzerland). 28 The detection range was between 20 and 10,000,000 copies/ml.
PBMCs isolation
Human peripheral blood mononuclear cells (PBMCs) were isolated from the whole blood of both HIV-infected and healthy volunteers by gradient centrifugation (Ficoll-Paque™ PLUS; GE Healthcare Bio-Sciences AB, Sweden) at 400 × g for 30 min at 20°C without rotor braking.
mRNA preparation and real-time PCR
FOXO1, FOXO3, IRF4, xIAP, and ELF4 mRNA expression profiles in PBMCs of the patients were measured at about 180 days of HIV infection. Total RNA was extracted from the PBMCs of EHI patients and HCs with an RNeasy® Plus Mini Kit (QIAGEN, Hilden, Germany), and cDNA was synthesized using a PrimeScript™ RT Reagent Kit (TaKaRa Bio, Otsu, Japan). GAPDH was used as a housekeeping gene to calculate the relative expression of FOXO3, xIAP, IRF4, ELF4, and FOXO1. Primers were designed online as described in Table 1 and were synthesized by BGI, Inc., Beijing, China. SYBR® Green-based real-time quantitative PCR was performed according to the manufacturer's instructions (TaKaRa Bio).
PCR conditions were as follows: first was a denaturalization step of 30 s at 95°C, second was 40 amplification cycles (95°C for 3 s; 60°C for 30 s), and a dissociation stage (95°C for 15 s; 60°C for 1 min; 95°C for 15 s) as a final step.
Flow cytometric analysis
One hundred microliters of whole blood from EHI patients was incubated with the following monoclonal antibodies together for T cell subsets and the activation assay: FITC-CD45RA, perCP-CCR7, 29 PE-CD38, APC-HLA-DR, 30 PE-cy7-CD3, APC-cy-CD4, or CD8 (BD Biosciences). PBMCs were isolated from the whole blood of EHI patients, and HCs were stained with fluorescence-labeled antibodies—PE-CD3, APC-Cy7-CD4, FITC-CD8, PE-Annexin V, and percpCy5.5-7-amino-actinomycin (7-AAD) (BD Biosciences)—for T cell apoptosis detection 31 and with PE-Cy7-CD3, APC-Cy7-CD4, FITC-CD8 (BD Biosciences), and PE-ki67 (BioLegend, San Diego, CA) for T cell proliferation detection 30 according to the method described in previous research. 32 Cells were detected using LSRII flow cytometer (BD Biosciences) and analyzed with FACSDiva™ Software (BD Biosciences).
PBMCs stimulated by T cell receptor and mRNA level analysis
For in vitro experiments, PBMCs from HCs were isolated and resuspended with RPMI 1640 medium supplemented with 10% (v/v) fetal bovine serum (FBS), 100 μg/ml streptomycin, and 100 U/ml penicillin at a concentration of 5 × 10⁵ cells/ml in a 96-well plate incubated with purified NA/LE mouse anti-human CD3 (3 μg/ml) and CD28 (6 μg/ml) antibodies (BD Biosciences) for 0, 1, 2, and 3 days. Cells collected on each day were reserved for RT-PCR.
siRNA inhibit gene expression
Density gradient centrifugation was used to extract PBMCs from HCs. Amaxa® Human T Cell Nucleofector® Kit (Lonza, Basel, Switzerland) was used for siRNA transfection, and a program “U-014” was selected for high viability. The transfected cells were gently transferred into a 12-well plate and incubated in a 37°C/5% CO2 incubator for the next study.
T cell activation and proliferation analysis after inhibiting gene expression
The transformed cells were stimulated with antiCD3 and antiCD28 antibodies (antiCD3, 3 μg/ml, and antiCD28, 6 μg/ml; BD Biosciences) in 96-well plates containing 1% (v/v) FBS in a final volume of 200 μl of media per well. The cells were incubated at 37°C with 5% CO2. Apc-CD8, FITC-CD4, PE-cy7-CD3, and Apc-cy7-CD69 (BD Biosciences) were used for the study of T cell activation. T cell proliferation was assessed by staining with Pacific blue-anti-Violet after transfection for 6 h. Then, 5 × 10⁴ cells were counted, added together with the same number of beads (1:1 ratio of cells:beads) into 96-well plates, and cultured for 3 days. Cells were detected using an LSRII flow cytometer (BD Biosciences), and FACSDiva software (BD Biosciences) was used to analyze the data.
Data analysis
SPSS 17.0 (IBM, Armonk, NY) was used to conduct statistical analysis. One-way ANOVA was used for comparison of expression levels of the tested genes among groups. T cell activation, apoptosis, proliferation, and differentiation profiles were analyzed using one-way ANOVA. Moreover, Bonferroni comparisons were applied for multiple comparisons if there are significant differences between groups by one-way ANOVA analysis. Relationships between immune factors and mRNA levels of the genes were evaluated by Spearman correlation analysis. Paired T tests were used to compare the levels of xIAP, FOXO3, and IRF4 before and after stimulation/siRNA inhibition experiments. p < .05 was regarded as statistically significant.
Results
FOXO3, IRF4, xIAP, FOXO1, and ELF4 expression profiles among different groups
As FOXO1, FOXO3, IRF4, xIAP, and ELF4 have been reported to be very important for T cell survival and function, we examined the expression of those genes among RPs, TPs, and HCs. We isolated PBMCs from the whole blood of EHI patients and HCs by centrifugation through a Ficoll–Hypaque gradient and quantified the mRNA levels of FOXO1, FOXO3, IRF4, xIAP, and ELF4. We found a significantly higher expression of FOXO3, IRF4, and xIAP in RPs than in HCs (p = .042, p = .01; Fig. 1A–C), but there were no significant differences between TPs and HCs, TPs and RPs. Moreover, there was no difference in ELF4 and FOXO1 expression among the groups (Fig. 1D, E).
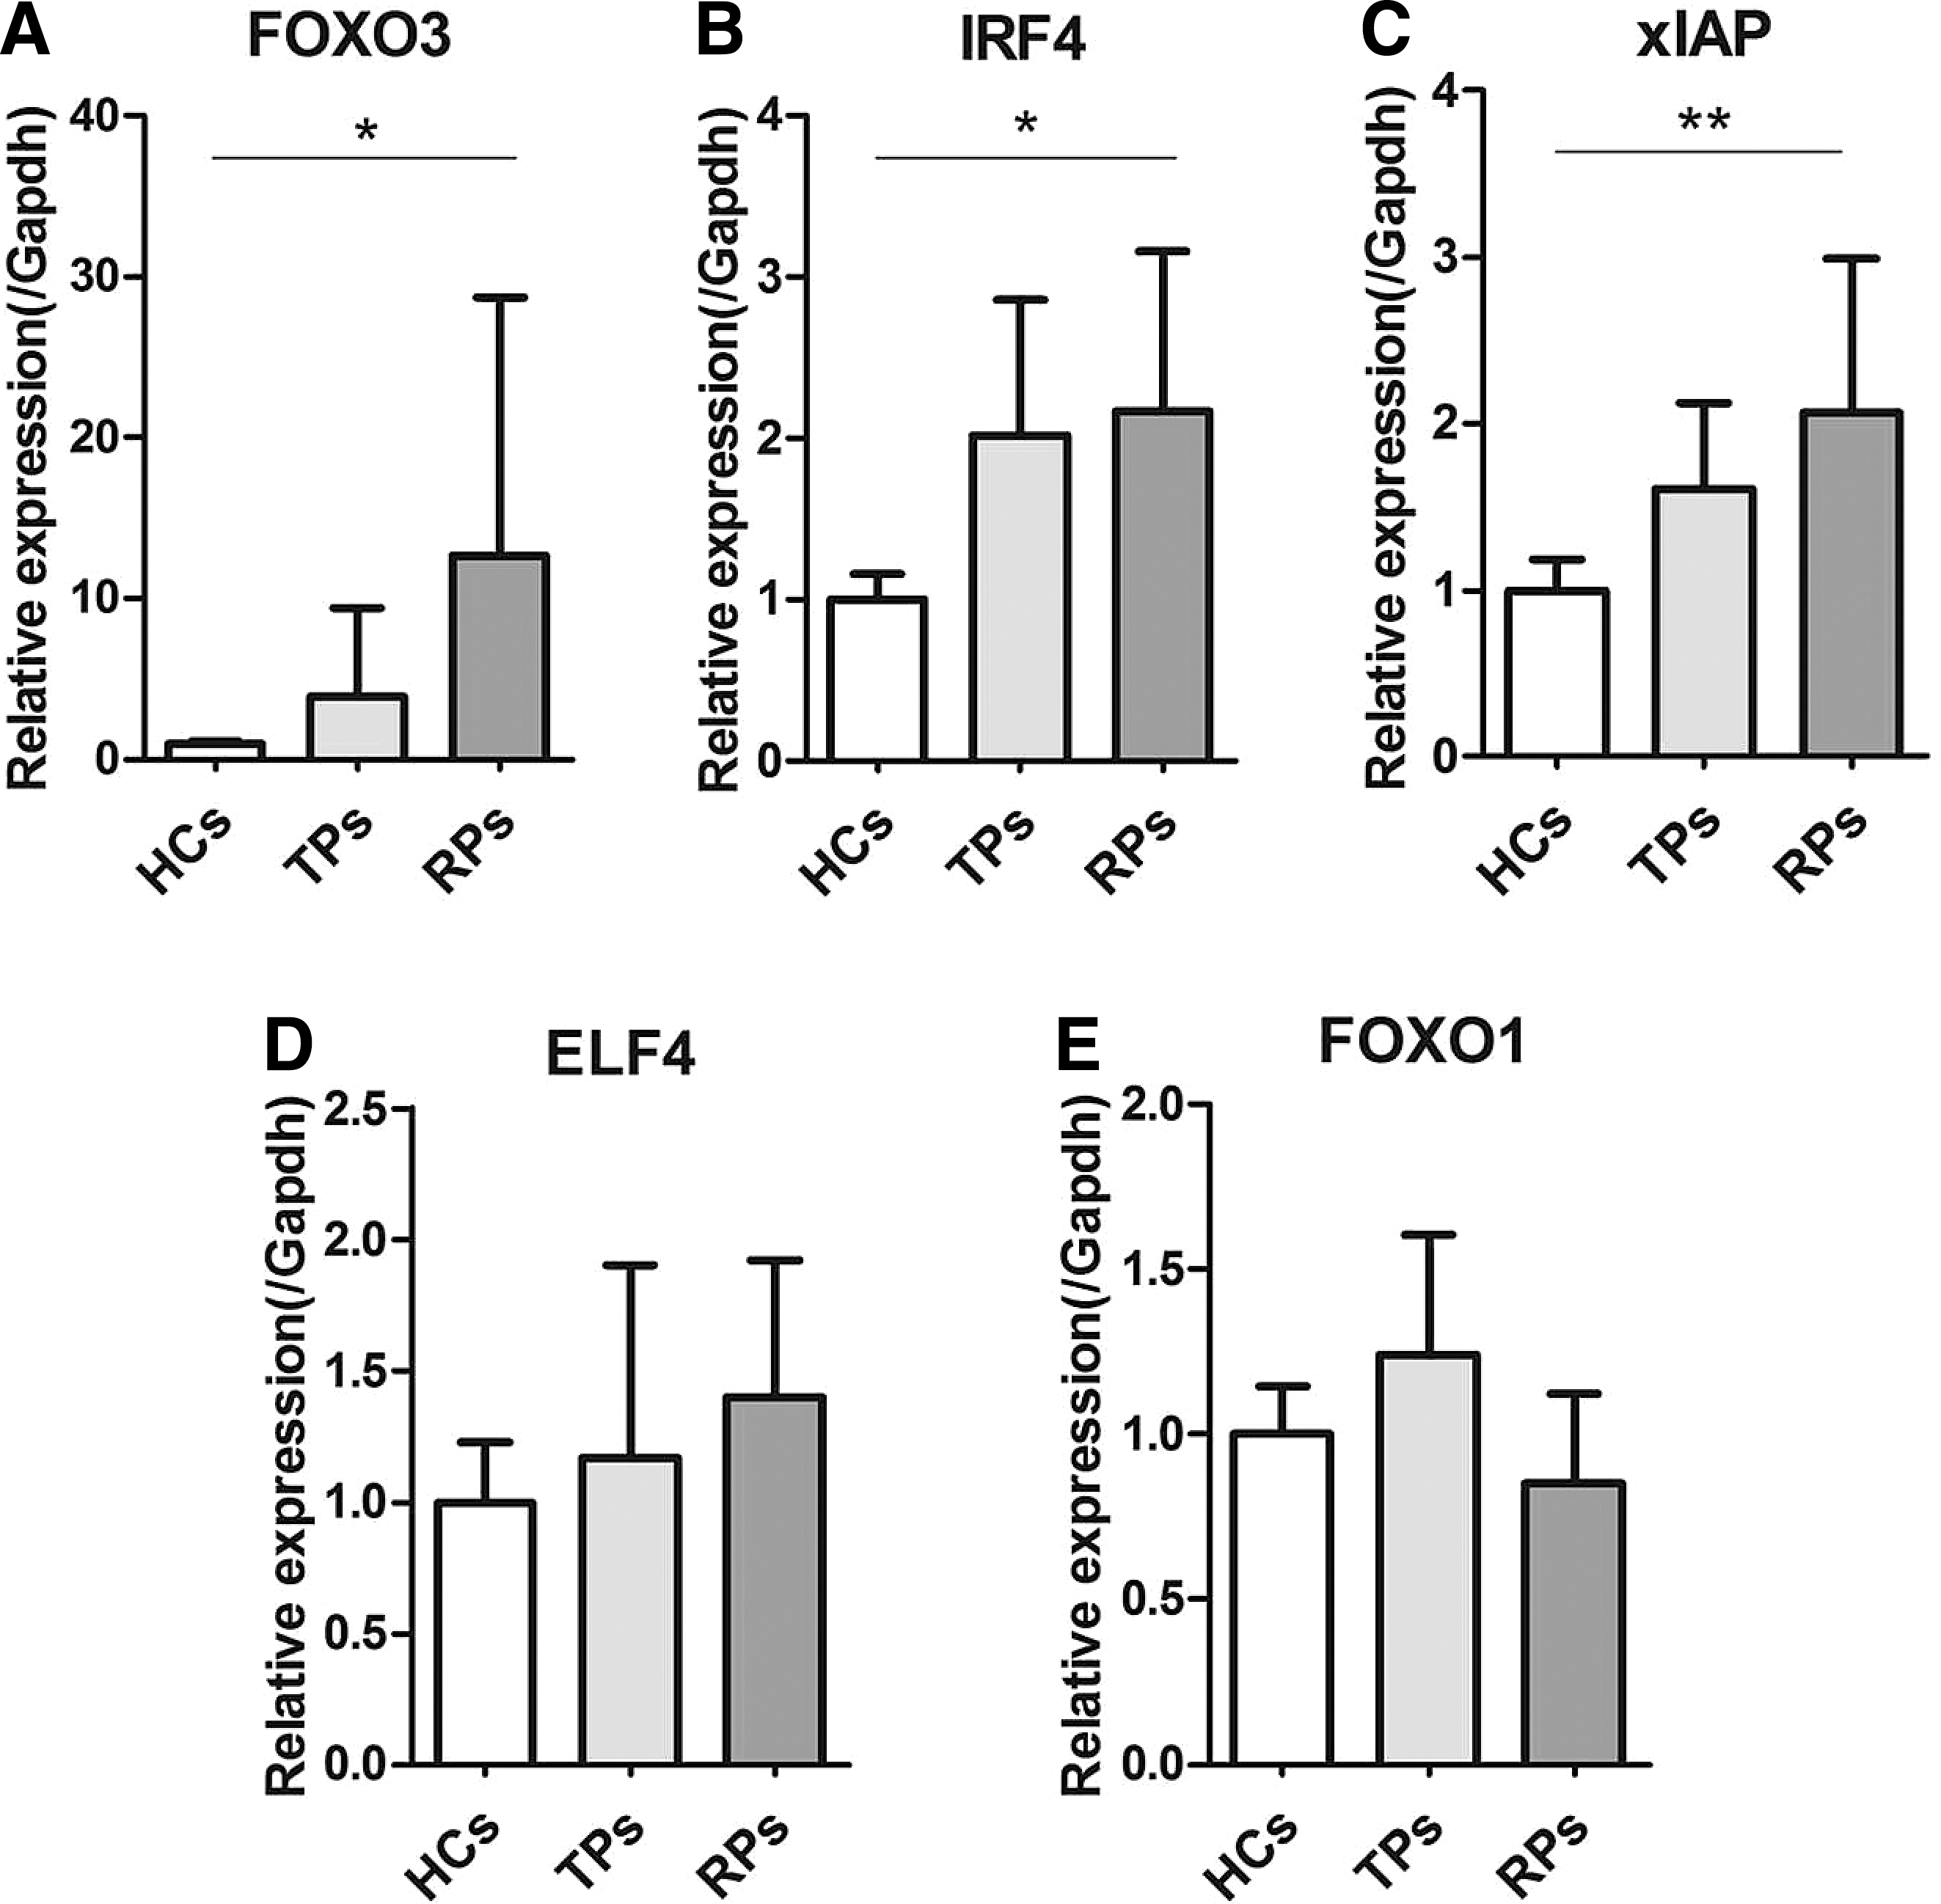
IRF4, FOXO3, and xIAP mRNA expression levels were significantly higher in RPs than in HCs. IRF4, xIAP, FOXO3, FOXO1, and ELF4 mRNA expression levels were detected in PBMCs from HCs, TPs, and RPs. FOXO3
Relationship between T cell regulatory molecules and HIV-1 disease progression
We assessed the relationship between the expression of FOXO3, IRF4, xIAP, and CD4 T cell counts and HIV-1 viral load. We found a positive correlation between the level of FOXO3 expression and HIV-1 viral load (p = .046, r = 0.552; Fig. 2B). However, there were no significant correlations between the levels of IRF4, xIAP, and CD4+ T cell counts and viral load. However, a positive correlation trend appeared between xIAP expression and HIV-1 viral load (p = .065, r = 0.487; Fig. 2B).
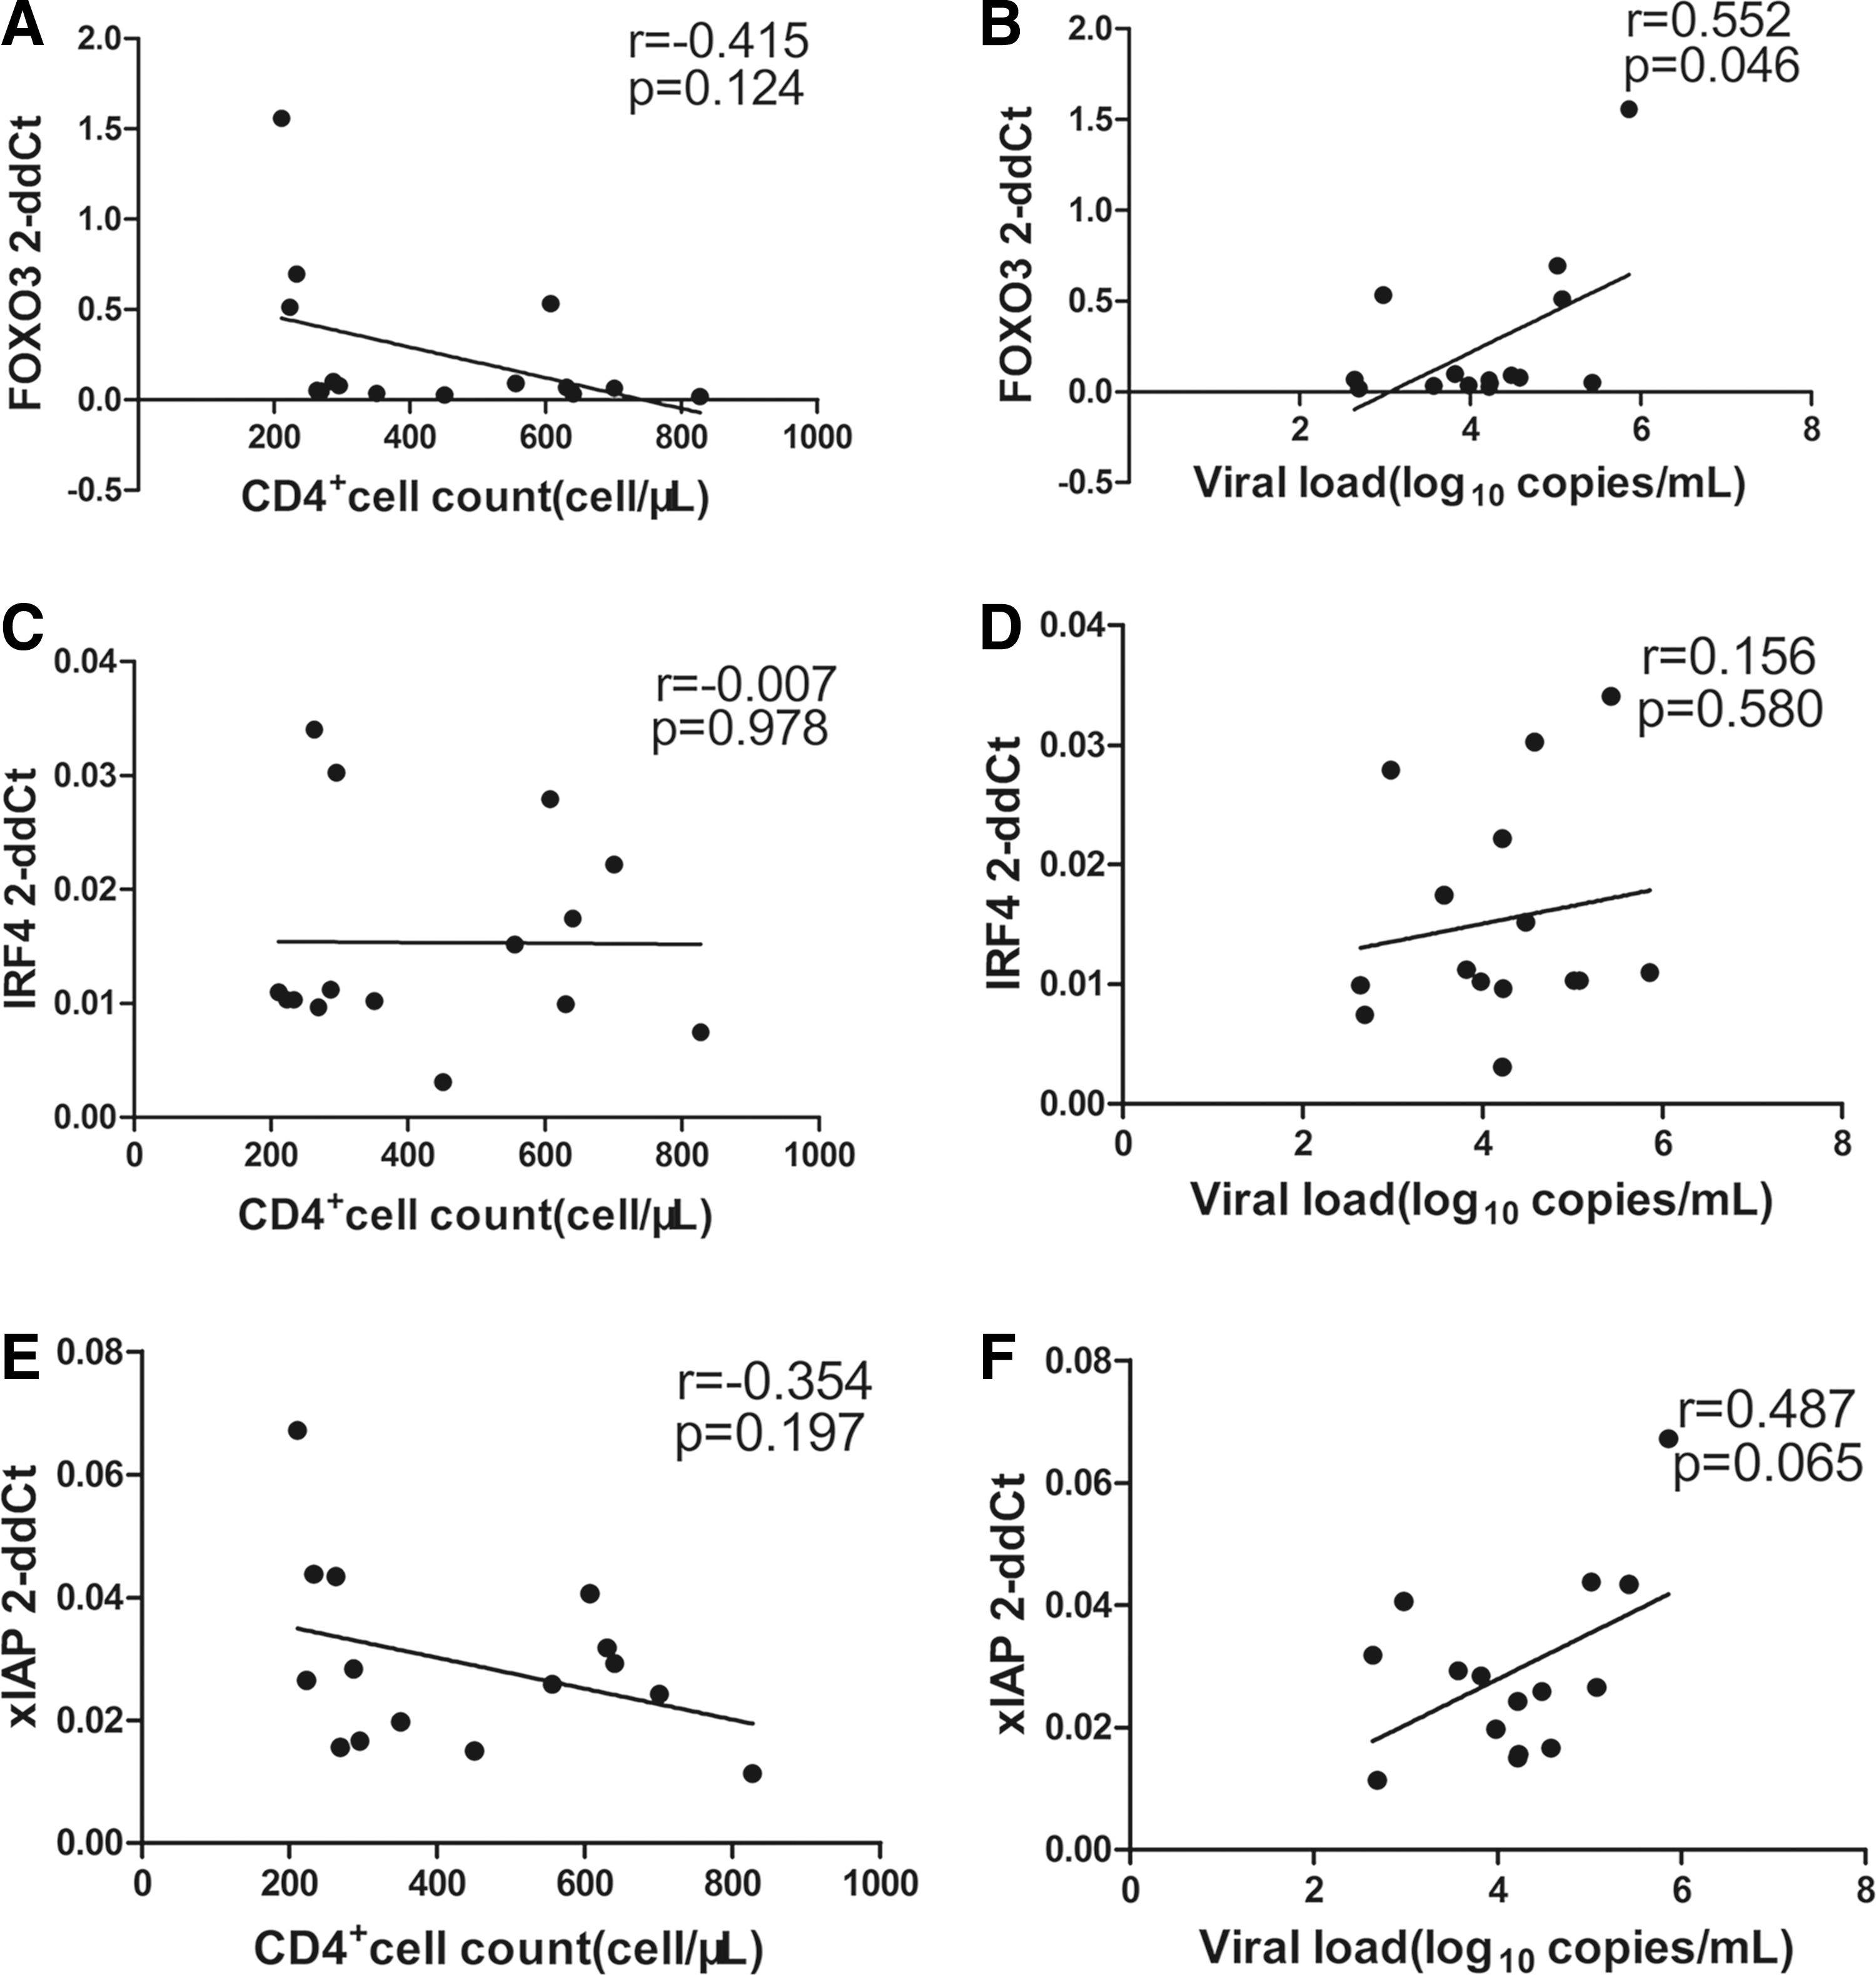
Correlation between IRF4, xIAP, and FOXO3 mRNA expression levels, CD4+ T cell counts, and HIV-1 viral load. FOXO3 mRNA expression was correlated positively with CD4+ T cell counts
Multiple T cell functional changes are associated with faster disease progression
To investigate the T cell activation profiles of MSM during EHI, we characterized T cell activation in the RP and TP groups. T cell activation was assessed by measuring coexpression of CD38 with HLA-DR on CD4+ and CD8+ T cells. As shown in Figure 3, both CD4+ and CD8+ T cell activation in RPs were significantly higher than that in HCs (p = .031, p < .001; Fig. 3A, B). Moreover, CD4+ and CD8+ T cell activation of RPs was higher compared with TPs (p = .007, p = .013; Fig. 3A, B).

Comparison of T cell phenotypes among the three groups. Analysis of CD4+ and CD8+ T cell activation
We also characterized T cell apoptosis, differentiation, and proliferation in EHI cohorts with low and high CD4+ T cell counts. T cell apoptosis was measured by detecting the levels of AnnexinV+ 7-AAD+ CD4+ and CD8+ T cells. T cell differentiation was characterized by measuring CD45RA and CCR7 (Naive: CD45RA+CCR7+CD4+/CD8+, TCM: CD45RA−CCR7+CD4+/CD8+, TEM: CD45RA−CCR7−CD4+/CD8+). T cell proliferation was assessed by measuring ki67 expression. Then, we measured the levels of T cell apoptosis among the groups and found that there were statistically significant differences in CD8 T cell apoptosis between the CD4low group and HCs (p = .004; Fig. 3D). As shown in Figure 3, the CD4low groups of CD4+ Naive T cells showed a significantly lower percentage than the CD4high group did (p = .012; Fig. 3E), but CD8+ TEM cells showed a significantly higher percentage than the HCs group did (p = .035; Fig. 3J). Levels of ki67+ expression on T cells were not significantly different among the groups (Fig. 3K, L).
Correlation between T cell phenotypes, CD4+ T cell counts, and HIV-1 viral load
As RPs and CD4low group showed distinct CD4+/CD8+ T cell activation, apoptosis, and differentiation, we investigated the potential relationships between CD4+/CD8+ T cell phenotypes, CD4+ T cell counts, and HIV-1 viral load. The activation of CD4+/CD8+ T cells was negatively correlated with CD4+ T cell counts (p < .001, r = −0.690; p = .005, r = −0.587; Supplementary Fig. S1A, B) and positively correlated with HIV-1 viral load (p = .021, r = 0.502; p = .028, r = 0.478; Supplementary Fig. S1C, D). CD4+ Naive T cell counts were positively correlated with CD4+ T cell counts (p = .007, r = 0.523 Supplementary Fig. 1I), and CD8+ Naive T cell counts were negatively correlated with viral load (p = .029, r = −0.627, S1R). CD8+ TEM T cell counts were negatively correlated with CD4+ T cell counts (p = .047, r = −0.488; Supplementary Fig. 1N) and positively correlated with viral load (p = .002, r = 0.797; Supplementary Fig. 1T). CD4+ and CD8+ T cell apoptosis was not significantly correlated with CD4 T cell counts or viral load (S1E–H).
IRF4, FOXO3, and xIAP expression is regulated by T cell receptor
RPs showed higher levels of T cell activation and the T cell function regulating genes FOXO3, IRF4, and xIAP, it was hypothesized that T cell activation may be associated with the expression of these genes. Therefore, we discussed in detail the relationship between FOXO3, IRF4, xIAP, and activation of PBMCs from HCs by T cell receptor (TCR) stimulation. We found that IRF4 and xIAP mRNA expression levels increased with the increasing number of days of stimulation (Fig. 4B, C). However, on the contrary, the reduction in FOXO3 expression was prolonged during the stimulation period (Fig. 4A). These results indicated that IRF4, xIAP, and FOXO3 expression was highly correlated with immune activation.
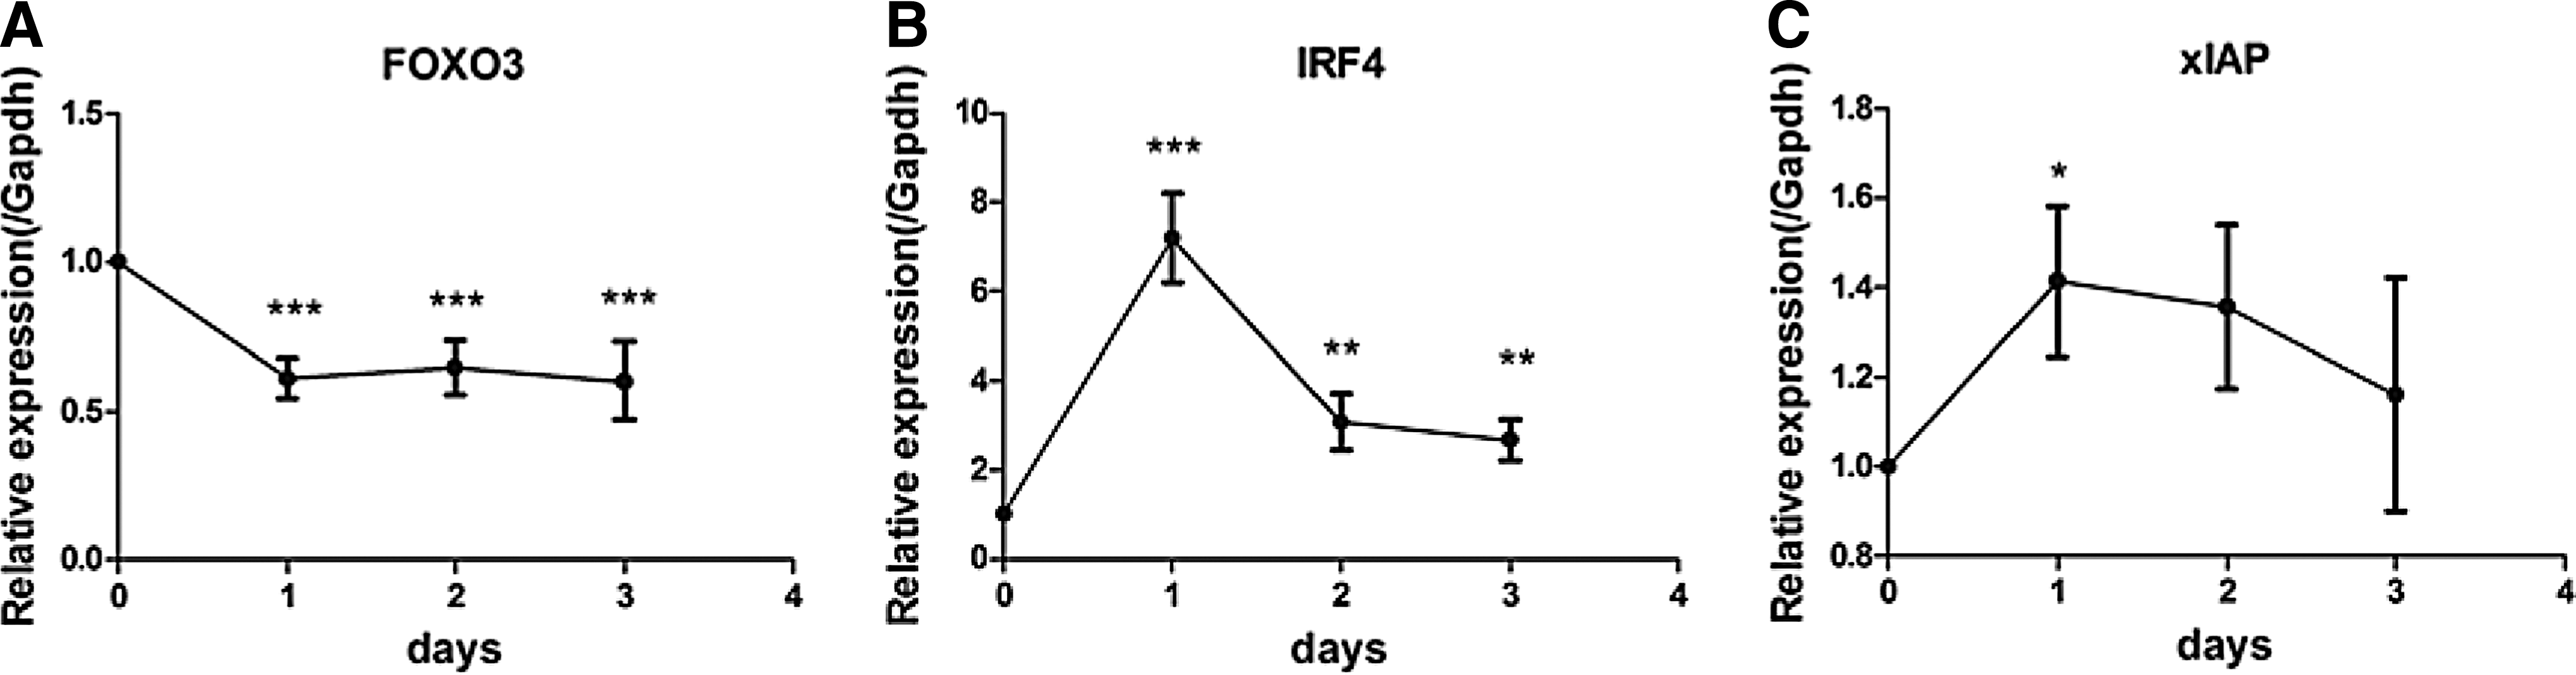
In vitro, activated PBMCs showed changes in FOXO3, IRF4, and xIAP expression. Stimulation of PBMCs from healthy people with anti-CD3 and anti-CD28 antibodies for different lengths of time resulted in deregulation of FOXO3 expression over time
Inhibiting gene expression (FOXO3/xIAP) impacts T cell activation
We used siRNA to inhibit the expression of genes in healthy people (the inhibition efficiency of genes is shown in Supplementary Fig. S2). We found that inhibiting FOXO3, xIAP, and IRF4 expression could deregulate T cell activation to different degrees. Inhibiting FOXO3 could significantly reduce the expression of the activation marker CD25 on both CD4+ and CD8+ T cells (p = .034, p = .014; Fig. 5B, C). Inhibiting xIAP significantly reduced the expression of CD25 on CD8+ T cells (p = .008; Fig. 5F), while the expression of CD25 on CD4+ T cells also decreased (p = .057; Fig. 5E). CD25 expression on CD4+ and CD8+ T cells decreased after the suppression of IRF4, but this change was not statistically significant (Fig. 5H, I). There was no apparent effect on T cell proliferation of inhibiting FOXO3, IRF4, and xIAP (Supplementary Fig. S3).
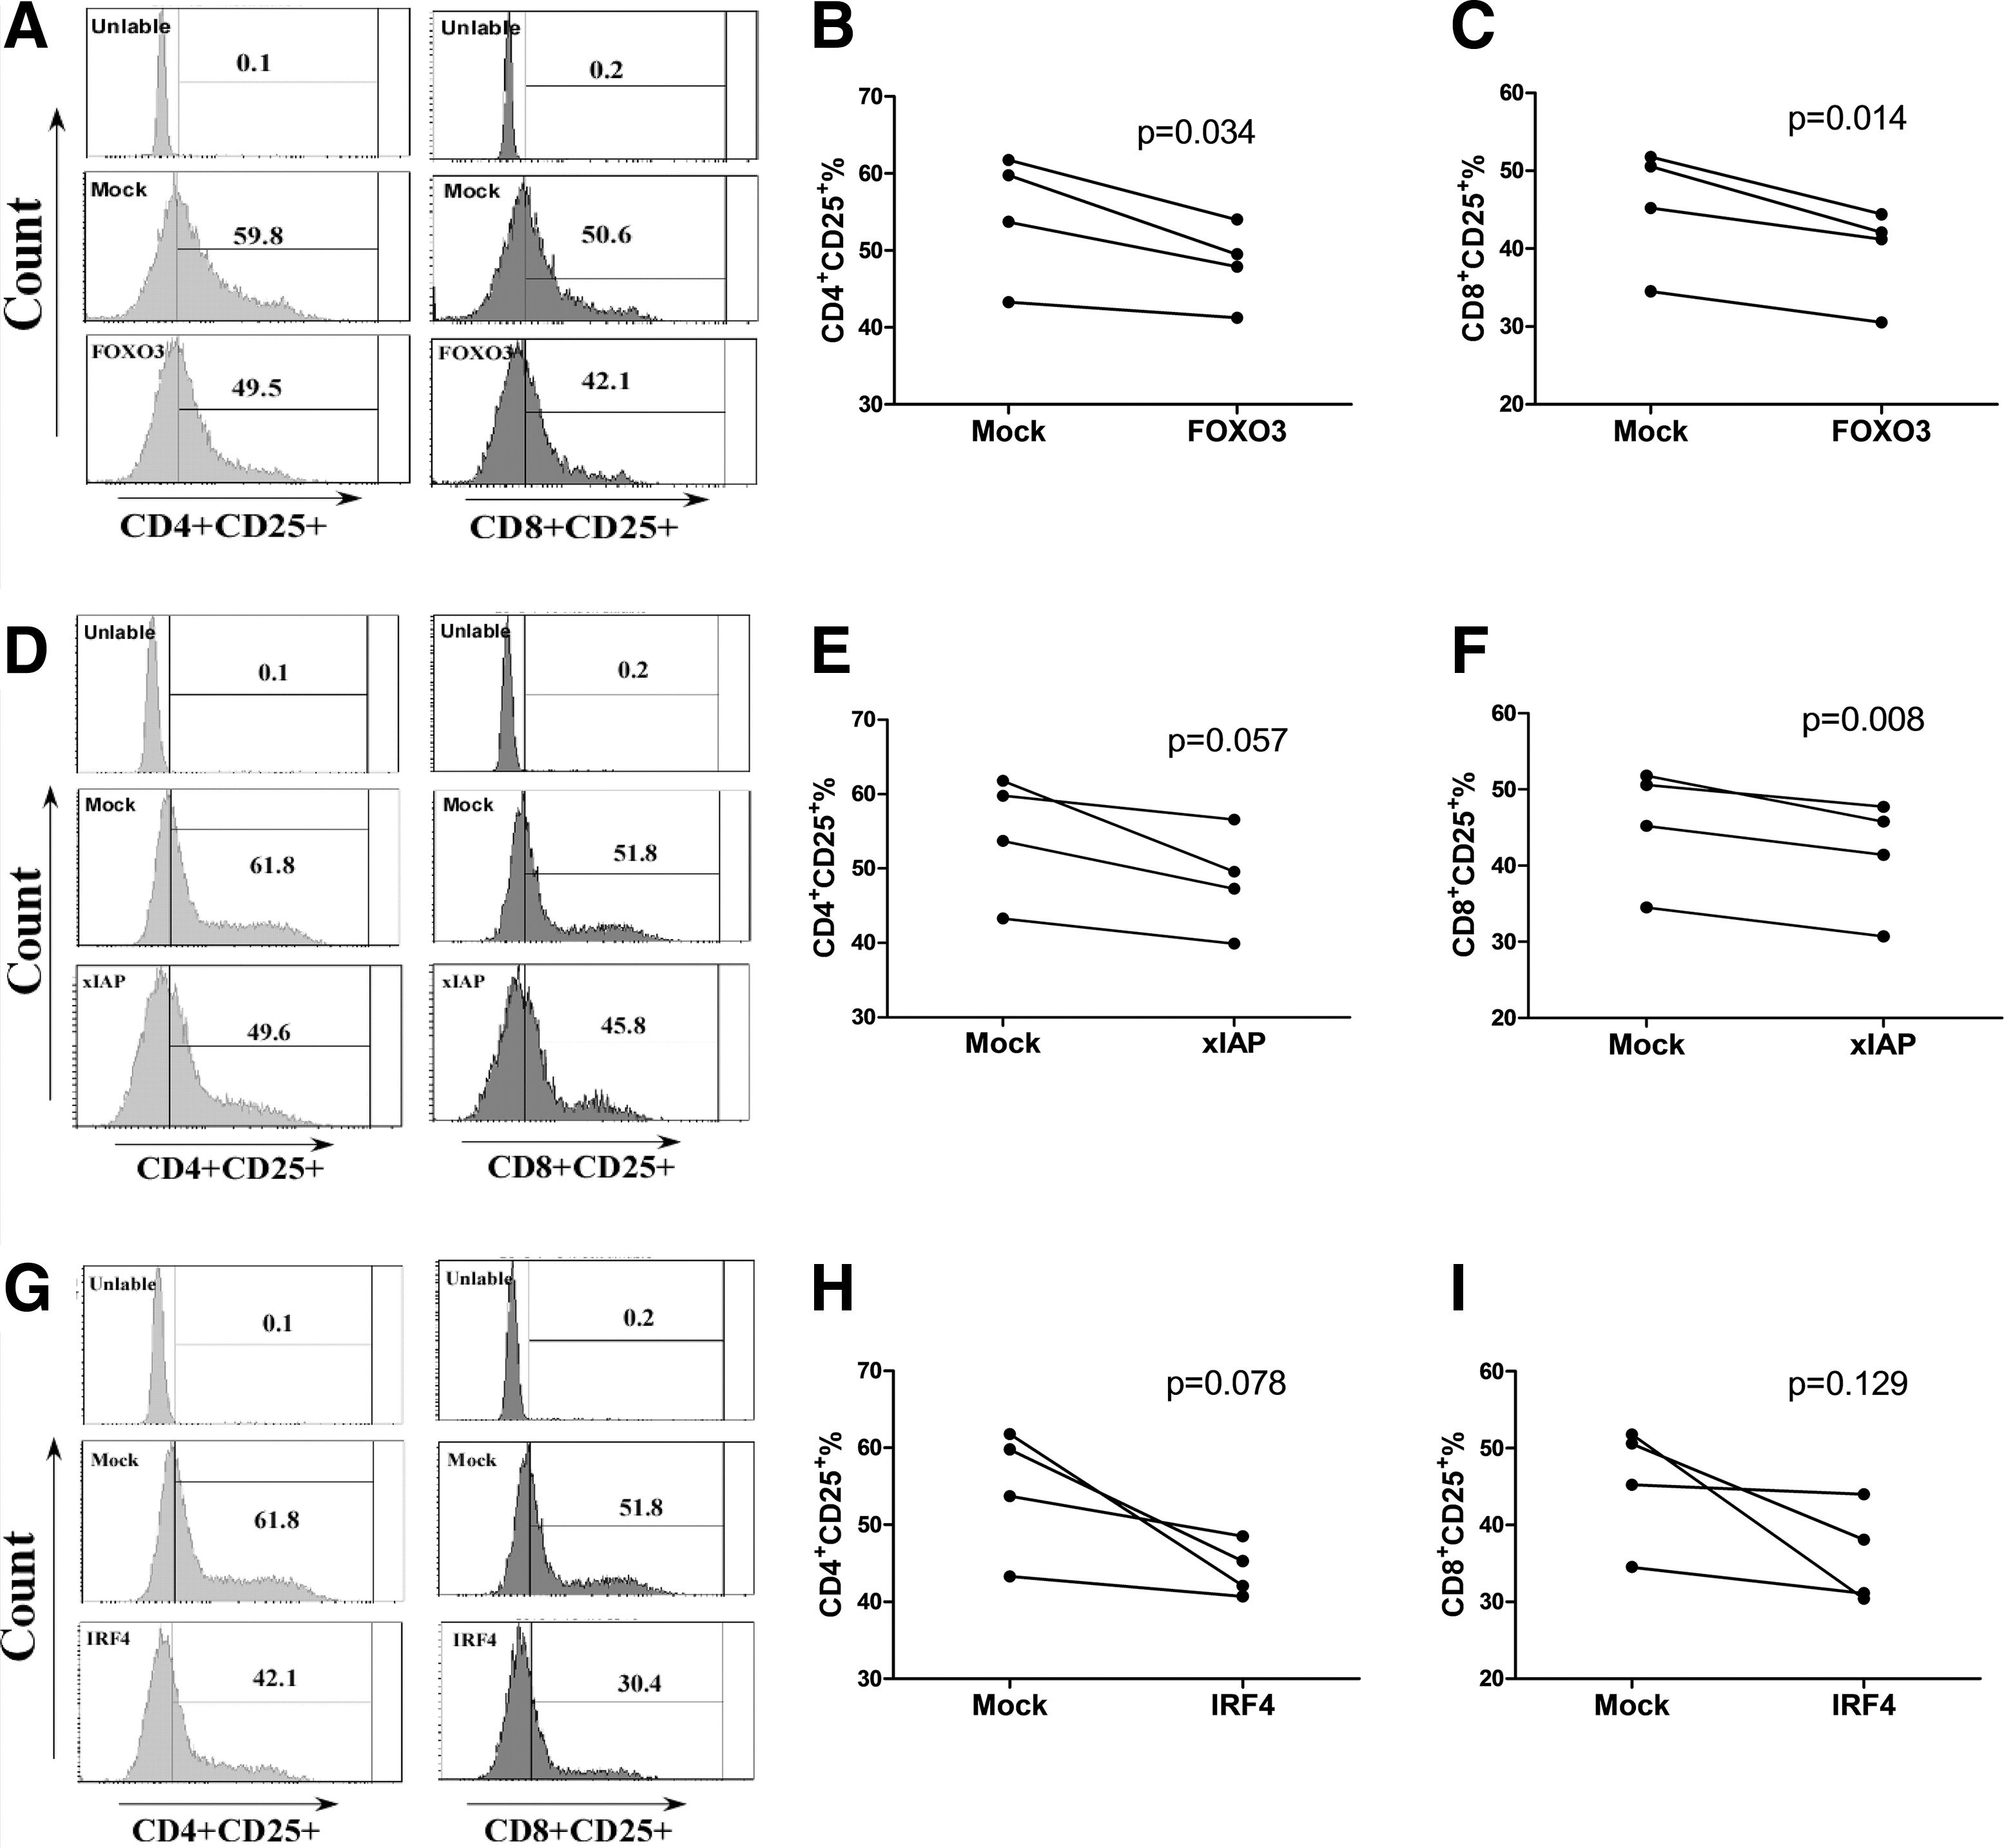
Inhibiting FOXO3 and xIAP expression influences T cell activation. Small interfering RNA (siRNA) was used to inhibit the expression of FOXO3, xIAP, and IRF4. Inhibiting FOXO3 decreased CD4+ and CD8+ T cell activation
Discussion
In this article, we chose MSM as research subjects because we have established a prospective multicenter and large-scale national cohort; through the continuous recruitment and follow-up we found that nearly 1/3 of MSM patients becoming RPs. Although viral diversity plays important roles in disease progression, the HIV strain of all eight RPs and six out of seven TP patients in this study was CRF01_AE strain (Supplementary Table S1) and the tropism of HIV isolated from these patients was CCR5 tropic (our unpublished data). These suggest that factors other than viral diversity may play important roles in the different disease progression between RPs and TPs patients. In our study, we quantified the mRNA levels of FOXO3, IRF4, xIAP, FOXO1, and ELF4 in PBMCs from RPs, TPs, and HCs. We provided the first evidence that the mRNA expression levels of FOXO3, IRF4, and xIAP were significantly increased in RPs, compared with those in HCs. Moreover, our data showed that the FOXO3 mRNA level was significantly positively correlated with the HIV-1 viral load (p = .046, r = 0.552; Fig. 2) and CD4+ T cell activation (p = .037, r = 0.736; Supplementary Fig. S4), which further proved that FOXO3 may be associated with HIV-1 disease progression. Previous studies indicated that FOXO3 promotes apoptosis, reduces the count of virus-specific CD8+ T cells, 24 and acts as a negative regulator of the CD8+ T cell response. 33 These findings remind us that FOXO3 may increase T cell apoptosis and weaken the CD8+ T cell response to reduce the control of the virus, ultimately accelerating disease progression. IRF4 was reported to be vital for sustaining the expansion and differentiation of effector CD8+ T cells, and IRF4 expression was regulated by the strength of TCR signaling. 17 In addition, IRF4 can cooperate with activator protein-1 (AP-1), 34 as AP-1 was considered to be generally involved in T cell activation 35,36 and specifically involved in CD4+ T cell activation after HIV-1 infection. 37 Therefore, we concluded that IRF4 may interact with AP-1 to promote T cell activation, leading to faster disease progression in RPs in our study. Furthermore, our results suggested that a higher expression of xIAP in RPs favors HIV-1 viral replication (HIV-1 viral load was higher in RPs than in TPs, p < .05; Supplementary Fig. S5), supporting a recent hypothesis that HIV-1 Tat protein delays apoptosis in CD4+ T cells and favors the persistent replication of HIV-1 in infected cells. 38 Our results suggested that FOXO3, IRF4, and xIAP play important roles in the rapid progression of HIV by regulating T cell activation, apoptosis, and other functions.
Aberrant T cell activation was associated with HIV disease progression. 39 We assessed T cell function by assessing T cell activation, apoptosis, differentiation, and proliferation. Our results were consistent with previous reports in children 10 ; moreover, we found that not only CD8+ but also CD4+ T cell activation was significantly increased in RPs and was strongly associated with disease progression. T cell apoptosis was significantly lower in EHI patients with low CD4 counts than in HCs. In addition, CD8+ TEM cell counts were sharply increased, whereas CD8+ Naive and TCM counts were significantly decreased in EHI patients with low CD4 counts compared with those in HCs. These changes were significantly correlated with HIV disease progression. The above results demonstrated that in the early stage of HIV-1 infection, T cell activation is markedly increased in RPs, and a variety of changes in other T cell phenotypes were also associated with accelerated disease progression.
There are few studies about FOXO3, IRF4, and xIAP, and immune activation during HIV-1 disease progression. Previous studies of FOXO3, IRF4, and xIAP were mostly focused on apoptosis, survival, cell differentiation using cell lines or mice as a research subject, but few studies on T cell activation on human primary cell and the exact molecular mechanisms are not very clear. We intended to discuss their function and validated the relationship between higher expression levels of FOXO3, IRF4, and xIAP and T cell activation we found in correlation analysis. We performed in vitro experiments involving TCR stimulation of PBMCs for different time lengths. We found gradual increases of IRF4 and xIAP expression and decreases of FOXO3 expression in a time-dependent manner with prolonged TCR stimulation, verifying that these gene transcripts are associated with T cell activation. Then, we used siRNA to inhibit the expression of each of these genes. We found that siRNA inhibition of FOXO3 significantly reduced both CD4+ and CD8+ T cell activation, while inhibition of IRF4 produced nonsignificant trends toward reduction of CD8+ and CD4+ T cell activation (p = .057). Inhibition of these genes had no significant effect on T cell proliferation (Supplementary Fig. S3). FOXO3, IRF4, and xIAP may not be the key factors involved in T cell proliferation as they did in T cell activation. Interestingly, the results were different when we studied the relationship between FOXO3 and T cell activation, as FOXO3 expression decreased in TCR-stimulated PBMCs, but reduced T cell activation was also seen with siRNA inhibition of FOXO3. This finding may due to an insufficient length of treatment time or an insufficient sample size for siRNA inhibition experiments, which could be improved in future studies. Moreover, for the TPs, not for RPs (RPs had received ART because their CD4+ T cells were very low and the viral loads were under detection), we analyzed the relationship between gene expression level and viral load after 1 year. We did not find that any of the selected gene expressions was significantly related with VL after 1 year (data not shown). Although the results are not sufficient, it may suggest a role of the selected genes may not affect the viral load. In summary, these results indicated that FOXO3, xIAP, and IRF4 play key roles in T cell activation.
In conclusion, we demonstrated that the expression levels of FOXO3, IRF4, and xIAP were significantly increased in RPs. Moreover, these genes were involved in T cell activation during EHI. These findings highlight potential new therapeutic avenues to reduce T cell activation by targeting IRF4, FOXO3, and xIAP during EHI, which might be beneficial to prevent HIV-1 disease progression.
Footnotes
Acknowledgments
This work was supported by a research grant, the Mega Projects of National Science Research for the 12th Five-Year Plan (2012ZX10001-006); National Natural Science Foundation of China (81371884) and fundamental and clinical medicine closed union platform-clinical evaluation technology platform of anti-HIV and antineoplastic new drugs (YDFZ-2013-5). The authors thank all of the patients for participating in this study and all of the physicians, nurses, and clinical providers for their help in this study.
Authors' Contributions
X.Z. designed the experiments, analyzed the data, and wrote the article. Z.Z., S.H., Y.F., and W.G. gave valuable advice in the designing of the experiments. Y.C. and N.Y. participated in the analysis of T cell activation. Z.Z. and Y.J. carried out determination of CD4+ T cell counts. H.S. designed the study with X.Z., verified and helped with interpretation of the data, and contributed to the writing. All authors read and approved the final article.
Author Disclosure Statement
No competing financial interests exist.
References
Supplementary Material
Please find the following supplemental material available below.
For Open Access articles published under a Creative Commons License, all supplemental material carries the same license as the article it is associated with.
For non-Open Access articles published, all supplemental material carries a non-exclusive license, and permission requests for re-use of supplemental material or any part of supplemental material shall be sent directly to the copyright owner as specified in the copyright notice associated with the article.