
Abstract
The pharmacokinetics (PK) of tenofovir-diphosphate (TFV-DP) and emtricitabine-triphosphate (FTC-TP), the active anabolites of tenofovir disoproxil fumarate (TDF), and emtricitabine (FTC) in blood, genital, and rectal compartments was determined in HIV-positive and seronegative adults who undertook a 60-day intensive PK study of daily TDF/FTC (plus efavirenz in HIV positives). Lymphocyte cell sorting, genital, and rectal sampling occurred once per subject, at staggered visits. Among 19 HIV-positive (3 female) and 21 seronegative (10 female) adults, TFV-DP in peripheral blood mononuclear cells (PBMC) accumulated 8.6-fold [95% confidence interval (CI): 7.2–10] from first-dose to steady-state concentration (Css) versus 1.7-fold (95% CI: 1.5–1.9) for FTC-TP. Css was reached in ∼11 and 3 days, respectively. Css values were similar between HIV-negative and HIV-positive individuals. Css TFV-DP in rectal mononuclear cells (1,450 fmol/106 cells, 898–2,340) was achieved in 5 days and was >10 times higher than PBMC (95 fmol/106 cells, 85–106), seminal cells (22 fmol/106 cells, 6–79), and cervical cells (111 fmol/106 cells, 64–194). FTC-TP Css was highest in PBMC (5.7 pmol/106 cells, 5.2–6.1) and cervical cells (7 pmol/106 cells, 2–19) versus rectal (0.8 pmol/106 cells, 0.6–1.1) and seminal cells (0.3 pmol/106 cells, 0.2–0.5). Genital drug concentrations on days 1–7 overlapped with estimated Css, but accumulation characteristics were based on limited data. TFV-DP and FTC-TP in cell sorted samples were highest and achieved most rapidly in CD14+ compared with CD4+, CD8+, and CD19+ cells. Together, these findings demonstrate cell-type and tissue-dependent cellular pharmacology, preferential accumulation of TFV-DP in rectal mononuclear cells, and rapid distribution into rectal and genital compartments.
Introduction
T
The major efficacy trials of oral PrEP involving sexual transmission of HIV have found potential differences in the protective effects of daily TDF/FTC in men who have sex with men compared with females. 5 –10 Part of this variability can be attributed to differences in adherence among these study populations. However, in addition, differential distribution of TDF/FTC in cellular and body compartments relevant to HIV acquisition, such as genital, rectal, and blood compartments, may also help inform different study outcomes in populations engaging in anal versus vaginal intercourse. 11 –13
The active intracellular anabolites of tenofovir (TFV) and FTC, tenofovir-diphosphate (TFV-DP), and emtricitabine-triphosphate (FTC-TP) drive the intended therapeutic effects of these agents. 14 TFV-DP and FTC-TP are ion-trapped inside of cells, resulting in relatively long intracellular half-lives, compared with TFV and FTC in plasma. Given the longer half-lives, daily dosing leads to gradual accumulation of the active anabolites inside cells until steady-state levels are reached. 15 This gradual increase in concentrations, and correspondingly slow elimination after drug cessation, may be relevant for the onset and duration of PrEP action, which is a timely topic as studies evaluate intermittent dosing strategies. 16 Therefore, pharmacologic studies of TDF/FTC should include TFV-DP and FTC-TP and, when possible, should also define drug accumulation and elimination in various compartments. An additional consideration is the effect of HIV serostatus on intracellular TFV-DP and FTC-TP, given the differing immune activation profile in HIV-negative versus HIV-positive individuals. 15
Single-dose studies of TDF/FTC demonstrate distribution differences for TFV-DP and FTC-TP in rectal versus vaginal compartments, which may have relevance to PrEP efficacy differences in men versus women. 13,17 Studies are needed that include the pharmacokinetics (PK) from the first dose to steady state in these compartments. This study aimed to provide a comprehensive description, from first dose to steady state, of TFV, FTC, TFV-DP, and FTC-TP in blood, genital, and rectal compartments in HIV-positive and seronegative males and females.
Methods
Study design
Cell PrEP was a prospective, observational, intensive, PK study in HIV-positive and HIV-negative adult volunteers aged 18–55 years, conducted at the University of Colorado Anschutz Medical Campus (ClinicalTrials.gov Identifier: NCT01040091). The study was approved by the institutional review board, and participants provided written informed consent before participation. HIV-negative subjects received daily oral TDF 300 mg/FTC 200 mg as Truvada® for 30 days, and HIV-positive subjects received daily Truvada plus efavirenz for 60 days. HIV-negative subjects had washout visits on days 35, 45, and 60, and HIV-positive subjects had one follow-up visit on day 60.
The timing of study visits is shown in Supplementary Figure S1 (Supplementary Data are available online at
Subjects were asked to fast overnight, beginning at 10 pm, before their dosing visits (first dose, days 3, 7, 20, and 30). On days 1 (first dose) and 30, blood was collected at 1, 2, 4, 8, and 24 h postdose, and on days 3, 7, and 20, blood was collected predose, 2, and 8 h postdose. For HIV-negative volunteers, a single blood sample was collected during drug washout on days 35, 45, and 60. For HIV-positive subjects, a single blood collection was obtained on day 60 (therapy was not discontinued).
All participants underwent additional collections that included a genital sample, a rectal sample, and an extra blood collection for sorting CD4+, CD8+, CD14+, and CD19+ cells. Each participant underwent each additional collection once, at staggered visits, such that equal numbers of subjects had an additional collection at each of the five dosing visits (days 1, 3, 7, 20, and 30). The timing of the additional collections was assigned at enrollment. The rectal biopsy and cervical cell specimens were collected at 2 h postdose to enable pairing with the blood collection at that time point, but this was not possible for the home-collected semen specimen.
Sample collection
A brief description of sample processing for all collections is provided below. A more detailed description can be found in the Supplementary Data.
Plasma and PBMC processing
Blood was collected in EDTA vacutainers for plasma separation. Cell preparation tube (CPT) vacutainers were used to isolate peripheral blood mononuclear cells (PBMC), which were counted with an automated hemocytometer and lysed according to standardized procedures. 18,19 For isolation of CD4+, CD8+, CD14+, and CD19+ cells, PBMC were collected as above and labeled for purification by flow cytometry before counting and lysing.
Genital sample processing
Genital sampling was assigned to one of the study days (either first dose, day 3, 7, 20, or 30) and did not take place on the same day as the rectal biopsy. Cervicovaginal fluid (CVF) was collected using a volumetric aspiration device (Aspirette® Endocervical Aspirator; Cooper Surgical). The cervical brush collection was conducted by inserting a cytobrush into the cervical os and rotating. Cervical cells were scraped from the sampling brush by passing the brush through a scraping device (Combitips Plus 0.5 ml repeater tip with the end of the tip clipped) ∼20 times. Cells were counted, assessed for viability, and lysed.
Male subjects were asked to bring a semen sample from home, to be collected ∼24 h postdose, using a study-supplied sterile container, zip-locked bag, and hard-sided transport vessel. The subject recorded the time the sample was collected on a study form. Seminal fluid and nonspermatozoal mononuclear cells were separated; cells were counted, assessed for viability, and lysed.
Rectal sample processing
Approximately 20 pinches of rectal tissue located ∼6" to 10" into the rectum were collected by a gastroenterologist during sigmoidoscopy using a 3-mm forceps. Mononuclear cells were isolated by tissue digestion followed by counting, viability assessment, and lysing.
Analytic, PK, and statistical analyses
Analytic analysis
TFV and FTC in blood plasma were assayed using validated methodology with a lower limit of quantification of 10 ng/ml. 20 An ultrasensitive plasma assay was used for CVF and seminal plasma, with a lower limit of quantitation of 0.25 ng/ml. For this method, CVF and seminal plasma were diluted with blood plasma by ≥20-fold. The dilution step created lower limits of quantitation in these matrices ranging from 5 to 62.5 ng/ml.
TFV-DP and FTC-TP concentrations in lysed cellular matrices were assayed with a validated liquid chromatography-tandem mass spectrometry method, as described previously. 18 The lower limit of quantification was 2.5 fmol/sample for TFV-DP and 0.1 pmol/sample for FTC-TP. Based on the number of cells per sample, values were converted to pmol or fmol/106 cells. Genital and rectal samples had average cell viabilities below 80%, so the number of viable cells assayed was used for the above conversion. In addition, analyses using total cells were included in the Supplementary Data. Supplementary Table S1 lists the numbers of genital and rectal samples available, the number of samples with values below the limit of quantification (BLQ), and the average percentage of viable cells by sample type.
PK analysis
Several approaches were used to assess PK. For dose 1 and day 30, a noncompartmental analysis (NCA) using Phoenix 64 WinNonlin® (Pharsight, Certara™) was performed, providing area under the curve [AUC(0–24)] in plasma and PBMC. On occasions when the 24-h sample was missing (n = 3), the value was imputed from the NCA. The accumulation factor (AF) was estimated as the ratio of the day 30 AUC(0–24) to the dose 1 AUC(0–24). 21,22 The effective half-life was estimated from the AF [ln(2) τ/(ln(AF)/(AF −1))]. The average steady-state concentration (Css) for dose 1 and day 30 was defined as AUC(0–24) divided by the dose interval (24 h).
In addition, two other methods were used to estimate half-lives. First, linear regression [following natural log (ln) transformation] for TFV and FTC in plasma within the first-dose interval (using terminal elimination points), and TFV-DP and FTC-TP in PBMC from the washout phase among the HIV-negative participants who completed the study (n = 19). Second, a one-compartment constant drug input model was fit to each individual's data from day 1 to 30 using Phoenix 64 WinNonlin for TFV-DP in PBMC only, which provided Css and half-life estimates. The rationale for using multiple PK approaches was to assess comparability as published studies report variable half-lives and Css for TFV-DP. 17,23 –27 Supplementary Table S2 summarizes the methods used to calculate half-life estimates and resulting values for plasma and PBMC.
Only one concentration was available from each participant for rectal mononuclear cells, seminal mononuclear cells, seminal fluid, cervical cells, CVF, and isolated lymphocyte cell types (CD4+, CD8+, CD14+, CD19+), and so, these concentrations were characterized using a naive pooled nonlinear regression model (similar to the constant input model above) with weighting based on viable cells assayed, using R (
Statistical analysis
Multivariable linear regression was used to determine associations between covariates and PK in the blood compartment. Css values were ln-transformed before analyses. First-dose AUC (and corresponding Css) estimates were the focus for plasma and PBMC to maximize data availability (to include those who withdrew early from the study) and because the values were not influenced by potential adherence variability or concomitant use of efavirenz in the HIV-positive group (first-dose blood draws occurred before intake of efavirenz). The covariates analyzed were HIV status, sex, race, estimated glomerular filtration rate (eGFR; calculated using the modification of diet in renal disease equation), and weight. A p-value of <.05 was considered significant for these secondary analyses with no adjustments made for multiple tests. Data are reported as mean or geometric mean and 95% CI.
Results
Subject characteristics
Nineteen HIV-positive (3 female) and 21 seronegative (10 female) adults participated in the study. Participant demographics are listed in Table 1. All but six participants, one female and five males, completed all study visits; one participant withdrew before any dosing visits, and the other five before the day 30 visit. The female participant (HIV positive) was removed due to substance abuse, and two male participants had laboratory abnormalities requiring removal per protocol [Grade 2 low phosphorus (HIV negative) and asymptomatic Grade 4 elevation in ALT (HIV positive)]. Three male participants withdrew for the following reasons: transportation difficulties (HIV positive), personal issues (HIV negative), and nausea (HIV positive). Study drug was generally well-tolerated. Three HIV-negative participants reported moderate adverse events (Grade 2), two related to anxiety and one due to nausea/vomiting. Seven HIV-positive participants reported Grade 2 adverse events, most were related to central nervous system complaints likely associated with efavirenz. 28
eGFR, estimated glomerular filtration rate.
A total of five and six doses were missed (by pill count and patient self-report) by HIV-negative and HIV-positive participants, respectively, over the day 1–30 dosing visits (i.e., >99% adherence by these measures).
Parent TFV and FTC distribution
Plasma PK
For TFV, the average Css (AUC0–24/τ) following the first dose was 64 ng/ml (95% CI: 57–70) versus 101 ng/ml (88–114) on day 30 (Table 2 and Supplementary Fig. S2). The average AF was 1.7 (1.4–1.9) and effective half-life was 19 h (15–22). When determined as the elimination slope in the first-dose interval, the TFV half-life was 13 h (12–15).
n = 20 as two AF values were <1.
n = 32 as two AF values were <1.
95% CI, 95% confidence interval; AF, accumulation factor; Css, steady-state concentration; PBMC, peripheral blood mononuclear cells; TFV, tenofovir; TFV-DP, tenofovir-diphosphate.
For FTC, the average Css was 381 ng/ml (348–413) following the first dose versus 431 ng/ml (384–478) on day 30 (Table 3). The average AF was 1.2 (1.0–1.3) and effective half-life was 11 h (7.7–14), compared with 5.2 h (4.7–5.6) when estimated within the first-dose interval. Using the effective half-life estimates, Css would be achieved in ∼61 h (49–74) for TFV and 36 h (25–46) for FTC. Supplementary Table S2 lists results for half-life estimates derived from different approaches for both TFV and FTC.
n = 16 as six AF values were <1.
n = 9 as three AF values were <1.
n = 25 as nine AF values were <1.
n = 20 as two AF values were <1.
n = 32 as two AF values were <1.
FTC, emtricitabine; FTC-TP, emtricitabine-triphosphate.
In the multivariable regression model adjusted for HIV status and sex, an association was found between eGFR and first-dose Css for FTC; every 10 ml/min increase in eGFR (range: 66–130.8 ml/min) was associated with a 4.9% (95% CI: 0.5%–9.0%) decrease in FTC Css (p = .03). First-dose Css also trended toward significance for TFV (p = .06). First-dose FTC Css in males was found to be 19.6% (3.9%–32.7%, p = .02) lower relative to females in a model adjusted for eGFR and HIV status.
Genital fluid PK
Compared with Css in plasma, Css in the genital compartments was higher for both drugs in both sexes (Fig. 1). For TFV and FTC in CVF, Css was 273 ng/ml (95% CI: 60–486) and 2,020 ng/ml (1,333–3,062), respectively. Despite limited data, Css was reached in ∼0.60 days (0.01-outside data range) and 0.34 days (0.31–0.37), respectively. Empirically, Figure 1 shows rapid drug distribution and attainment of steady state in CVF.
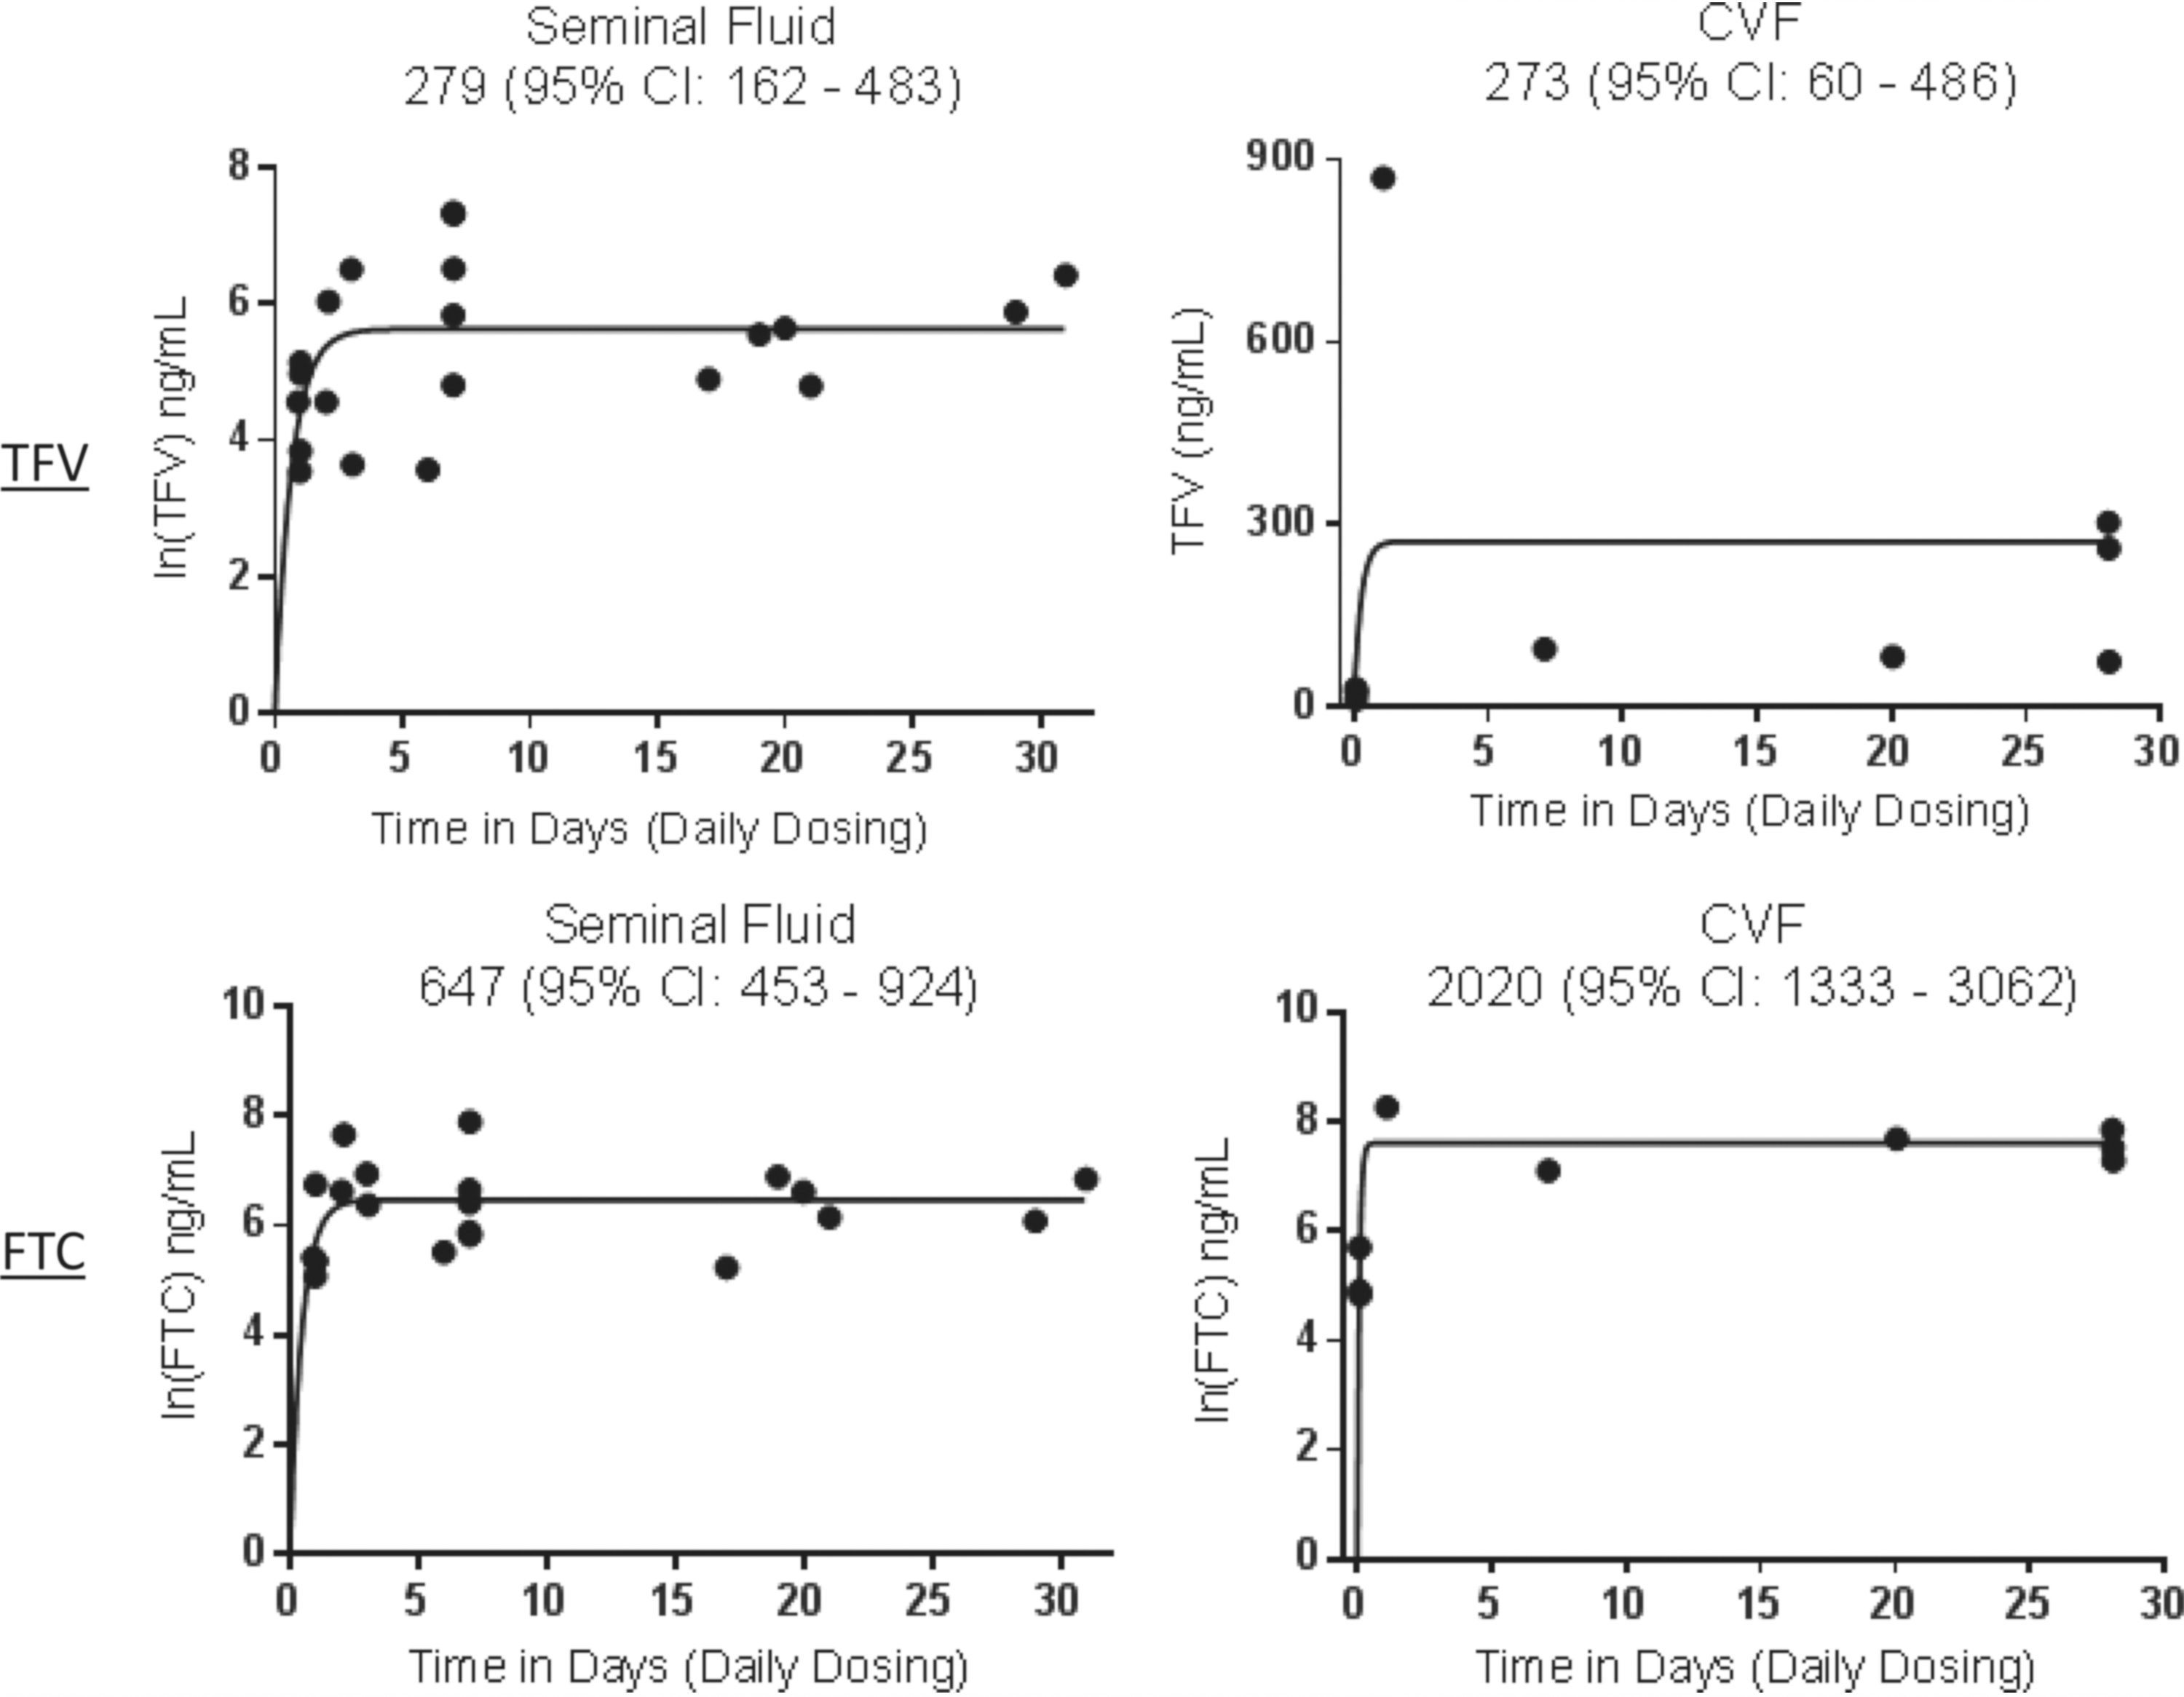
Genital fluid TFV and FTC concentration–time curves stratified by sex. All available CVF and seminal fluid data, with the exception of TFV in CVF, from female and male participants, respectively, were ln transformed before fitting with a one-phase exponential association model; Ct = Css × (1 − e−K × t), where Ct is the averaged drug concentration at time t, Css is the fitted steady-state drug concentration, and K is the fitted first-order elimination rate constant. Css and corresponding 95% confidence intervals are shown for each graph. Css, steady-state concentration; CVF, cervicovaginal fluid; FTC, emtricitabine; TFV, tenofovir.
For men, the estimated seminal fluid Css for TFV and FTC was 279 ng/ml (95% CI: 162–483) and 647 ng/ml (95% CI: 453–924), respectively. Time to steady state was 2.6 days (2.2–3.1) and 2 days (1.8–2.2), respectively, indicating rapid distribution and attainment of steady state in semen.
TFV-DP and FTC-TP cellular pharmacology
PBMC PK
The Css TFV-DP following the first dose was 14 fmol/106 cells (95% CI: 11–17) compared with 95 fmol/106 cells (85–106) on day 30 (Table 2). The average AF was 8.6 (7.2–10) and effective half-life was 5.6 days (135 h; 4.6–6.6), corresponding to ∼18 days to reach steady state. For FTC-TP, the Css following the first dose was 3.5 pmol/106 cells (3.2–3.8) versus 5.7 pmol/106 cells (5.2–6.1) on day 30 (Table 3). The average AF was 1.7 (1.5–1.9) and effective half-life was 19 h (17–22), corresponding to ∼2.6 days to reach steady state.
When estimated in the washout phase in HIV-negative subjects (n = 19; 10 women), the half-life estimates were 4.4 days (106 h; 3.7–5.1) for TFV-DP and 2.3 days (54 h; 2.0–2.5) for FTC-TP. When all concentrations from days 1 to 30 were fit with a constant input model (n = 34), the estimated Css and half-life for TFV-DP were 97 fmol/106 cells (85–108) and 3.4 days (2.9–3.9) corresponding to ∼11 days (9.6–13) to reach steady state. Eleven days is consistent with empirical observations (Supplementary Fig. S3) where mean concentrations from day 7 (which included days 6–8) were 72 fmol/106 cells, or 76% of Css. Supplementary Table S2 lists results for half-life estimates derived from different approaches for both TFV-DP and FTC-TP.
The first-dose FTC-TP Css was 20% (3%–39%; p = .02) higher in HIV-positive versus seronegative participants. However, this was reversed at day 30, where FTC-TP was 6.4% (−22% to 13%) lower in HIV-positive participants, although this did not reach statistical significance (p = .48). TFV-DP was lower in HIV-positive versus seronegative participants at both visits, −8.3% (−35% to 30%) and −16.4% (−34% to 6.7%), respectively, although neither reached significance (p ≥ .14). Figure 2 displays the Css values for TFV-DP and FTC-TP stratified by HIV serostatus.

Css of TFV-DP and FTC-TP in PBMC at day 1 and 30 stratified by HIV serostatus. The noncompartmental analysis Css results from day 1 to 30 were plotted and connected per participant. The geometric mean and 95% confidence intervals for Css values are shown for each time point. FTC-TP, emtricitabine-triphosphate; PBMC, peripheral blood mononuclear cells; TFV-DP, tenofovir-diphosphate.
In terms of other covariates, for TFV-DP, each 5 kg increase in weight (range: 56.5–127 kg) was associated with a 10% (0.25%–21%, p = .045) increase in first-dose Css in a model adjusted for race and HIV status.
CD4+, CD8+, CD14+, and CD19+
The Css for TFV-DP in CD14+ was 105 fmol/106 cells (95% CI: 87–127) and that for FTC-TP was 10 pmol/106 cells (8.9–12), which were comparable (or higher) than unfractionated PBMC. Css appeared to be on the steady-state plateau by 3 days in CD14+. Css values in CD4+, CD8+, and CD19+ were less than half those in CD14+ cells for both anabolites. Accumulation in these other cell types appeared to be more gradual than that in CD14+ cells (Supplementary Fig. S4).
Genital cell PK
Relative to average Css in PBMC, seminal cell concentrations in men were lower for TFV-DP and FTC-TP; 22 fmol/106 cells (95% CI: 6–79) and 0.3 pmol/106 cells (0.2–0.5), respectively. Despite limited data, modeling indicated that Css was reached in ∼11 days (6–17) and 1.5 days (1.4–2.1), respectively. Empirically, Figure 3 indicates that both cellular moieties exhibited concentrations within the steady-state range within the first week of dosing.

Cervical cell and seminal mononuclear cell TFV-DP and FTC-TP concentration–time curves stratified by sex. TFV-DP and FTC-TP data were ln transformed before fitting with a one-phase exponential association model (similar to Fig. 1). Css and corresponding 95% confidence intervals are shown for each graph.
Cervical cell concentrations in females were comparable with PBMC, TFV-DP Css was 111 fmol/106 cells (64–194), and FTC-TP was 7 pmol/106 cells (2–19) (Fig. 3). Despite limited data, Css was reached in ∼15 days (12–17) and 28 days (15-outside data range), respectively. However, like above, inspection of Figure 3 indicates that both cellular moieties exhibited concentrations within the steady-state range within the first week of dosing. Supplementary Figure S5 depicts total genital cell concentrations for TFV-DP and FTC-TP, respectively.
Rectal mononuclear cell PK
TFV-DP concentrations in rectal mononuclear cells were higher than both PBMC and genital cells (Fig. 4). TFV-DP concentrations reached 1,450 fmol/106 cells (95% CI: 898–2,340) and steady state was reached in ∼5 days (4.3–5.5). Different kinetics was observed for FTC-TP, as Css was 0.8 pmol/106 cells (0.6–1.1), which was lower than in PBMC. Concentrations appeared rapidly, Css was reached in ∼0.1 days (2.4 h, <0.1, 0.2). Supplementary Figure S6 depicts total rectal cell concentrations for TFV-DP and FTC-TP.
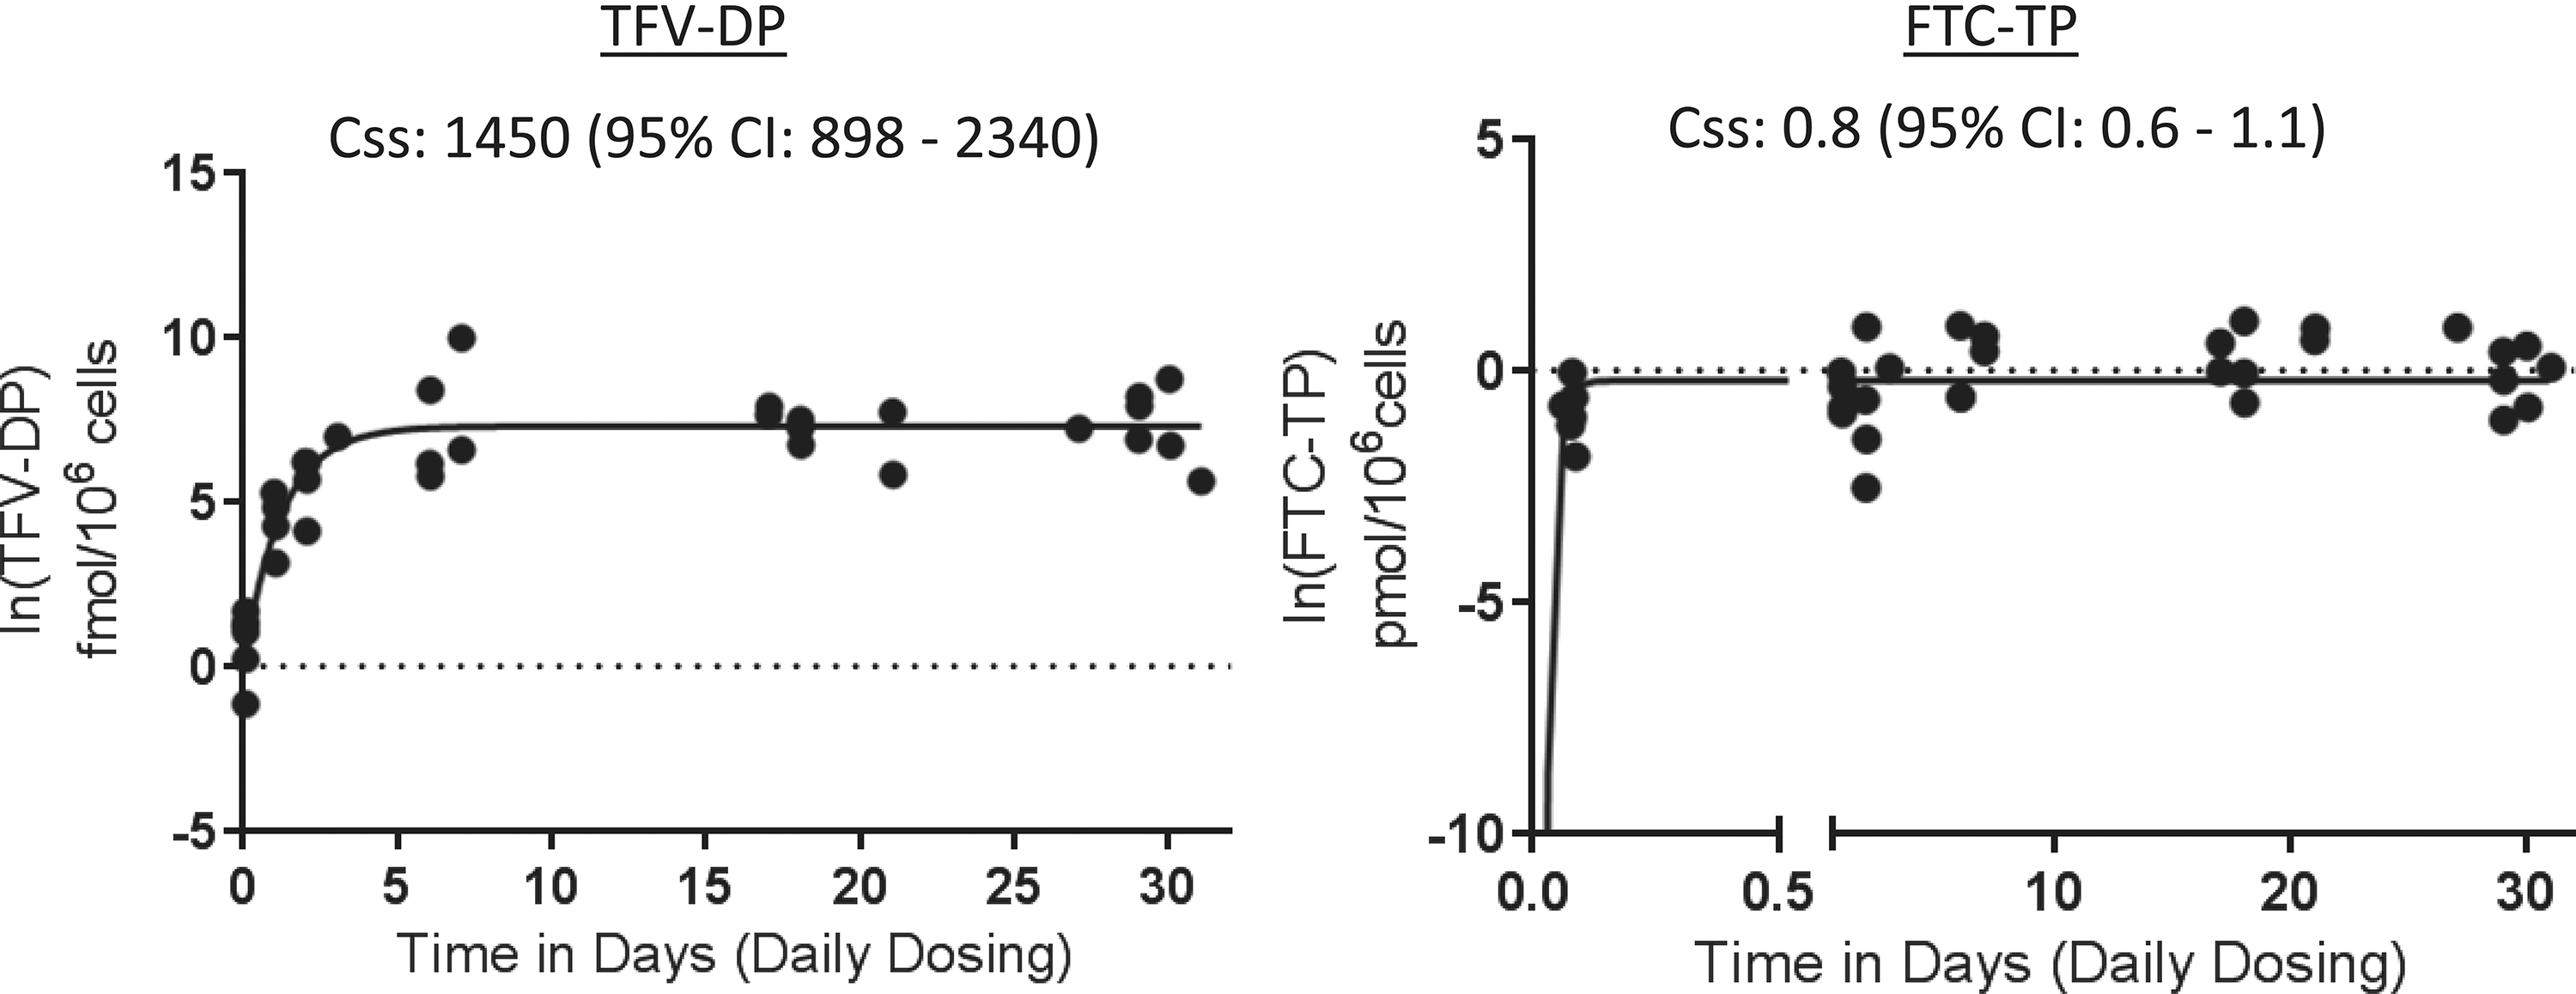
Rectal mononuclear cell concentration–time curves for TFV-DP and FTC-TP. TFV-DP and FTC-TP data were ln transformed before fitting with a one-phase exponential association model (similar to Fig. 1). Css and corresponding 95% confidence intervals are shown for each graph.
Discussion
The aims of this study were to characterize the accumulation characteristics of TFV-DP and FTC-TP in PBMC compared with genital and rectal compartments, and to determine if HIV-negative versus HIV-positive individuals exhibited different PBMC pharmacology, all of which are important for understanding PrEP efficacy.
A striking finding was the high accumulation of TFV-DP in rectal mononuclear cells, where concentrations reached steady state in 5 days with levels more than 10 times higher than those in PBMC, cervical, or seminal cells (Fig. 4). This finding adds to single-dose studies that showed high TFV-DP in rectal tissue homogenates and cells. 13,17 FTC-TP appeared rapidly in this compartment, despite concentrations being lower, compared with PBMC. Together, these findings provide a pharmacologic basis for high rectal protection from HIV transmission in men who have sex with men (MSM), which has been observed in multiple PrEP trials. 5,16,29 –31
In the iPrEX-Open Label Extension, PrEP-Demonstration Project, and ATN110 studies, no new cases of HIV acquisition were observed in MSM participants estimated to be taking four or more doses of TDF/FTC per week. 29,32,33 In addition, the Ipergay study showed an 86% reduction in HIV acquisition in MSM, where the dosing strategy was event driven and the average number of tablets per week was 3.75. 16 In terms of onset of PrEP action in MSM, data from the present study were analyzed with iPrEx regression models showing an estimated HIV risk reduction of 77% (95% CI: 40%–93%) after one dose, 89% (51%–98%) after two doses, 96% (60%–100%) after three doses, and 98% (67%–100%) after four doses. 19,34 Taken together, these data help define in vivo dose–response in MSM, indicating high efficacy and PK forgiveness, all of which is consistent with rapid appearance of FTC-TP and high and rapid accumulation of TFV-DP at the site of exposure (i.e., rectal compartment).
In contrast to the rectal compartment, TFV-DP and FTC-TP in the genital compartments were lower than or similar to PBMC levels. Unfortunately, these analyses comprised fewer concentrations than rectal analyses, which included both sexes, and this created uncertainty with respect to PK modeling assumptions. For these reasons, the time to steady-state estimations, in particular, was less reliable, motivating empiric observations to help with interpretation.
In men, steady-state seminal fluid concentrations of parent TFV and FTC were similar or higher than plasma concentrations, whereas TFV-DP concentrations in seminal mononuclear cells were ∼1/5th those in PBMC, and FTC-TP was ∼1/25th those in PBMC. Parent and intracellular moieties achieved concentrations consistent with steady state within 7 days of dosing (Figs. 1 and 3), suggesting a rapid onset of action in this compartment. Importantly, however, it is likely that target cells in penile tissue (i.e., foreskin, urethra) are relevant for HIV acquisition in males. Unfortunately, little is known about the concentration–effect relationship in these cells. Thus, while these findings provide insight into drug distribution in vivo, interpretations for PrEP are not possible because mononuclear cells in semen were analyzed in this study, and these cells may differ anatomically, histologically, and functionally from target cells in penile tissue.
In women, Css TFV and FTC in CVF were higher than plasma and reached steady state within a day, despite wide CIs, which is consistent with inspection of Figure 1. TFV-DP and FTC-TP Css in viable cervical cells was similar to those in PBMC. Importantly, the cervical cell samples were predominately epithelial cells, as opposed to isolated mononuclear cells, so these concentrations should also be interpreted carefully as epithelial cells are not target cells for HIV. Time to steady state for TFV-DP and FTC-TP was 2 and 4 weeks, respectively, but examination of Figure 3 shows concentrations consistent with steady state within a week (days 1–7).
These differences underscore the limitations of sparse data in terms of modeling assumptions. Previous studies using single-dose data suggest TFV-DP and FTC-TP reach steady state in 3 and 2 days. 35 Empirically, our findings are consistent with this model, but additional multiple-dose studies are needed to definitively address this question. As a note, these concentrations do not translate to topical dosing, where genital concentrations far exceed those achieved with oral dosing. 13,23 Exposure–response relationships may differ for oral versus topical drug delivery because systemic concentrations may contribute to effect, and these delivery routes yield significantly different systemic concentrations. 34
In terms of in vivo PrEP efficacy in heterosexual male and female populations, daily oral TDF alone and TDF/FTC were ∼90% effective in both sexes when adherence was high. 6,7,36 Conversely, two clinical trials among young, heterosexual African females failed to show efficacy of either daily oral TDF or TDF/FTC, which has been attributed to very low adherence (∼30%) among participants. 8,9 Efficacy at intermediate adherence levels and in vivo dose–response relationships have not been elucidated for cervicovaginal or penile exposures, to the same extent as described above for rectal exposures in MSM.
This type of in vivo information is important because questions remain regarding preferential PrEP efficacy in MSM versus heterosexual males and females (presumably because of preferentially high TFV-DP in rectal tissue). A recent meta-analysis of PrEP trials did not identify different efficacy in MSM versus other populations, once adherence was taken into account. 37 Furthermore, it showed that TDF and TDF-FTC were equally effective PrEP agents, particularly in heterosexual persons, which is not consistent with in vitro models, where tissue efficacy in women heavily depended on FTC contributions. 35 This underscores the need for additional work to determine if women and men respond differently to PrEP, which is relevant for guiding future dosing strategies under study. 38 –40
HIV-negative individuals had slightly lower first-dose FTC-TP AUC0–24 (20%) compared with HIV-positive individuals, but this did not persist at day 30 (Fig. 2). FTC-TP at day 30 and TFV-DP at day 1 and 30 were generally lower in HIV-positive individuals (although not statistically significant), which is consistent with a previous study that found slightly lower lamivudine-triphosphate and zidovudine-triphosphate in HIV-positive versus HIV-negative individuals. 41 These small differences merit additional study, but are not likely to be clinically relevant given the small magnitude of effects (95% CIs for differences were ≤35%). Other covariate analyses identified minor relationships among plasma and PBMC drug concentrations with eGFR, weight, and sex. Taken together, these findings provide reassurance that TDF and FTC cellular pharmacology is similar for PrEP and treatment.
In addition to the compartmental differences highlighted above, TFV-DP and FTC-TP demonstrated unique pharmacology across cell types as well. In purified lymphocytes from blood, TFV-DP and FTC-TP accumulated more quickly and to higher concentrations in CD14+ cells (monocytes) relative to CD4+, CD8+, and CD19+ cells. CD14+ cells are approximately two to three times larger than CD4+, CD8+, and CD19+ cells, which may explain the higher concentration when normalizing to cell count, but not the faster accumulation. 42 Monocytes become macrophages upon entering tissue indicating that these findings may be relevant for the macrophage reservoir. Monocyte-derived macrophages express CCR5 and can be targeted by HIV upon initial exposure, and thus, high concentrations of TFV-DP and FTC-TP may be important for protection in this subset of cells. 43 The lower concentrations (but similar accumulation) in purified CD4+, CD8+, and CD19+ cells relative to PBMC may represent cell loss during the sorting procedure.
Various mechanisms may be responsible for the compartmental differences observed in this study. One such possibility is that potentially different cell types were assayed depending on the tissue, which included mononuclear cells and epithelial cells. For example, if tissue mononuclear cells had a high fraction of CD14+/macrophages, this may have increased concentrations, as described above. Other in vitro studies have observed higher TFV-DP in epithelial cells versus blood macrophages and CD4+ T cells, providing another cell-type mechanism for differences. 44
In terms of anatomical considerations, high TFV-DP in rectal cells may be associated with a significant fraction of the dose being unabsorbed (bioavailability is 30% for the tenofovir component), leading to high TFV concentrations retained in the gastrointestinal lumen. 45 Single TDF dose studies in macaques and humans show slow appearance of TFV concentrations in rectal secretions, peaking at 24 h postdose, which is consistent with gastric transit time. 46,47 FTC has >90% bioavailability, demonstrating more complete absorption. 48 Consistent with this, single-dose studies in macaques show earlier appearance of FTC in rectal fluids, indicating systemic delivery to that compartment. 46 Our study also showed rapid appearance of FTC-TP in rectal cells.
Important for this discussion is the relative expression and activity of drug transporters and intracellular kinases responsible for phosphorylating TFV and FTC in cells and tissues. 49 –51 For example, Lade et al. 49 found that two pyruvate kinase isozymes [-muscle (PKM) and -liver and red blood cell (PKLR)] convert the monophosphate of TFV to TFV-DP in PBMC and vaginal tissue, however, a different kinase, creatine kinase muscle (CKM), catalyzes this conversion in colorectal tissue. 49 This suggests that drug activation may vary by tissue type. Taken together, these pharmacological observations underscore the importance of tissue- and cell-specific considerations, which inform local drug concentrations relevant for PrEP as well as sanctuary compartments during chronic HIV infection. 52
This study evaluated several methods for determining TFV-DP and FTC-TP PK because of heterogeneity in published values. Heterogeneity likely arises from differing participant demographics, single- versus multiple-dosing trial design, TDF used alone or in combination with FTC and/or with other antiretroviral agents, PK assumptions, and varying methodology for specimen processing and testing (e.g., tissue homogenate versus isolation of mononuclear cells within tissue). 13,17,23,41,53 –58 For instance, published estimates of average Css and half-life for TFV-DP in PBMC range from ∼35 to 500 fmol/106 cells and 48 to 180 h, respectively. 15,17 –19,23 –27,60
The Css and half-life estimates in the present study were well within these ranges (i.e., 95–97 fmol/106 cells and 84–135 h). The FTC-TP findings were interesting in that the effective half-life estimate was 19 h, but the terminal elimination half-life was 54 h, consistent with other studies (39 h). 61 This suggests some nonlinearity in kinetics for FTC-TP in PBMC. Similar nonlinearity was suggested for TFV-DP, where the effective half-life was 5.6 days, but steady state appeared to be reached by ∼11 days (less than two effective half-lives). Nonlinearity and multiple elimination phases have been reported in other studies for TFV-DP. 17,62,63
To address these limitations, noncompartmental and empirical approaches were included in our analyses, but further modeling and simulation studies are needed (and under way) to characterize TFV-DP and FTC-TP PK. Our study adds to previous studies in terms of the inclusion of HIV-negative and HIV-positive individuals (and diversity in race and sex), the intensiveness of sampling, and the inclusion of kinetics from first dose to steady state.
This study had limitations, some of which were highlighted above. In particular, the sample size was relatively small, so some PK assumptions and half-life estimates in genital compartments were not reliable, and covariate analyses were limited to identifying only moderate to large differences (i.e., those likely to be clinically relevant). In addition, cell processing procedures have inherent limitations, including loss of drug during processing; contamination with epithelial cells for cervical cell samples (and to a lesser extent, rectal mononuclear cell samples); spermatozoa contamination of semen mononuclear cells; and the correction for viable cells assayed with the assumption that dead cells contributed no drug to the concentration. These issues increased drug concentration variability.
In addition, this study did not use directed observed therapy (DOT), so adherence may have influenced the resulting PK estimates. The HPTN 066 study used DOT and showed that TFV-DP reached steady state in 7 days, with a resulting Css of 36 fmol/106 cells. The present study found a slightly longer time to steady state (∼11 days) and a higher Css (95 fmol/106 cells), which would not be expected with poorer adherence. The mechanism for the Css differences may stem from cell processing/counting differences, as the same laboratory assayed samples from both studies, and the concentrations were normalized to the reported number of cells in the sample. Consistent with this, FTC-TP in HPTN 066 was 2.2 pmol/106 cells, about the same percentage lower than that in this study (5.7 pmol/106 cells). 26 Adjusting concentrations to a more objective measure of cell number, such as DNA content, may help with comparability across studies. 64 Finally, some PK modeling in this study made assumptions of linear PK, which as mentioned above is likely not the case for intracellular TFV-DP and FTC-TP. 17,62,63
In conclusion, this study characterized the cellular pharmacology of TFV-DP and FTC-TP from first dose to steady state in multiple compartments in HIV-positive and HIV-negative males and females. The results demonstrate cell type and tissue-dependent cellular pharmacology, with preferential accumulation of TFV-DP in rectal mononuclear cells, and indicate that onset of antiviral effect is likely within 1 week of dosing in rectal and genital compartments. Together, these findings provide guidance for designing future PrEP studies and interpreting PrEP efficacy in various settings and populations.
Footnotes
Acknowledgments
We thank the CTRC personnel, the Colorado Antiviral Laboratory personnel, Dr. Cara Wilson who helped monitor safety, and especially the volunteers who participated. The lead author is funded through the Colorado HIV Research Training Program (grant no. 5 T32 AI 7447–23). This work was supported by U01 AI84735 and by NIH/NCATS Colorado CTSA grant no. UL1 TR001082. Contents are the authors' sole responsibility and do not necessarily represent official NIH views. Gilead Sciences donated drug for this study.
Author Disclosure Statement
Peter Anderson receives contract work and grant support from Gilead Sciences, paid to his institution. All other authors report no competing financial interests exit.
References
Supplementary Material
Please find the following supplemental material available below.
For Open Access articles published under a Creative Commons License, all supplemental material carries the same license as the article it is associated with.
For non-Open Access articles published, all supplemental material carries a non-exclusive license, and permission requests for re-use of supplemental material or any part of supplemental material shall be sent directly to the copyright owner as specified in the copyright notice associated with the article.