




Abstract
To estimate the nationwide and regional distribution of HIV-1 genotypes in China in the past three decades, province-specific HIV-1 molecular epidemiology data were derived from 260 independent studies of HIV molecular prevalence through searching PubMed, VIP Chinese Journal Database (VIP), China National Knowledge Infrastructure, and Wanfang Data from January 1981 to December 2015. The nationwide and regional distribution of HIV-1 genotypes was estimated by weighting the genotype distribution from each province- and risk-specific subpopulation with the number of reported cases in the corresponding subgroups in the relevant periods. A sharp transition of HIV-1 subtypes and recombinant distribution was observed in various risk groups and regions over time. CRF01_AE has rapidly surged among almost all risk groups and in all areas, and it has become dominant among men who have sex with men and heterosexuals. A wide variety of new circulating recombinant forms (CRFs) and unique recombinant forms (URFs) were rapidly appearing in several risk groups and regions. After 2007, CRF01_AE was the most prevalent strain, accounting for 42.5% of all national infections, followed by CRF07_BC (28.9%), subtype B′/B (10.9%), CRF08_BC (10.0%), and subtype C (2.8%). URFs and other CRFs were responsible for 2.6% and fewer than 1% of infections nationwide, respectively. The nationwide and regional distributions of HIV-1 subtypes and recombinants were sharply shifting in China. CRF01_AE and new CRFs played an increasing role in the nationwide or regional HIV pandemic. The nationwide diversity of HIV-1 poses a formidable challenge to HIV vaccine development and disease prevention.
Introduction
H
The high degree of diversity within a subtype or between subtypes, together with high rates of virus replication, is likely to limit the intra- and inter-subtype cross-reactivity of immune responses. 4 To increase the likelihood of vaccine-induced immune responses cross-reacting with circulating strains, immunogens should match as closely as possible viral sequences circulating in the target population. 5 Therefore, data on the nationwide and regional HIV diversity is important to inform rational vaccine design and development. 6 Furthermore, knowledge on HIV diversity can also provide information on pathogenicity of common strains, as well as insights into disease progression and transmission. 7
The first nationwide molecular epidemiological survey conducted in 1996–1998 showed that subtype B′/B (47.5%), subtype C (34.3%), and CRF01_AE (9.6%) were the most predominant strains in China. 8 However, the second and third surveys conducted in 2002–2003 and 2006 indicated that the proportions of HIV-1 genotypes have sharply shifted: Subtype B′/B and C have been displaced significantly by CRF07_BC, CRF01_AE, and CRF08_BC. Especially in sexual transmission groups, CRF01_AE has become the dominant strain. 9,10 Since the third nationwide molecular epidemiological survey in 2006, several studies have shown that the epidemic of HIV-1 genotypes was changing constantly due to the diversification of transmission routes, highly active anti-retroviral therapy, and continual emergence of new circulating recombinant forms (CRFs) in a recent decade in China. 11 –15 However, updated data on the nationwide and regional distribution of HIV-1 genotypes in China are limited. Here, we presented an analysis of the population and regional distribution of HIV-1 subtypes and recombinants for the periods ∼2006, 2007–2010, and 2011–2013 using published province-specific HIV-1 molecular epidemiology data, aiming at estimating the population and regional distribution of HIV-1 genotypes in China on trends.
Materials and Methods
Ethics statement
No ethical approval was needed for this study, because all data were based on a review of published literature.
Search strategy and selection criteria
Data on the distribution of HIV-1 subtypes and recombinants in individual provinces were obtained from a systematic review of published peer-reviewed research articles. The comprehensive literature review of HIV molecular epidemiology was conducted by searching Wanfang Data, China National Knowledge Infrastructure, VIP Chinese Journal Database, and PubMed from January 1, 1981 to December 31, 2015. We also did a manual search on relevant reference lists of published articles. The search strategy was a combination of Medical Subject Headings and free text terms. All types of quantitative molecular epidemiological studies (including cohort, prospective and retrospective, and cross-sectional) were eligible in this study if they reported the number of various genotype infections. In addition to information on HIV-1 genotypes, province, sampling year, transmission route/risk group, detection method, and the genome segment(s) analyzed were also derived from the reported articles. We excluded studies if they were a review, non-peer-reviewed local or government report, or conference abstract or presentation; diagnoses were done in Hong Kong Special Administrative Region, Macau Special Administrative Region, and Taiwan. We limited the language of these studies to English and Chinese.
The 31 provinces were grouped into six geographical regions according to the HIV-1 prevalence and socioeconomic status as per guidelines from the National Bureau of Statistics of China 2,16 : Northeastern, Eastern, South-central, Southwestern, Northwestern, and Northern, as specified in Table 1 and Figure 1.

Estimated distribution of HIV-1 genotypes in different regions in China by period. The country is divided into six regions consisting of groups of provinces as specified in the Materials and Methods section. Provinces forming a region are shaded in the same color. The colors representing the different HIV-1 genotypes are indicated in the legend on the upper right of the figure. The detailed data are shown in Supplementary Table S1.
The number of individuals living with HIV was calculated by dividing the number of year by the sum of people living with HIV published by the local Center for Disease Control and Prevention in every province in the relevant period.
The number of samples collected from a province as a proportion of the number of people living with HIV in the province (%).
Inner Mongolia, Qinghai, Ningxia, and Tibet were excluded from the analysis as in the absence of available data.
The number of people living with HIV in every province (cases reported) in the relevant period was calculated by dividing the number of year by the sum of people living with HIV published by the local Center for Disease Control and Prevention in the relevant year. To reduce the bias caused by small sample size and to assure statistical confidence, provinces that were selected for subsequent analysis should meet these criteria: For provinces with <200, 200–499, 500–999, 1,000–4,999, and ≥5,000 cases reported in each period (∼2006, 2007–2010, and 2011–2013), the sampling ratio (numbers of samples collected over numbers of HIV cases reported) and number of samples collected should be above 10.0% or 10, 8.0% or 20, 5.0% or 30, 2.0% or 50, and 1.0% or 50 in the relevant period, respectively. The sampling ratio for each province in various periods was shown in Table 1, and for each risk group it was shown in Table 2.
The number of individuals living with HIV was calculated by dividing the number of year by the sum of people living with HIV published by the local Center for Disease Control and Prevention in every region in the relevant period.
The number of samples collected from a region as a proportion of the number of people living with HIV in the region (%).
BT, blood transfusion; FPD, former plasma donors; HET, heterosexuals; IDUs, injecting drug users; MCT, mother to child transmission; MSM, men who have sex with men.
Data analysis
In calculating the prevalence of HIV-1 genotypes, we weighted the molecular genotyping data with the number of HIV cases reported in the given province in each period; this method was proposed by the third national HIV molecular epidemiologic survey
10
and the global HIV molecular epidemiologic survey.
17
The HIV-1 genotype distribution in each province in each period was determined by first multiplying the proportions of all subtypes and recombinants by the number of HIV cases reported in the same province and relevant period. The resulting numbers of each genotype in each province and each region were added up and used to calculate the proportions of the different subtypes and recombinants in each region. Provinces with no HIV-1 genotyping data available were not included in the analysis. The distribution of HIV-1 genotypes in individual provinces was weighted according to the number of HIV cases reported in each province to generate estimates of regional and national HIV-1 genotype distributions for the ∼2006, 2007–2010, and 2011–2013 period (Fig. 1 and Supplementary Table S1; Supplementary Data are available online at
Results
Primary HIV-1 genotype distribution data
HIV-1 genotype characterization data were collected from a total of 31,437 samples based on 260 reported studies involved in 27 provinces of mainland China (except Tibet, Inner Mongolia, Qinghai, and Ningxia) between 1995 and 2015. These samples include 2,621 IDUs, 4,412 heterosexuals (HET), 7,360 men who have sex with men (MSM), 2,920 former plasma donors (FPDs) and blood transfusion (BT) recipients, 158 mother to child transmission (MCT), and 13,966 unknown risk groups. The sampling years ranged from 1995 to 2013. In ∼2006, 2007–2010, and 2011–2013 periods, 6,295 samples from 25 provinces, 15,895 samples from 22 provinces, and 9,247 samples from 19 provinces were analyzed, respectively. The number of samples analyzed as a proportion of the number of HIV cases reported was higher in 2007–2010 (7.5%) than in ∼2006 (3.0%) and 2011–2013 (4.1%), respectively.
National distribution of HIV-1 subtypes and recombinants
A total of eight subtypes and 21 CRFs were identified in China, including subtypes A (including A1 and A2), B (including Europe B and Thailand B), C, D, F, G, H, and K; CRF01_AE, CRF02_AG, CRF03_AB, CRF06_cpx, CRF_07BC, CRF_08BC, CRF10_CD, CRF15_01B, CRF18_cpx, CRF29_BF, CRF55_01B, CRF57_BC, CRF59_01B, CRF61_BC, CRF62_BC, CRF64_BC, CRF65_cpx, CRF67_01B, CRF68_01B, CRF69_01B, and CRF01_AE-V. After 2007, CRF01_AE was the most prevalent strain, accounting for 42.5% of all national infections. CRF07_BC caused 28.9% of infections, followed by subtype B′/B (10.9%), CRF08_BC (10.0%), and subtype C (2.8%) (Fig. 1 and Supplementary Table S1). Unique recombinant forms (URFs) and other CRFs were responsible for 2.6% and fewer than 1% of infections nationwide, respectively.
Overall, the national distribution of genotypes was strikingly different among three periods. The CRF01_AE and CRF07_BC posed an increase in the national proportion of the epidemics; however, the epidemics caused by subtypes B, C and CRF08_BC continuously decreased (Fig. 1 and Supplementary Table S1). Before 2006, the most prevalent strain was subtype B, which accounted for 41.7% of all nationwide infections, followed by CRF01_AE (18.4%), CRF07_BC (16.2%), CRF08_BC (14.1%), and subtype C (5.1%). However, in 2007–2010, subtype B only accounted for 12.5% and continued to decrease to 9.6% in 2011–2013. Instead, CRF01_AE and CRF07_BC accounted for 41.1% and 25.3% in 2007–2010, respectively, and continued to increase to 43.7% and 32.1% in 2011–2013, respectively. CRF08_BC and subtype C accounted for 12.6% and 2.9% in 2007–2010, respectively, and decreased to 7.6% and 2.6% in 2011–2013, correspondingly.
Regional distribution of HIV-1 subtypes and recombinants
All subtypes, CRFs and URFs, were found in six regions. After 2007, the distribution of HIV-1 genotypes in each region showed a slight difference across the nation (Fig. 1 and Supplementary Table S1). In all regions except the northwestern, CRF01_AE was the dominant variant with a proportion more than 40%, especially in northeastern and eastern regions, where the proportion was more than 50%. In the northern, northeastern, and south-central regions, subtype B was the second most prevalent strain and the combined proportion of subtype B and CRF01_AE was more than three-quarters. Furthermore, in the southwestern region, the remainders were CRF07_BC (28.0%) and CRF08_BC (15.7%), with the remainder due to CRF07_BC (18.1%) and subtype B (16.4%) in the eastern region. However, in the northwestern region, the epidemic was nearly exclusively caused by CRF07_BC (87.2%), which was much higher than that in other regions.
The regional distribution of genotypes was strikingly different among three periods (Fig. 1). From ∼2006 to 2011–2013, a sharp increase of the epidemic of CRF01_AE was observed in all regions and the proportion increased by 36.8%, 7.0%, 16.8%, 31.2%, 35.2%, and 33.3% in northern, northwestern, southwestern, northeastern, south-central, and eastern regions, respectively. Likewise, the proportions of infection caused by CRF07_BC in southwestern, central, and eastern regions were also continuously increasing. On the contrary, the epidemic caused by subtype B in all regions except northwestern and northeastern regions, CRF08_BC in northern, southwestern, and eastern regions, as well as subtype C in northern, northwestern, southwestern, and eastern regions was continuously decreasing.
Provincial distribution of HIV-1 subtypes and recombinants
The geographic distribution of individual HIV-1 subtypes and recombinants across the nation after 2007 is shown in Figure 2 and Supplementary Table S2. The majority of national dominant CRF01_AE presented an overwhelming proportion (above 50%) in 15 of the 24 provinces, mainly in northeastern, eastern, south-central, southwestern, and some provinces in northern. Subtype B was mainly found in Henan (79.7%), Hubei, Hebei, Heilongjiang, and Anhui (above 40%), with the remainders in some provinces in northeastern, eastern, south-central, and southwestern regions. The CRF07_BC was mainly observed in northwestern, southwestern, and south-central regions, especially in Xinjiang (95.4%), Chongqing (75.0%), and Sichuan (64.0%). CRF08_BC was the fourth largest variant nationwide and was concentrated in Yunnan (31.2%), Guangxi (13.7%), Zhejiang (9.8%), and Chongqing (8.3%). Subtype C was the fifth largest subtype and was present mainly in Yunnan (11.4%). Other CRFs were differentially distributed over Guangdong (mainly CRF55_01B and CRF02_AG), Jilin (mainly CRF02_AG and CRF06_cpx), Shanghai (mainly CRF55_01B, CRF67_01B, CRF68_01B, CRF69_01B, and CRF02_AG), Anhui (mainly CRF55_01B), Beijing (mainly CRF55_01B, CRF02_AG, and CRF06_cpx), Fujian (mainly CRF61_BC and CRF55_01B), Zhejiang (mainly CRF55_01B, CRF59_01B, CRF18_cpx, CRF06_cpx, and CRF02_AG), and Shaanxi (mainly CRF55_01B). Yunnan was the most concentrated province of URFs (11.7%), mainly consisting of unique B/C recombinants, AE/BC recombinants, AE/C recombinants, and AE/B recombinants. The other URFs (mainly unique AE/B recombinants) were distributed over northeast, east, and some provinces in south-central and southwest.
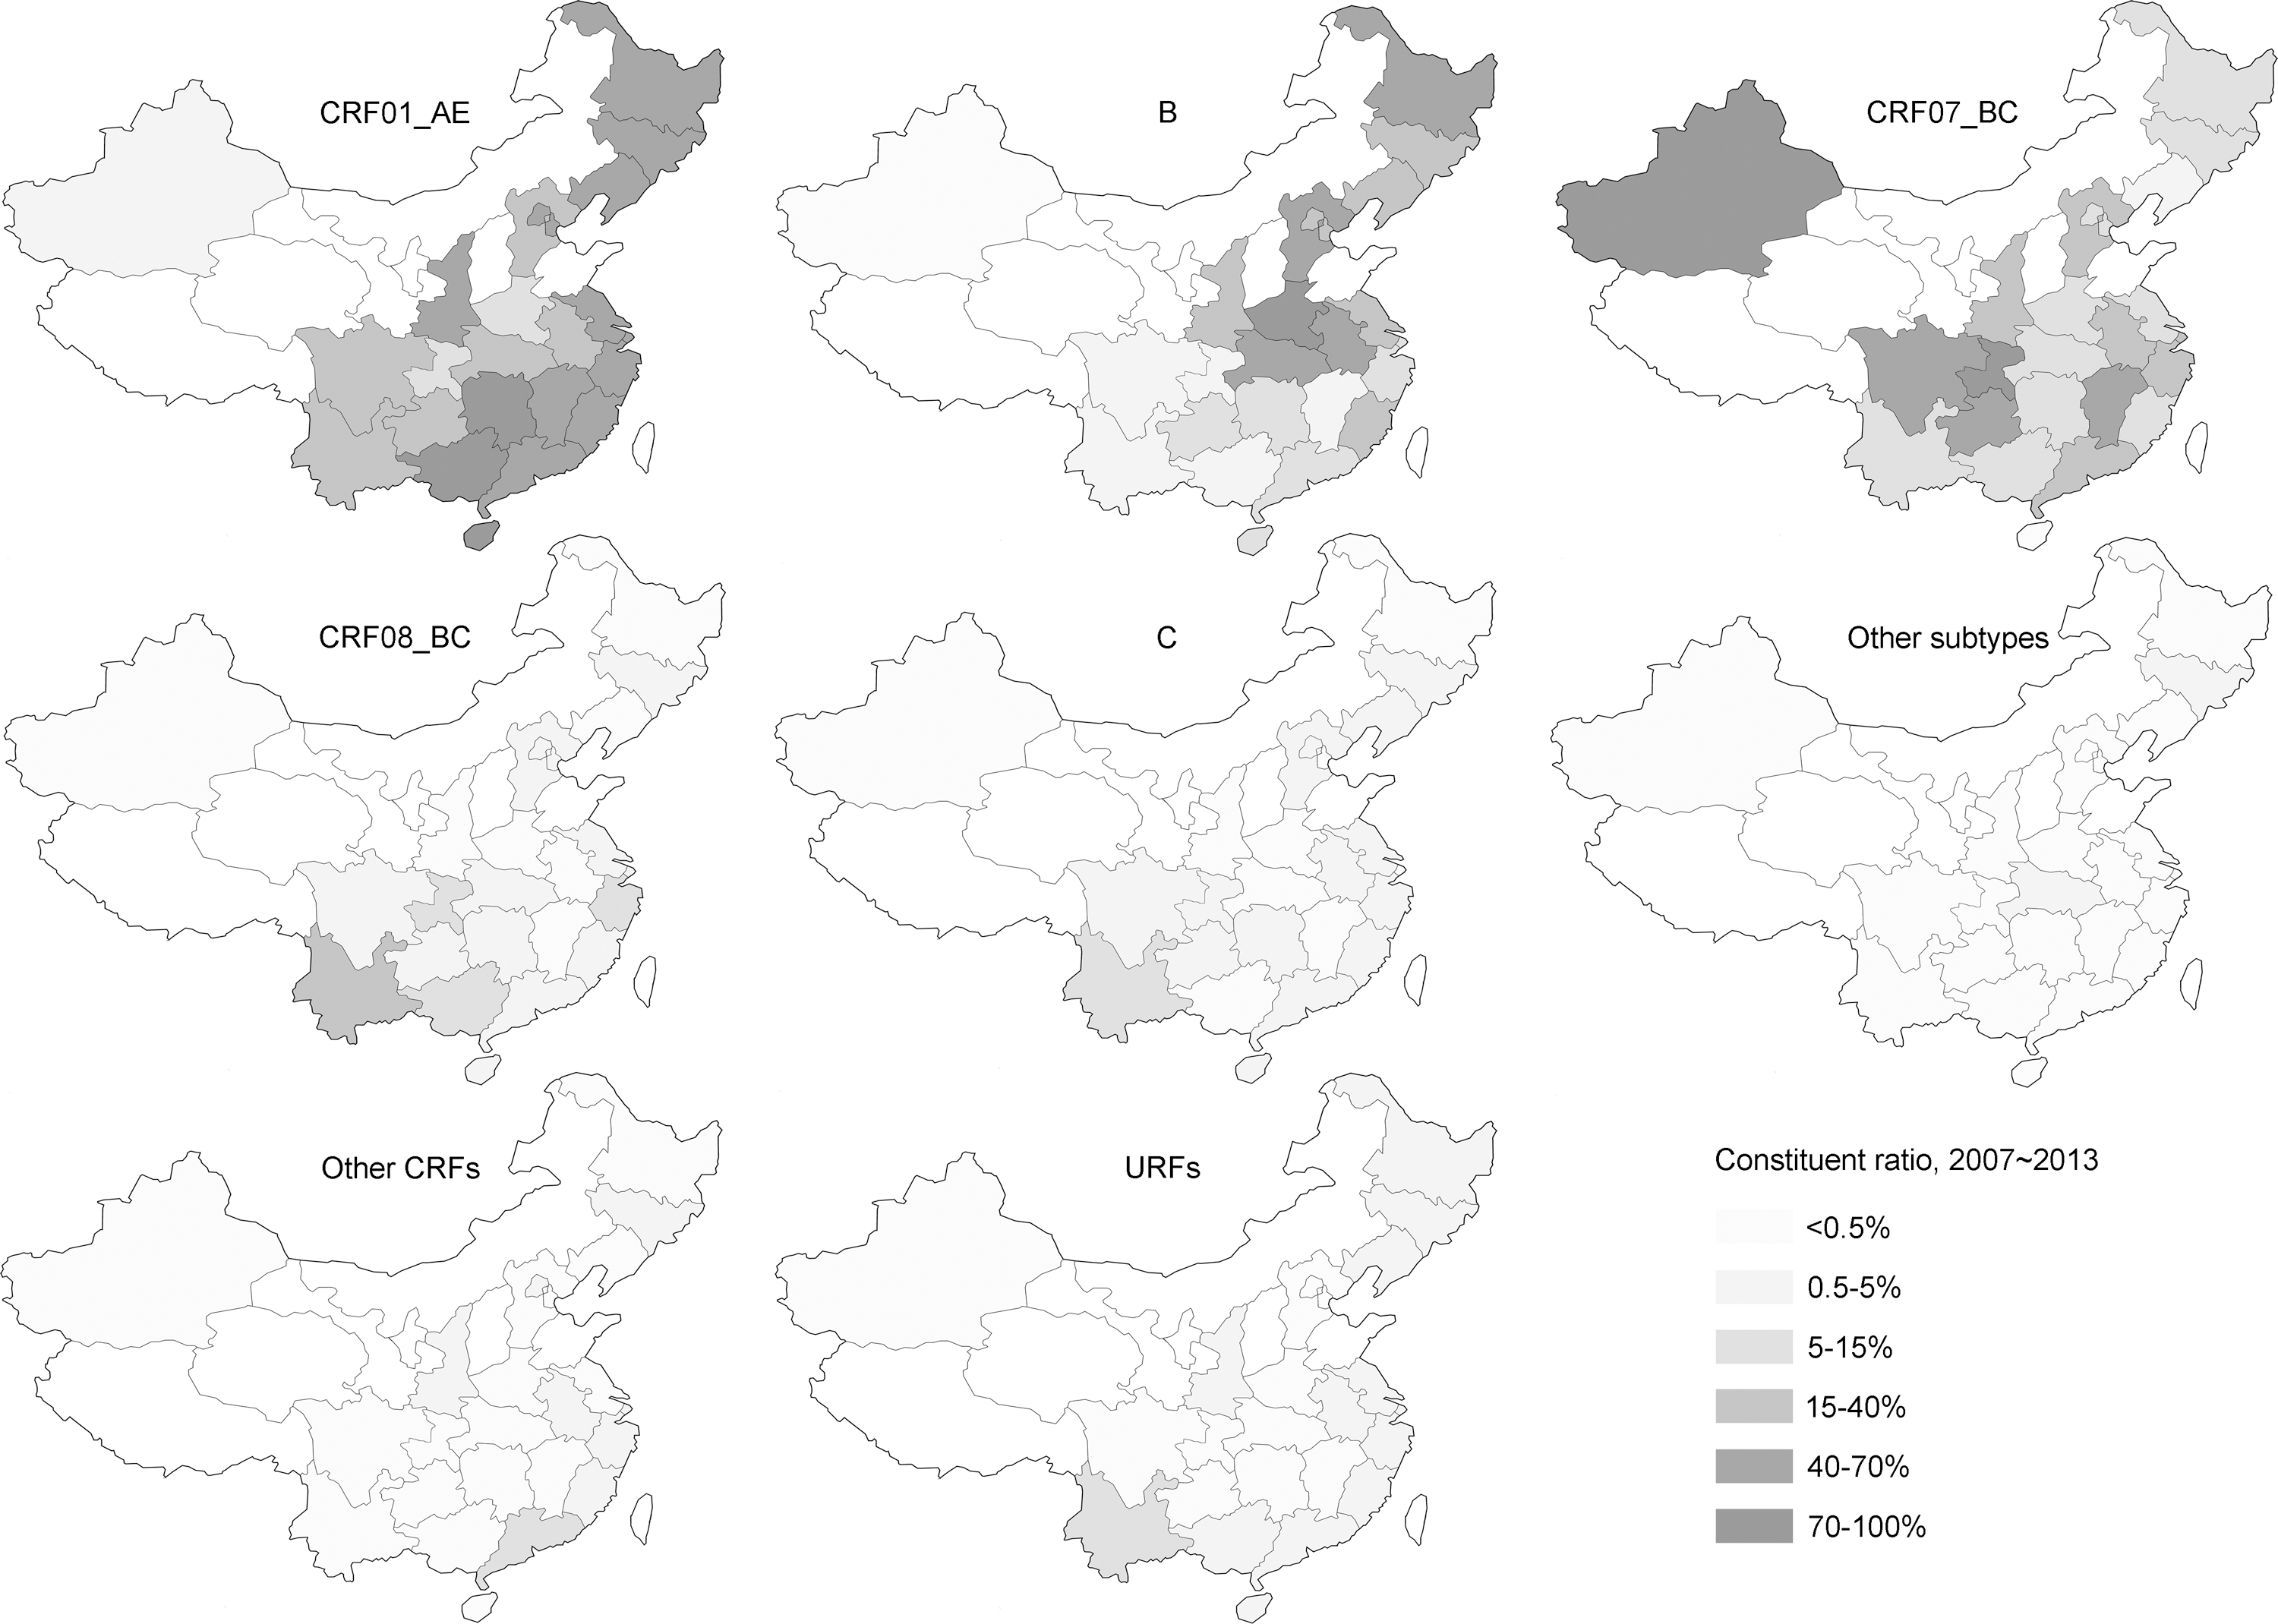
Estimated geographic distribution of HIV-1 genotypes in China after 2007. For each subtype/recombinant indicated, each province is shaded according to the proportion of the number of infections caused by the subtype/recombinant present in each province. The colors representing the different proportions of HIV-1 subtypes are indicated in the legend on the bottom right of the figure. The detailed data are shown in Supplementary Table S2.
The distribution of HIV-1 subtypes and recombinants by risk group
Overall, the distributions of HIV-1 subtypes and recombinants among various risk groups were changing dramatically, with CRF01_AE posing a striking increase among all risk groups except MCT (Fig. 3 and Supplementary Table S3). The distribution of HIV-1 subtypes and recombinants among MSM changed radically over time. Before 2006, subtype B (62.0%) and CRF01_AE (33.3%) were the two main genotypes, accounting for 95.3% of infections in this risk group. However, after 2007, the most prevalent genotypes among MSM shifted to CRF01_AE (56.4%) and CRF07_BC (22.5%). Even though the order of the proportions of dominant strains circulating among HET remained unchanged, a striking increase of CRF01_AE and a sharp decline of CRF08_BC, from ∼2006 to 2007–2013, could be observed (from 40.0% to 53.1%, and from 25.6% to 16.4%, respectively). Before 2006, CRF07_BC (35.3%), CRF08_BC (25.4%), and CRF01_AE (22.5%) were the three main genotypes circulating among IDUs. After 2007, the most predominant strain shifted to CRF08_BC (30.8%), followed by CRF01_AE (22.7%) and CRF07_BC (21.0%). Although the epidemics were nearly exclusively caused by subtype B among FPDs+BT recipients in all periods, a striking increase of CRF01_AE in 2011–2013 could be observed. In addition, the distribution of HIV-1 genotypes among MCT changed radically over time, whereas CRF08_BC, subtype B, CRF07_BC, and CRF01_AE were still four dominant strains all the time. Of note, a wide variety of new CRFs and URFs were gradually appearing in almost all risk groups after 2007, especially in IDUs, MSM, and HET.
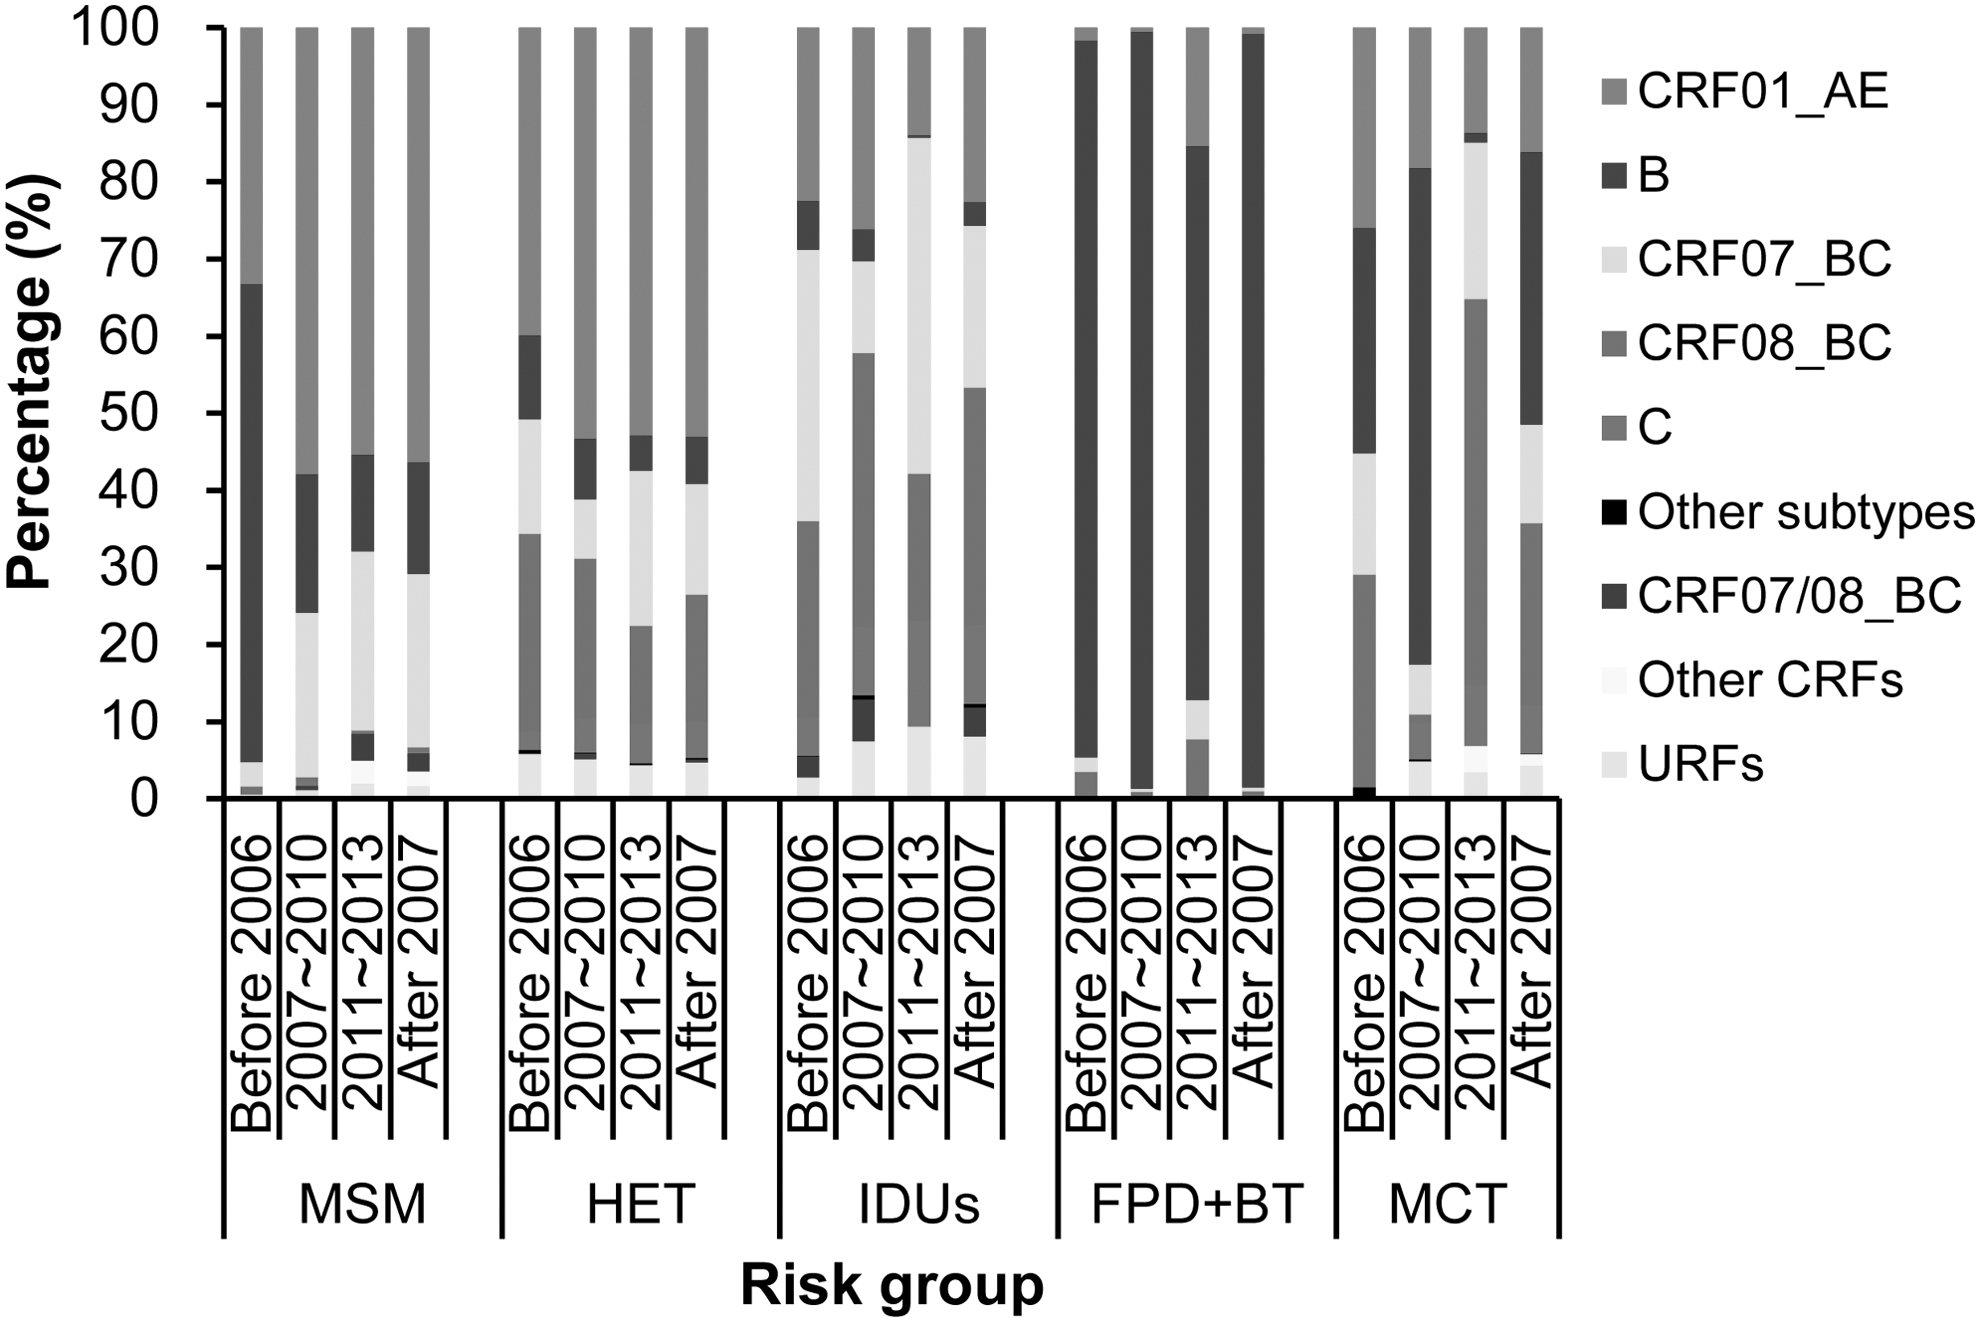
Estimated distribution of HIV-1 genotypes in each risk group in China by period. MSM, men who have sex with men; HET, heterosexuals; IDUs, injecting drug users; FPD+BT, former plasma donors and blood transfusion recipients; MCT, mother to child transmission. The detailed data are shown in Supplementary Table S3.
Discussion
This study provided a comprehensive overview about the dynamic epidemic trends of HIV genotypes in China at the national and provincial level based on integrated data from official sentinel surveillance and independent studies. The nationwide distribution of HIV-1 genotypes has dramatically changed over the past three decades in almost all regions and risk groups. Overall, we noted that there were three distinguishing features of HIV epidemics in China over time. First, the predominant genotypes have dramatically shifted in various risk groups and regions. Second, CRF01_AE has rapidly surged among almost all risk groups and in all areas, and it has become dominant among MSM and HET. Third, a wide variety of new CRFs and URFs were rapidly appearing in several risk groups and provinces.
In the early periods of HIV-1 epidemic in China, the geographical distribution of HIV-1 genotypes was mainly affected by the drivers of HIV-1 transmission. However, through the longitudinal comparison of three periods, we observed that the differences in viral diversity were diminishing among geographical regions. In contrast, a wide difference remained among various risk groups, except MSM and HET, all the time. This highlighted that the impact of risk behaviors on HIV viral diversity was stronger than that of geographical communities. 3,13 More benefits may be achieved from taking measures focused on curbing risk behaviors than regionally focused approaches. In addition, CRF07_BC was the most predominant strain in the northwestern region all the time, which indicated a strong regional founder effect in the local HIV epidemic region and suggested a lack of incoming transmissions from other regions. 10
Although CRF01_AE only accounts for 5% of HIV cases worldwide, it plays an important role in the regional HIV epidemics in south and southeast Asia, especially in China. 17 Since the first documented outbreak of CRF01_AE among female sex workers and IDUs in Yunnan and Guangxi in the early 1990s, 18,19 it has been transmitted to almost all risk groups and the general population nationwide. 20 In spite of the driving force for the rapid growth of CRF01_AE in China remaining unclear, previous studies implied that the explanations maybe multifactorial and include the rapid disease progression and transmission rate, 21,22 cross-transmission among various risk groups, 23 and improved transport links and migration. 24,25 A more rapid progression to AIDS has been observed in individuals infected with CRF01_AE than with other genotypes, and this rapid progression was associated with a higher proportion of CXCR4 co-receptor usage. 12,21,26 Increasing evidence on the stochasticity of HIV transmission and a high proportion of CXCR4-tropic viruses among recently diagnosed CRF01_AE-infected individuals indicate that this CRF is most probably seriously prevalent in early infections, 21,27 –29 which will pose a great challenge for the prevention and control efforts. The high prevalence of CXCR4-tropic viruses will also result in the loss of susceptibility to CCR5 inhibitor maraviroc in a large number of CRF01_AE-infected individuals in China. Additionally, the substantial interaction of various risk groups and the high mobility of millions of migrants provided an ideal setting for CRF01_AE involved in recombining multiple new CRFs such as CRF55_01B, 30 CRF59_01B, 31 CRF67_01B, CRF68_01B, 32 and CRF65_cpx. 33 These indicated that CRF01_AE will have a significant influence on the epidemic of HIV-1 in China; thus, it is urgent to implement comprehensive control strategies to limit the severe epidemic of this CRF.
After B/C recombinants (CRF07_BC and CRF08_BC) first being identified in Xinjiang, several new CRFs were also identified in China in recent years. For instance, CRF55_01B were identified among MSM in Shenzhen, Shanghai, and Anhui, 30,34 CRF59_01B among MSM in Liaoning, Guangdong, Yunnan, and Hunan, 31 CRF61_BC among HET in Fujian, 35 CRF57_BC, 36 CRF62_BC, 37 CRF64_BC, 38 and CRF65_cpx 33 among IDUs/HET in Yunnan, and CRF01_AE-V among HET in Guangxi. 39 Although these new CRFs only account for fewer than 1% of infections nationwide, they play an essential role in the regional HIV epidemic. For instance, CRF55_01B accounted for more than 10% among MSM in Shenzhen after 2008 and spread to Shanghai and Anhui. 30,34 The rapid appearance of a wide variety of new CRFs in several risk groups and provinces poses a great challenge for antiretroviral therapy and vaccine development of HIV. Yunnan is a “key HIV starter” in China and still has a rise of a bunch of URFs, which is likely a sign of unsafe drug use practices and the substantial interaction between IDUs and other risk groups. 40 The continuous appearance of URFs implied the probability of emergence of new CRFs. So the importance of prevention on HIV transmission among IDUs in this province should be re-emphasized.
Our study has some limitations. First, some regions had poor coverage because of lacking valid data or excluding some subgroups of very low prevalence from calculation during adjustment of genotype prevalence for risk- and province-specific subgroups, such as Inner Mongolia, Qinghai, Ningxia and Tibet (Table 1). Second, risk assessment was also subject to biases, as it is estimated that about 10% MSM could be misclassified as HET. 41 Third, some CRFs may have been misclassified as recombinants or URFs in the earlier period, given the time of establishment of rules governing CRF nomenclature. 42 Fourth, publication bias may have occurred in the data derived from the literature. Fifth, the quality of literature was not evaluated on aspects of study design, sample size, and sampling method, which maybe bias the representativeness of samples.
This study illustrates the dynamic epidemic of HIV/AIDS in various regions and risk groups in China. These results provide critical information for vaccine research and for designing effective interventions to limit HIV transmission in China. Vaccine research and development efforts should be tailored toward an increasing number of genotypes and accurate regional distribution for the development of broadly protective vaccines. HIV prevention requires consideration for strategic prioritization of effective and efficient allocation of budgets. Urgent implementation of comprehensive control measures is necessary to limit the severe epidemic of CRF01_AE strain in China. At sub-national levels, effective prevention activities should be carried out in “HIV incubator” regions and “HIV accelerator” regions for reducing the rapid surge and dissemination of new CRFs. More intervention strategies should be focused on “HIV bridge population,” multiple high-risk behavior individuals, sexually active people, and super spreaders. Budgets also need to shift funding toward programs that target these key regions and the core population in effective intervention activities.
Footnotes
Acknowledgments
The authors very gratefully acknowledge the Centers for Disease Control and Prevention of all provinces, which published the number of people living with HIV in the relevant period, and without these data this study would not have been possible. This study was supported by the Fundamental Research Funds for the Central Universities and Research Innovation Program for College Graduates of Jiangsu Province (KYLX15_0173), the National Science and Technology Major Project for Infectious Disease Control and Prevention (2012-ZX10001-002), the National Natural Science Foundation of China (no. 81273143), and the 11th High-level Talents Cultivation and Funded Project of “Six Talent Peak” of Jiangsu Province (2014-WSN-40). The funders had no role in the study design, data collection and analysis, decision to publish, or preparation of the article. The opinions expressed here show the collective views of the coauthors and do not necessarily represent the official position of the National Health and Family Planning Commission of the People's Republic of China nor the National Center for AIDS/STD Control and Prevention, the Chinese Center for Diseases Control and Prevention.
Author Disclosure Statement
No competing financial interests exist.
References
Supplementary Material
Please find the following supplemental material available below.
For Open Access articles published under a Creative Commons License, all supplemental material carries the same license as the article it is associated with.
For non-Open Access articles published, all supplemental material carries a non-exclusive license, and permission requests for re-use of supplemental material or any part of supplemental material shall be sent directly to the copyright owner as specified in the copyright notice associated with the article.
